. 2024 Jan 2:13:giae100.
doi: 10.1093/gigascience/giae100.

A dataset profiling the multiomic landscape of the prefrontal cortex in amyotrophic lateral sclerosis

Affiliations

A dataset profiling the multiomic landscape of the prefrontal cortex in amyotrophic lateral sclerosis

Fabian Hausmann et al. Gigascience. .

Abstract

Amyotrophic lateral sclerosis (ALS) is the most common motor neuron disease, which still lacks effective disease-modifying therapies. Similar to other neurodegenerative disorders, such as Alzheimer and Parkinson disease, ALS pathology is presumed to propagate over time, originating from the motor cortex and spreading to other cortical regions. Exploring early disease stages is crucial to understand the causative molecular changes underlying the pathology. For this, we sampled human postmortem prefrontal cortex (PFC) tissue from Brodmann area 6, an area that exhibits only moderate pathology at the time of death, and performed a multiomic analysis of 51 patients with sporadic ALS and 50 control subjects. To compare sporadic disease to genetic ALS, we additionally analyzed PFC tissue from 4 transgenic ALS mouse models (C9orf72-, SOD1-, TDP-43-, and FUS-ALS) using the same methods. This multiomic data resource includes transcriptome, small RNAome, and proteome data from female and male samples, aimed at elucidating early and sex-specific ALS mechanisms, biomarkers, and drug targets.

Keywords: amyotrophic lateral sclerosis; early disease mechanisms; multiomics analysis; neurodegeneration; prefrontal cortex.


Conflict of interest statement

The authors declare no competing interests.

Figures
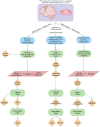
Figure 1:
Figure 1:
Overview of the bioinformatics workflow for RNA-seq, small RNA-seq, and proteomics data. Methods and processing scripts are shown in orange diamonds, high-throughput technologies depicted in blue rectangles with round edges, datasets available on disk in green rectangles with round edges, and Nextflow pipelines in red parallelograms. For the Nextflow pipelines, only a few steps are named here. The RNA-seq pipeline (v3.0) and the small RNA-seq smRNA-seq pipeline (v1.0) were used.
Figure 2:
Figure 2:
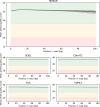
Demonstration of overall quality of reads on the transcriptome level. Mean phred quality scores, as reported by FastQC of the RNA-seq data, are displayed. Regions are colored according to FastQC’s quality definitions (greed: good, orange: okay, red: bad). Overall all reads show a good quality.
Figure 3:
Figure 3:
Demonstration of overall quality of reads on small RNA data level. Mean phred quality scores as reported by FastQC are displayed. Regions are colored according to FastQC’s quality definitions (greed: good, orange: okay, red: bad). For SOD1 and TDP43, the expected length after trimming is indicated by the gray-dotted line; for the others, only the expected length of reads was provided. Overall all reads show a good quality.
Figure 4:
Figure 4:
Verification of sex on the transcriptome level. VST-transformed XIST expression in human and mouse RNA-seq experiments colored by sex. XIST expression confirms the correct sex annotation.
Figure 5:
Figure 5:
Verification of the transgenic animals. (A) Fraction of reads from the RNA-seq experiments aligning against the human genome in the region of the Fus, Sod1, and Tardbp genes (±200 bp) in the corresponding mouse model. Reads aligning against the human genome confirm that the corresponding samples express the transgenic transcript correctly. (B) Number of reads mapping to the pEGFP construct (U76561.1) using blastn [36] (v2.15.0) in C9orf72 transgenic animals.
Figure 6:
Figure 6:
Overall quality of transformed transcriptomic data. Histogram of VST-transformed expression values with samples on the x-axis colored by sex and condition. No strong difference between the sexes and conditions could be observed.
Figure 7:
Figure 7:
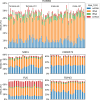
Evaluation of batch effects (sex and condition). Bar chart of miRTrace quality checks with samples on the x-axis colored by detected RNA type. The fraction of reads that could not be assigned to any of the RNA types is not displayed. No strong difference between the sexes or conditions could be observed.
Figure 8:
Figure 8:
Overall quality of transformed small RNA-seq data. Histogram of normalized mature miRNA expression values with samples on the x-axis colored by sex and condition. No strong difference between the sexes and conditions could be observed.
Figure 9:
Figure 9:
Completeness of raw proteomics data. Fraction of measured zeros in the proteomics experiments colored by sex. No difference in the distribution between the sexes and the condition could be detected.
Figure 10:
Figure 10:
Overall quality of transformed proteomics data. Histogram of normalized protein abundance values with samples on the x-axis colored by sex and condition. No strong difference between the sexes and conditions could be observed.
Figure 11:
Figure 11:
Evaluation of proteomics differential protein abundance analysis. Calibration plots for case vs. control differential protein abundance analysis to check if the P values respect the assumptions of classical FDR control procedures. A high (close to 100%) differential concentration (in green) and a low uniformity underestimation (close to 0) are preferred.
Figure 12:
Figure 12:
Top modifications found by the open modification search using ionbot for the 4 mouse models and human samples. For each model, the top 10 modifications were selected and the number of occurrences of the union of those (17 modifications) is displayed. Fixed modifications (Carbamidomethyl, Oxidation, Acetyl[N-term]) and sequence variations (Glu→Ser, Arg→Orn, Ser→Ala, Gln→pyro-Glu, Xle→Pro, Tyr→Phe, Delta:H(2)C(2)[N-term]) were removed for display.
Figure 13:
Figure 13:
Evaluation of batch effects using PCA. PCA of human transcriptomics (A) and proteomics (B) data. The 500 most variable genes for the transcriptomics data and all proteins for the proteomics data were used.

References

    1. Goutman SA. Diagnosis and clinical management of amyotrophic lateral sclerosis and other motor neuron disorders. Contin Minneap Minn. 2017;23:1332–59. 10.1212/con.0000000000000535. - DOI - PubMed
    1. Suzuki N, Nishiyama A, Warita H, et al. . Genetics of amyotrophic lateral sclerosis: seeking therapeutic targets in the era of gene therapy. J Hum Genet. 2023;68:131–52. 10.1038/s10038-022-01055-8. - DOI - PMC - PubMed
    1. Chia R, Chiò A, Traynor BJ. Novel genes associated with amyotrophic lateral sclerosis: diagnostic and clinical implications. Lancet Neurol. 2018;17:94–102. 10.1016/s1474-4422(17)30401-5. - DOI - PMC - PubMed
    1. Talbott EO, Malek AM, Lacomis D. The epidemiology of amyotrophic lateral sclerosis. Handb Clin Neurol. 2016;138:225–38. 10.1016/b978-0-12-802973-2.00013-6. - DOI - PubMed
    1. Kim G, Gautier O, Tassoni-Tsuchida E, et al. . ALS genetics: gains, losses, and implications for future therapies. Neuron. 2020;108:822–42. 10.1016/j.neuron.2020.08.022. - DOI - PMC - PubMed