. 2025 Jan 15;139(1):55-67.
doi: 10.1042/CS20242144.

Distinct effects of obesity and diabetes on the action potential waveform and inward currents in rat ventricular myocytes

Affiliations

Distinct effects of obesity and diabetes on the action potential waveform and inward currents in rat ventricular myocytes

Anatoliy Shmygol et al. Clin Sci (Lond). .

Abstract

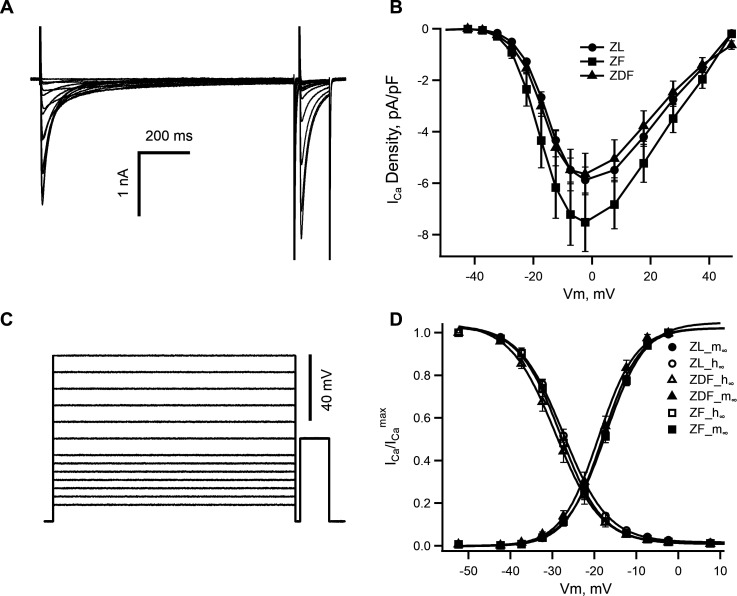
Obesity is a significant global health challenge, increasing the risk of developing type 2 diabetes mellitus (T2DM) and cardiovascular disease. Research indicates that obese individuals, regardless of their diabetic status, have an increased risk of cardiovascular complications. Studies suggest that these patients experience impaired electrical conduction in the heart, although the underlying cause-whether due to obesity-induced fat toxicity or diabetes-related factors-remains uncertain. This study investigated ventricular action potential parameters, as well as sodium (INa) and calcium (ICa, L) currents, in Zucker fatty (ZF) rats and Zucker diabetic fatty (ZDF) rats, which serve as models for obesity and T2DM, respectively. Ventricular myocytes were isolated from 25- to 30-week-old Zucker rats. Resting and action potentials were recorded using a β-escin perforated patch clamp, while INa and ICa,L were assessed with whole-cell patch clamp methods. ZF rats exhibited higher excitability and faster upstroke velocity with greater INa density, whereas ZDF rats showed decreased INa and slower action potential upstroke. No differences in ICa,L density or voltage sensitivity were found among the groups. In summary, obesity, with or without accompanying T2DM, distinctly impacts the action potential waveform, INa density, and excitability of ventricular myocytes in this rat model of T2DM.

Keywords: Zucker rat; action potential; type 2 diabetes; voltage-gated Ca2+current; voltage-gated Na+current.


Conflict of interest statement

The authors declare that there are no competing interests associated with the manuscrip

Figures

Figure 1
Figure 1. Properties of the L-type Ca2+ current (I(Ca,L)) in myocytes from ZL, ZF and ZDF rats.
(A) Typical records of I(Ca,L) from a left ventricular myocyte of a ZF rat. (B) ‘I(Ca, L) –Vm’ relationships in ZL, ZF and ZDF rats. Data points represent mean ± SEM; n = 15 ZL, 15 ZF and 13 ZDF cells from 4 ZL, 6 ZF and 5 ZDF rats. (C) An illustration of the voltage clamp protocol used for evaluation of the I(Ca L) characteristics. (D) A superposition of steady-state activation and inactivation curves reveals similar voltage dependence of the I(Ca,L) gating in ZL, ZF and ZDF rats.
Figure 2
Figure 2. Parameters of resting and action potentials in myocytes from ZL, ZF and ZDF rats.
(A) The violin plot of the pre-existent resting potential values in myocytes from ZL (left), ZF (middle) and ZDF (right) rats. The widest part of each violin corresponds to the highest distribution density of individual data points. ZF rats had more negative resting potential than the other two groups. (B) The violin plots of threshold potentials in ZL, ZF and ZDF rats. Threshold potential was measured as minimal depolarization evoked by a 1 s stimulating current pulse at which an action potential was triggered. Stimuli of lower intensity eliciting only passive electronic responses were considered subthreshold. For all subsequent recordings made in any particular cell, the 1.5 times stronger suprathreshold stimuli were used. (C) The violin plots of the action potential upstroke velocity (dV/dt max) at 5 H and 10 Hz pacing rate in ZL, ZF and ZDF rats. Bold horizontal lines in each violin denote the median of each data set. The largest drop in dV/dtmax values in response to the increase in stimulation rate from 5 Hz and 10 Hz was observed in ZF rats. (D) Ventricular myocytes from ZF and ZDF rats show increased duration of the evoked action potentials. The myocytes were paced at 1, 2, 5 and 10 Hz, and action potential duration was measured at 50%, 75% and 90% repolarization. White, grey and black bars represent the mean values correspondingly in ZL, ZF and ZDF rats. The error bars represent the standard deviation.
Figure 3
Figure 3. Representative current-clamp recordings from isolated ventricular myocytes.
The myocytes shown on the right-hand side of each panel were isolated from (A) Zucker Lean (ZL) rats; (B) ZF rats, and (C) ZDF rats. The left-hand side of each panel shows superimposed action potential tracings evoked by 1 ms threshold current pulse at zero holding current and after applying negative holding current to bring the resting potential to –80 mV. The numbers at the beginning of each trace show the resting potential values before and after the application of holding current. The white bars in each image on the right-hand side represent 20 µm.
Figure 4
Figure 4. Comparison of voltage-gated Na+ currents in myocytes from ZL, ZF, and ZDF rats.
(A) Representative traces of INa elicited by depolarizing voltage clamp pulses (the voltage protocol is shown in the lower panel on the right). (B) Averaged ‘INa–Vm’ curves (left-hand side panel) show a significantly increased INa amplitude in ZF rats in comparison with ZL and ZDF rats. The right-side panel shows the voltage dependence of INa activation. Sodium conductance (G) was derived from the ‘INa–Vm’ curves on the left and normalized to the maximum (Gmax) in each group of rats. The peak of the ‘INa–Vm’ curve was significantly higher in the ZF group. There was no shift in the ‘GNa–Vm’ curves along the voltage axis in any of the three groups of animals.

Similar articles

References

    1. Cho N.H., Shaw J.E., Karuranga S., Huang Y., Da Rocha Fernandes J.D., Ohlrogge A.W., et al. IDF Diabetes Atlas: global estimates of diabetes prevalence for 2017 and projections for 2045. Diabetes Res. Clin. Pract. 2018;138:271–281. doi: 10.1016/j.diabres.2018.02.023. - DOI - PubMed
    1. Hossain P. Obesity and diabetes in the developing world — a growing challenge. N. Engl. J. Med. 2007;356:213–215. doi: 10.1056/NEJMp068177. - DOI - PubMed
    1. Zimmet P., Alberti K.G.M.M., Shaw J. Global and societal implications of the diabetes epidemic. Nat. New Biol. 2001;414:782–787. doi: 10.1038/414782a. - DOI - PubMed
    1. Weyer C., Funahashi T., Tanaka S., Hotta K., Matsuzawa Y., Pratley R.E., et al. Hypoadiponectinemia in obesity and type 2 diabetes: close association with insulin resistance and hyperinsulinemia. J. Clin. Endocrinol. Metab. 2001;86:1930–1935. doi: 10.1210/jcem.86.5.7463. - DOI - PubMed
    1. Chandrasekaran P., Weiskirchen R. The role of obesity in type 2 diabetes mellitus-an overview. Int. J. Mol. Sci. 2024;25:1882. doi: 10.3390/ijms25031882. - DOI - PMC - PubMed