

Effects of Pemafibrate on LDL-C and Related Lipid Markers in Patients with MASLD: A Sub-Analysis of the PEMA-FL Study
- PMID: 39694503
- PMCID: PMC12237786
- DOI: 10.5551/jat.65395
Effects of Pemafibrate on LDL-C and Related Lipid Markers in Patients with MASLD: A Sub-Analysis of the PEMA-FL Study
Abstract
Aim: In the PEMA-FL study in patients with metabolic dysfunction-associated steatotic liver disease (MASLD), pemafibrate was shown to significantly decrease low-density lipoprotein cholesterol (LDL-C) levels. We aimed to investigate the mechanisms of pemafibrate-induced LDL-C reduction in patients with MASLD by conducting an additional sub-analysis of the PEMA-FL study.
Methods: The PEMA-FL study randomized 118 patients with MASLD to receive pemafibrate or placebo for 72 weeks. This sub-analysis examined the percentage change in LDL-C and related lipid markers by tertile of baseline LDL-C levels and the correlation between these changes in the pemafibrate group.
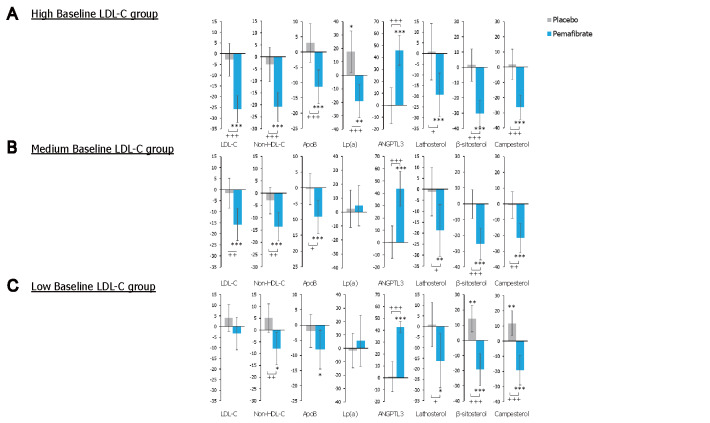
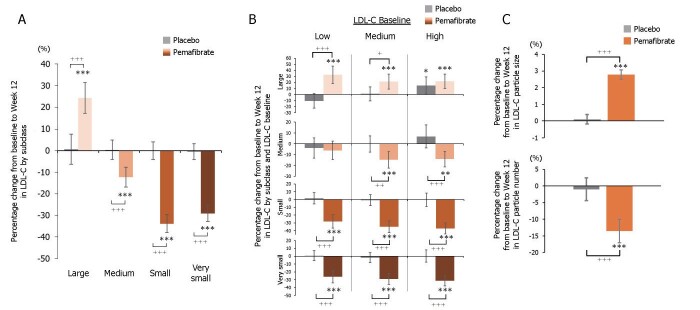
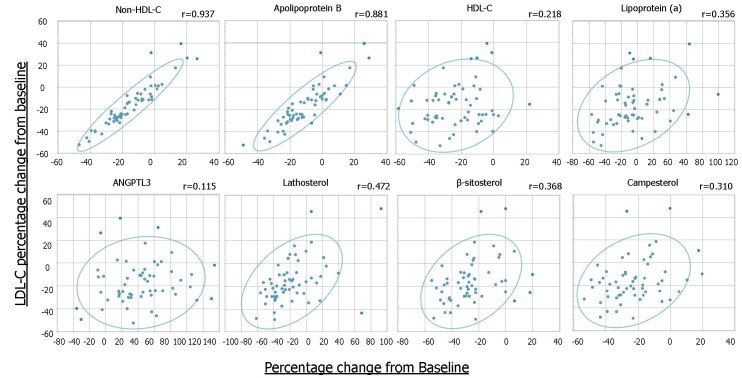
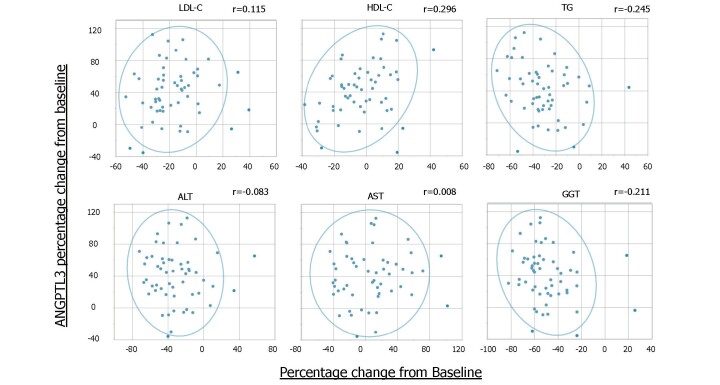
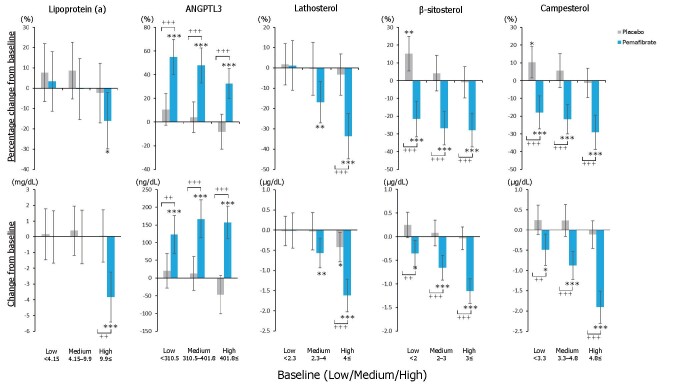
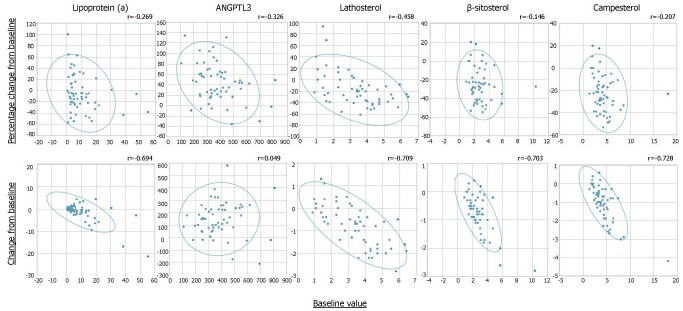
Results: Pemafibrate significantly decreased LDL-C levels approximately 25% (p<0.001 at all timepoints) from baseline in the highest tertile of baseline LDL-C levels (≥ 137.5 mg/dL), with similar trends for non-high-density lipoprotein cholesterol (non-HDL-C) and apolipoprotein B (ApoB) levels. Lipoprotein (a) [Lp(a)] levels decreased only in patients with the highest baseline LDL-C levels. Regardless of the baseline LDL-C levels, pemafibrate altered the LDL particle profile (increased LDL particle size and decreased the number); reduced lathosterol, β-sitosterol, and campesterol; and increased angiopoietin-like protein 3 (ANGPTL3). The percentage change in LDL-C positively correlated with that in ApoB, non-HDL-C, Lp(a), lathosterol, β-sitosterol, and campesterol but not HDL-C and ANGPTL3.
Conclusion: Pemafibrate reduced LDL-C, ApoB, and non-HDL-C levels in patients with MASLD, and the effect was greater in those with higher baseline LDL-C levels. Pemafibrate may clinically benefit patients with MASLD by improving LDL-C levels and the LDL particle profile.
Keywords: Cholesterol absorption; Cholesterol synthesis; Lipoprotein (a); Low-density lipoprotein; Metabolic dysfunction-associated steatotic liver disease.
Conflict of interest statement
Declaration of personal interests: A Nakajima has received research funding and grants from Kowa Company, Ltd; Y Eguchi has nothing to disclose. H Takahashi has received grants from Abbvie, GSK; payments for speaker from Kowa Company Ltd, Taisho Pharma, and Novo Nordisk. R Loomba serves as a consultant to Aardvark Therapeutics, Altimmune, Arrowhead Pharmaceuticals, AstraZeneca, Cascade Pharmaceuticals, Eli Lilly, Gilead, Glympse bio, Inipharma, Intercept, Inventiva, Ionis, Janssen Inc., Lipidio, Madrigal, Neurobo, Novo Nordisk, Merck, Pfizer, Sagimet, 89 bio, Takeda, Terns Pharmaceuticals, and Viking Therapeutics. Also, he has stock options in Sagimet biosciences. In addition, his institution received research grants from Arrowhead Pharmaceuticals, AstraZeneca, Boehringer-Ingelheim, Bristol-Myers Squibb, Eli Lilly, Galectin Therapeutics, Gilead, Intercept, Hanmi, Inventiva, Ionis, Janssen, Madrigal Pharmaceuticals, Merck, Novo Nordisk, Pfizer, Sonic Incytes, and Terns Pharmaceuticals. He is a co-founder of LipoNexus Inc. S Yamashita has received consulting fees from Kowa Company, Ltd., Otsuka Pharmaceutical Co., Ltd., and Immuno-Biological Laboratories Co., Ltd.; payment for lecture from Kowa Company, Ltd., Novartis Pharma K.K., MSD, and Tsumura & CO; R Tanigawa, H Suganami, M Tanahashi, A Saito, and Y Iida are employees of Kowa Company, Ltd.
Figures

References
-
- Cusi K, Isaacs S, Barb D, Basu R, Caprio S, Garvey WT, Kashyap S, Mechanick JI, Mouzaki M, Nadolsky K, Rinella ME, Vos MB, and Younossi Z: American Association of Clinical Endocrinology Clinical Practice Guideline for the Diagnosis and Management of Non-alcoholic Fatty Liver Disease in Primary Care and Endocrinology Clinical Settings: Co-Sponsored by the American Association for the Study of Liver Diseases (AASLD). Endocr Pract, 2022; 28: 528-562 - PubMed
-
- Rinella ME, Lazarus JV, Ratziu V, Francque SM, Sanyal AJ, Kanwal F, Romero D, Abdelmalek MF, Anstee QM, Arab JP, Arrese M, Bataller R, Beuers U, Boursier J, Bugianesi E, Byrne CD, Castro Narro GE, Chowdhury A, Cortez-Pinto H, Cryer DR, Cusi K, El-Kassas M, Klein S, Eskridge W, Fan J, Gawrieh S, Guy CD, Harrison SA, Kim SU, Koot BG, Korenjak M, Kowdley KV, Lacaille F, Loomba R, Mitchell-Thain R, Morgan TR, Powell EE, Roden M, Romero-Gómez M, Silva M, Singh SP, Sookoian SC, Spearman CW, Tiniakos D, Valenti L, Vos MB, Wong VW, Xanthakos S, Yilmaz Y, Younossi Z, Hobbs A, Villota-Rivas M and Newsome PN; NAFLD Nomenclature consensus group: A multisociety Delphi consensus statement on new fatty liver disease nomenclature. Hepatology, 2023; 78: 1966-1986 - PMC - PubMed
-
- European Association for the Study of the Liver; European Association for the Study of Diabetes; European Association for the Study of Obesity; and Clinical Practice Guideline Panel: EASL-EASD-EASO Clinical Practice Guidelines on the management of metabolic dysfunction-associated steatotic liver disease (MASLD). J Hepatol, 2024 (Epub ahead of print)
Publication types
MeSH terms
Substances
LinkOut - more resources
Full Text Sources
Medical
Miscellaneous