. 2025 Feb 1;328(2):F218-F229.
doi: 10.1152/ajprenal.00058.2024. Epub 2024 Dec 18.

Intestinal barrier function declines during polycystic kidney disease progression

Affiliations

Intestinal barrier function declines during polycystic kidney disease progression

Randee Sedaka et al. Am J Physiol Renal Physiol. .

Abstract

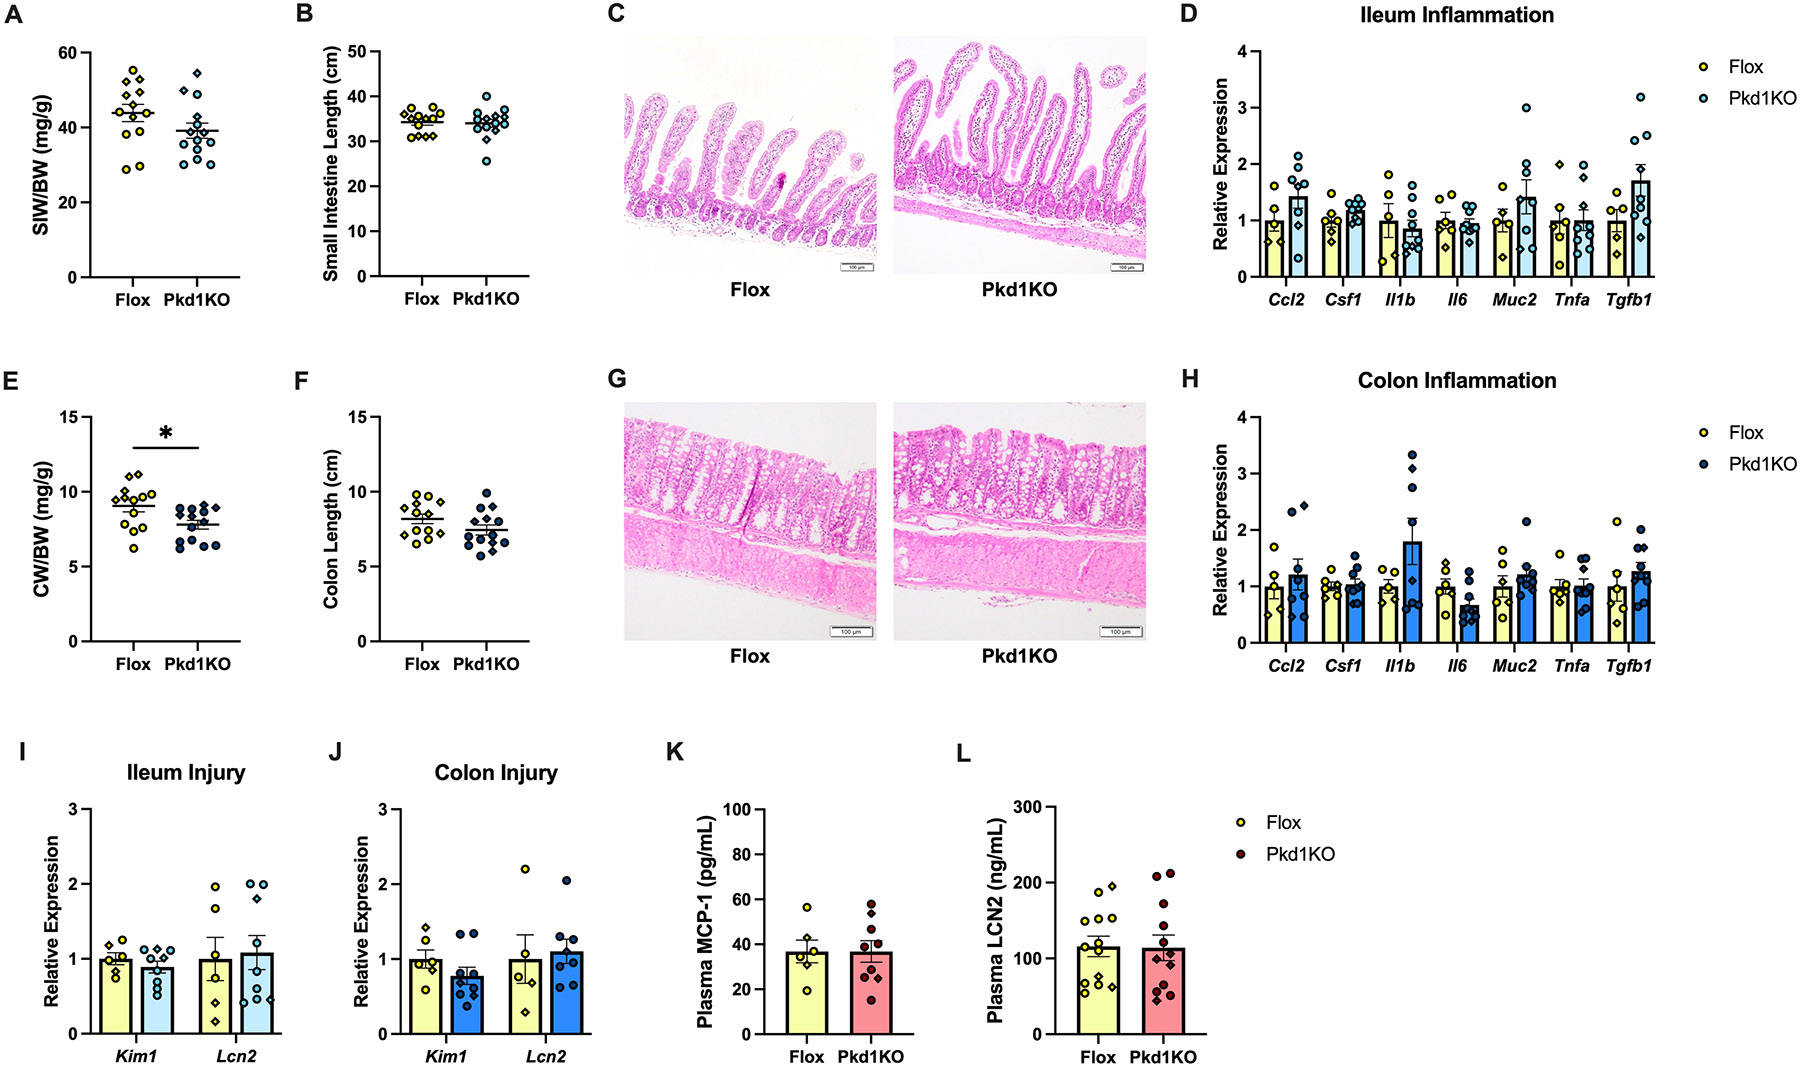
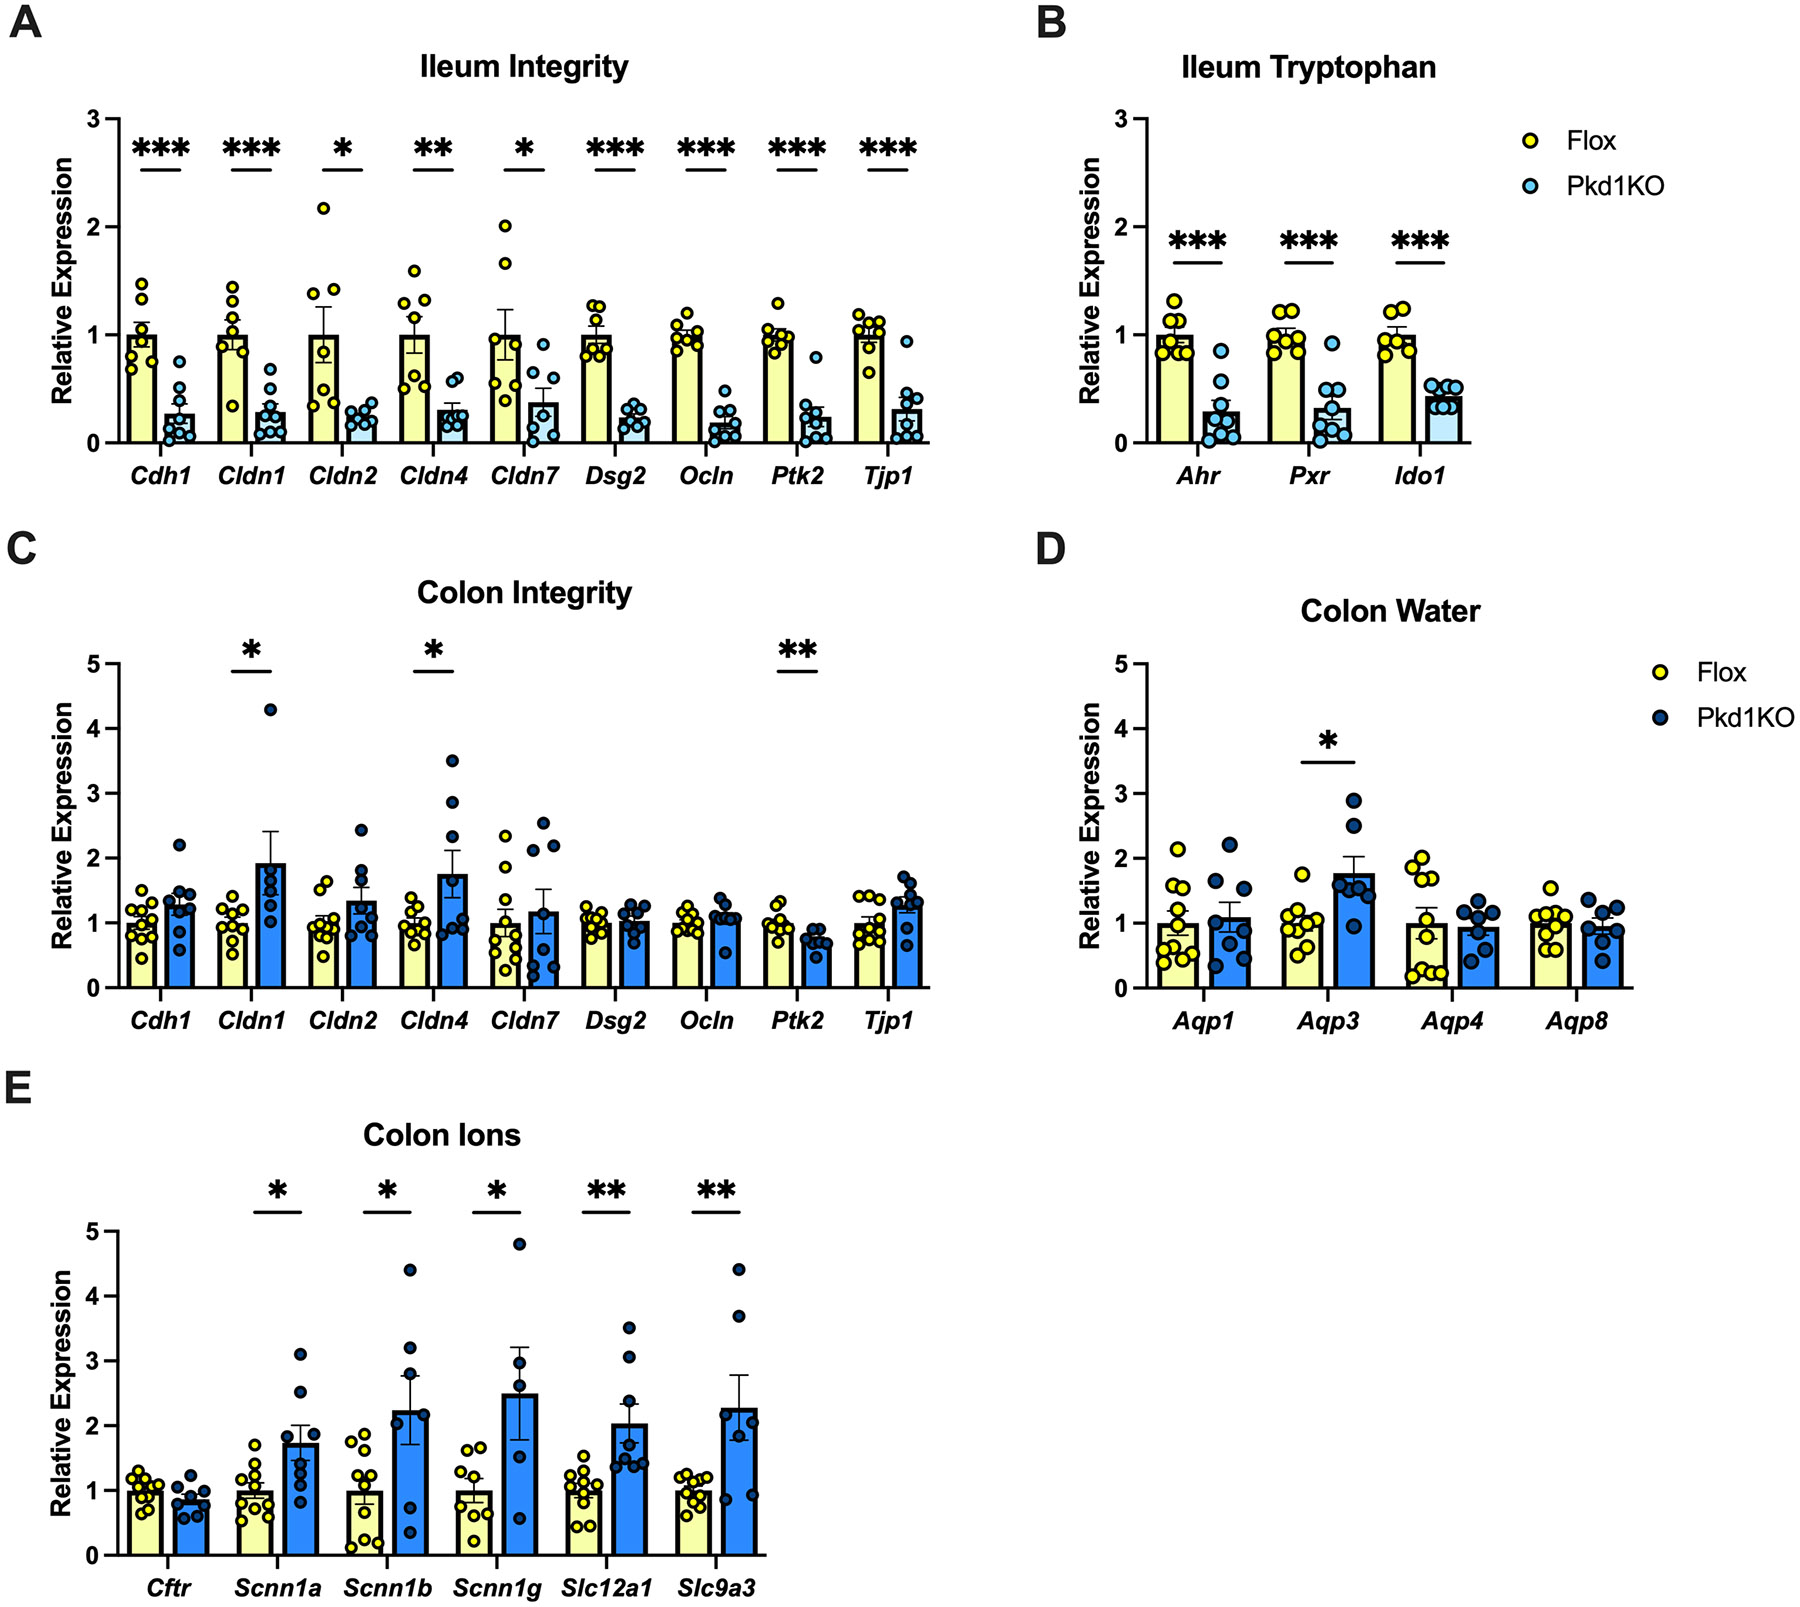
Most patients with autosomal dominant polycystic kidney disease (ADPKD) develop kidney cysts due to germline PKD1 mutations. In the kidney, Pkd1 loss impairs epithelial cell integrity and increases macrophage infiltration, contributing to cyst growth. Despite its role as the body's largest inflammatory cell reservoir, it has yet to be elucidated whether a similar phenotype presents in the intestines. We hypothesize that loss of Pkd1 leads to a leaky intestinal epithelial barrier and increased inflammation, before rapid cystogenesis. Control and inducible, global Pkd1 knockout (Pkd1KO) mice were euthanized at 3 and 6 mo of age (early and late stage) to evaluate kidney disease progression, small and large intestinal integrity, and inflammation. Early-stage Pkd1KO mice displayed mild cystic kidneys and tubular injury with preserved kidney function. Intestinal epithelial barrier was tighter in KO mice, which was associated with higher expression of cell-cell epithelial integrity markers. However, there was no evidence of local or systemic inflammation in either genotype. Late-stage Pkd1KO mice had severely cystic, impaired kidneys with increased expression of integrity markers, tubular injury, and inflammation. Intestinal epithelial barrier was leakier in late-stage Pkd1KO mice, accompanied by gene reduction of integrity markers, increased inflammation, and elevated water and sodium channel expression. Gut motility and fecal water excretion were increased in Pkd1KO compared with flox mice irrespective of age. Overall, kidney injury appears to precede intestinal injury in ADPKD, whereby the intestinal barrier becomes leaky as cystogenesis progresses.NEW & NOTEWORTHY Though autosomal dominant polycystic kidney disease (ADPKD) is a multisystem disorder, this is the first study to explore a kidney-gut contribution to disease progression. We identified a tightened intestinal epithelial barrier in early PKD, which becomes leaky as kidneys become more cystic, accompanied by a sustained loss of fecal water. Given the only approved ADPKD therapeutic yields adverse aquaretic events, this study emphasizes the need to evaluate extrarenal water loss in patients before prescribing.

Keywords: ADPKD; colon; integrity; motility; water.


Conflict of interest statement

DISCLOSURES

The authors have no conflicts of interest to disclose.

Figures

Figure 1.
Figure 1.. Kidney phenotype is indicative of early disease progression in Pkd1KO mice.
(A) Body weight, (B) kidney weight to body weight ratio (KW/BW), (C) representative kidney histology and (D) cystic index. Pkd1KO mice had enlarged, more cystic kidneys compared to flox mice. (E) Plasma creatinine was slightly reduced in KO mice. (F-G) Kidney gene expression of injury and integrity markers, respectively. Tubular injury genes Kim1 and Lcn2 were increased while tight junction gene Tjp1 was decreased in Pkd1KO versus flox mice. (H) Kidney gene expression of inflammatory markers. No differences were observed in proinflammatory genes amongst genotypes. Results of an unpaired t test or an unpaired t test with Welch's correction (n= 4-14/group). P *< 0.05, ***< 0.001. Kim1, Kidney injury marker 1; Lcn2, Lipocalin-2; Cdh1, Epithelial cadherin; Cldn1, Claudin-1; Cldn2, Claudin-2; Cldn4, Claudin-4; Cldn7, Claudin-7; Dsg2, Desmoglein 2; Ocln, Occludin; Ptk2, Protein tyrosine kinase 2; Tjp1, Tight junction protein 1; Ccl2, C-C motif chemokine ligand 2; Csf1, Colony stimulating factor 1; Il1b, Interleukin-1 beta; Il6, Interleukin 6; Tnfa, Tumor necrosis factor alpha; Tgfb1, Transforming growth factor-beta. Males are circles and females are diamonds.
Figure 2.
Figure 2.. Pkd1KO mice do not display intestinal injury or systemic inflammation at 3 months old.
(A) Small intestine weight to body weight ratio (SIW/BW), (B) length, and (C) representative ileum histology. No structural or villus height to crypt depth (VH-CD) ratio (Flox 4.75 ± 0.30 vs. KO 4.50 ± 0.42, P = 0.68, n=3-4/group) differences were observed in the ileum between genotypes. (D) Ileum gene expression of inflammatory markers. No differences were observed in proinflammatory genes amongst genotypes. (E) Colon weight to body weight ratio (CW/BW) (F) length, and (G) representative colon histology. No structural differences were observed in the colon between genotypes. (H) Colon gene expression of inflammatory markers. No differences were observed in proinflammatory genes amongst genotypes. (I) Ileum and (J) colon gene expression of Kim1 and Lcn2. There were no differences in injury marker expression in either intestinal segment. (K) Plasma MCP-1 and (L) LCN2 abundance did not change with loss of Pkd1. Results of an unpaired t test reported for all. (n= 5-14/group). P *< 0.05. MCP-1, monocyte chemoattractant protein 1; LCN2, Lipocalin-2. Males are circles and females are diamonds.
Figure 3.
Figure 3.. Reduced intestinal permeability and water reabsorption with increased motility in early ADPKD.
(A) Small intestine and colon epithelial paracellular permeability. Pkd1KO mice exhibit a tighter epithelial barrier compared to flox mice. (B) Whole gut transit time is reduced in Pkd1KO versus flox mice, signifying enhanced motility. (C) Water content was elevated in the feces of Pkd1KO compared to flox mice. (D) Ileum gene expression of integrity and (E) tryptophan metabolism markers. Pkd1KO mice expressed more ileal Cldn1, Ahr, and Pxr. (F-G) Fecal and plasma concentration of tryptophan is decreased in KO compared to flox mice. (H) Colon gene expression of integrity markers, (I) water channels, and (J) ion channels. Increased expression of tight junction genes Ocln and Tjp1, as well as water channels Aqp4 and Aqp8 were observed in Pkd1KO versus flox mice with no differences in sodium or chloride channels. Results of an unpaired t test or an unpaired t test with Welch's correction (n= 5-12/group). P *< 0.05, **< 0.01, ***< 0.001. Aqp1, Aquaporin 1; Aqp3, Aquaporin 3; Aqp4, Aquaporin 4; Aqp8, Aquaporin 8; Cftr, Cystic Fibrosis Transmembrane Conductance Regulator; Scnn1a, Sodium Channel Epithelial 1 Subunit Alpha; Scnn1b, Sodium Channel Epithelial 1 Subunit Beta; Scnn1g, Sodium Channel Epithelial 1 Subunit Gamma; Slc12a1, Solute; Slc9a3, Solute Carrier Family 12 Member 1. Males are circles and females are diamonds.
Figure 4.
Figure 4.. Advanced kidney injury with a tighter epithelial barrier in Pkd1KO mice at 6 months.
(A) Body weight, (B) kidney weight to body weight ratio (KW/BW), (C) representative kidney histology and (D) cystic index. Pkd1KO mice had substantially enlarged, severely cystic kidneys compared to flox mice, indicative of late stage ADPKD. (E) Comparative Pkd1 gene expression amongst tissues in flox mice, normalized to kidney tissue. Expression of Pkd1 is highest in the colon compared to other tissues. (F) Kidney gene expression of integrity markers, (G) water channels, and (H) ion channels. Nearly all junctional markers are increased in Pkd1KO compared to flox mice. Water channels Aqp3 and Aqp4, and sodium exchanger Slc9a3 were downregulated, while chloride channel Cftr and sodium channel subunits Scnn1a/b were upregulated in KO’s. (I) Blood sodium, potassium, (J) blood urea nitrogen, (K) and plasma creatinine were increased in Pkd1KO versus flox mice. (L) Kidney gene expression of tryptophan metabolism markers and (M) plasma tryptophan. KO mice expressed more renal Ahr and Pxr with less circulating tryptophan. Results of an unpaired t test or a two-way ANOVA with Tukey’s multiple comparisons test (n= 4-13/group). P *< 0.05, **< 0.01, ***< 0.001. P < 0.05 compared to other organs. Na, Sodium; K, Potassium; Cl, Chloride. Males are circles and females are diamonds.
Figure 5.
Figure 5.. A leaky intestinal barrier is observed in late ADPKD.
(A) Colon epithelial paracellular permeability. Pkd1KO mice exhibit a more permeable epithelial barrier compared to flox mice. (B) Whole gut transit time is reduced in Pkd1KO versus flox mice, signifying enhanced motility. (C) Pkd1KO mice had higher fecal water content. (D) SIW/BW, (E) small intestine length, and (F) representative ileum histology was not different amongst genotypes. VH-CD ratio (Flox 2.60 ± 0.18 vs. KO 2.49 ± 0.14, P = 0.66, n=3/group) was unchanged with Pkd1 loss, but decreased with age (Flox: 3 Mo 4.75 ± 0.30 vs. 6 Mo 2.60 ± 0.18, P = 0.004; KO: 3 Mo 4.50 ± 0.42 vs. 6 Mo 2.49 ± 0.14, P = 0.01). (G) CW/BW, (H) colon length, and (I) representative colon histology did not change. Results of an unpaired t test reported for all (n= 3-10/group). P *< 0.05.
Figure 6.
Figure 6.. Decreased intestinal integrity is associated with barrier loss.
(A) Ileum gene expression of integrity and (B) tryptophan metabolism markers were downregulated in KO mice. (C) Colon gene expression of integrity markers, (D) water channels, and (E) ion channels. Increased expression of tight junction genes Cldn1 and Cldn4 with decreased expression of Tjp1 was observed in Pkd1KO versus flox mice. This was accompanied by elevated expression of water channel Aqp3 and all sodium channels. Results of an unpaired t test reported for all (n= 5-10/group). P *< 0.05, **< 0.01, ***< 0.001.
Figure 7.
Figure 7.. Aged Pkd1KO mice display increased kidney and intestinal injury with systemic inflammation.
(A-B) Kidney gene expression of injury and inflammatory markers. KO mice had substantially elevated expression of all injury and inflammatory genes compared to flox mice. (C) Plasma LCN2 abundance increased significantly with loss of Pkd1. (D-E) Ileum gene expression of injury and inflammatory markers. Kim1, Csf1, and Il6 were elevated, while Lcn2, Ccl2, Il1b, Muc2, and Tgfb1 were decreased in Pkd1KO compared to flox mice. (F-G) Colon gene expression of injury and inflammatory markers. Kim1, Csf1, Tnfa, and Tgfb1 were modestly increased in Pkd1KO mice. Results of an unpaired t test reported for all. (n= 7-12/group). P *< 0.05, **< 0.01, ***< 0.001. Muc2, Mucin 2.
Figure 8.
Figure 8.. In early ADPKD, the intestinal barrier is tight but becomes leakier as kidneys become more cystic.
In early ADPKD progression, kidneys are mildly injured, as evidenced by decreased expression of tight junction protein 1 (ZO-1). Cysts have begun to form, however there is no evidence of inflammation. The intestines display increased epithelial barrier tightness, supported by decreased permeability and increased expression of occludin (OCLN), tight junction protein 1 (ZO-1), a tightening claudin (CLDN), and aryl hydrocarbon receptor (AHR). Increased aquaporin 4 and 8 (AQP4 and 8) expression is likely to compensate for loss of paracellular water transport. In late-stage ADPKD, kidneys become severely injured, cystic, and inflamed. Despite this damage, the epithelial barrier becomes tighter, corroborated by increased expression of OCLN, ZO-1, pore forming CLDNs, epithelial cadherin (E-CAD), desmoglein-2 (DSG2), focal adhesion kinase (FAK), pregnane X receptor (PXR), and AHR. Conversely, the intestinal barrier becomes leaky with disease progression. This is demonstrated by an increase in paracellular permeability, via OCLN, ZO-1, CLDNs, E-CAD, DSG2, FAK, PXR, and AHR, as well as likely increases in transcellular transport, via aquaporin 3 (AQP3), epithelial sodium channel subunits (ENaC), sodium potassium 2 chloride channel (NKCC2), and sodium hydrogen exchanger 3 (NHE3). The intestines were mildly injured and inflamed. Upregulated genes in green, downregulated genes in magenta. Created in Biorender.

Similar articles

References

    1. The polycystic kidney disease 1 gene encodes a 14 kb transcript and lies within a duplicated region on chromosome 16. The European Polycystic Kidney Disease Consortium. Cell 78: 725, 1994. - PubMed
    1. Boletta A, Qian F, Onuchic LF, Bragonzi A, Cortese M, Deen PM, Courtoy PJ, Soria MR, Devuyst O, Monaco L, and Germino GG. Biochemical characterization of bona fide polycystin-1 in vitro and in vivo. Am J Kidney Dis 38: 1421–1429, 2001. - PubMed
    1. Silberberg M, Charron AJ, Bacallao R, and Wandinger-Ness A. Mispolarization of desmosomal proteins and altered intercellular adhesion in autosomal dominant polycystic kidney disease. American Journal of Physiology-Renal Physiology 288: F1153–F1163, 2005. - PMC - PubMed
    1. Russo RJ, Husson H, Joly D, Bukanov NO, Patey N, Knebelmann B, and Ibraghimov-Beskrovnaya O. Impaired formation of desmosomal junctions in ADPKD epithelia. Histochemistry and Cell Biology 124: 487–497, 2005. - PubMed
    1. Natoli TA, Gareski TC, Dackowski WR, Smith L, Bukanov NO, Russo RJ, Husson H, Matthews D, Piepenhagen P, and Ibraghimov-Beskrovnaya O. Pkd1 and Nek8 mutations affect cell-cell adhesion and cilia in cysts formed in kidney organ cultures. American Journal of Physiology-Renal Physiology 294: F73–F83, 2008. - PubMed

MeSH terms

Substances

LinkOut - more resources