. 2025 May;21(5):1059-1074.
doi: 10.1080/15548627.2024.2443300. Epub 2025 Jan 20.

Blocking autophagosome closure manifests the roles of mammalian Atg8-family proteins in phagophore formation and expansion during nutrient starvation

Affiliations

Blocking autophagosome closure manifests the roles of mammalian Atg8-family proteins in phagophore formation and expansion during nutrient starvation

Van Bui et al. Autophagy. 2025 May.

Abstract

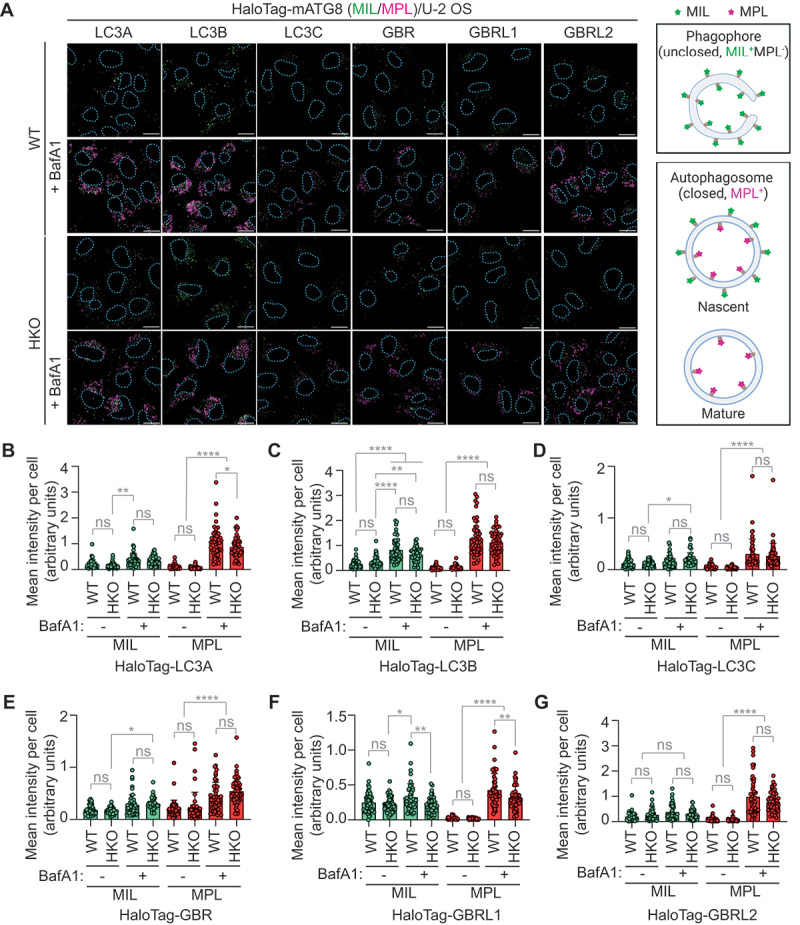
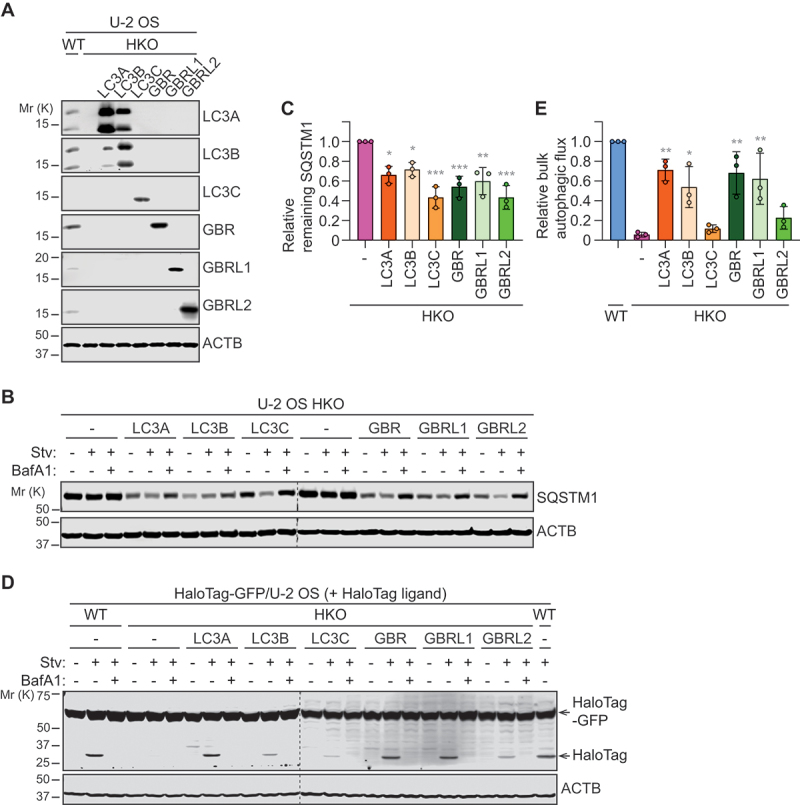
Macroautophagy/autophagy, an evolutionarily conserved cellular degradation pathway, involves phagophores that sequester cytoplasmic constituents and mature into autophagosomes for subsequent lysosomal delivery. The ATG8 gene family, comprising the MAP1LC3/LC3 and GABARAP/GBR subfamilies in mammals, encodes ubiquitin-like proteins that are conjugated to phagophore membranes during autophagosome biogenesis. A central question in the field is how Atg8-family proteins are precisely involved in autophagosome formation, which remains controversial and challenging, at least in part due to the short lifespan of phagophores. In this study, we depleted the autophagosome closure regulator VPS37A to arrest autophagy at the vesicle completion step and determined the roles of mammalian Atg8-family proteins (mATG8s) in nutrient starvation-induced autophagosome biogenesis. Our investigation revealed that LC3 loss hinders phagophore formation, while GBR loss impedes both phagophore formation and expansion. The defect in membrane expansion by GBR loss appears to be attributed to compromised recruitment of ATG proteins containing an LC3-interacting region (LIR), including ULK1 and ATG3. Moreover, a combined deficiency of both LC3 and GBR subfamilies nearly completely inhibits phagophore formation, highlighting their redundant regulation of this process. Consequently, cells lacking all mATG8 members exhibit defects in downstream events such as ESCRT recruitment and autophagic flux. Collectively, these findings underscore the critical roles of mammalian Atg8-family proteins in phagophore formation and expansion during autophagy.Abbreviation: AIM: Atg8-family interacting motif; ADS: Atg8-interacting motif docking site; ATG: autophagy related; BafA1: bafilomycin A1; CL: control; ESCRT: endosomal sorting complex required for transport; FACS: fluorescence activated cell sorting; GBR: GABARAP; GBRL1: GABARAPL1; GBRL2: GABARAPL2; GBRL3: GABARAPL3; HKO: hexa-knockout; IP: immunoprecipitation; KO: knockout; LDS: LC3-interacting-region docking site; LIR: LC3-interacting region; mATG8: mammalian Atg8-family protein; MIL: membrane-impermeable ligands; MPL: membrane-permeable ligands; RT: room temperature; Stv: starved; TKO: triple-knockout; TMR: tetramethylrhodamine; UEVL: ubiquitin E2 variant-like; WCLs: whole cell lysates; WT: wild-type.

Keywords: Autophagosome closure; ESCRT; LIR; The mammalian Atg8 family of proteins; membrane expansion; phagophore formation.


Conflict of interest statement

No potential conflict of interest was reported by the author(s).

Figures

Figure 1.
Figure 1.
mATG8 proteins are crucial for both bulk and selective autophagy during nutrient starvation. (A) Western blot analysis validating the absence of targeted Atg8-family proteins in LC3 triple-knockout (TKO), GABARAP (GBR) TKO, and mATG8 hexa-knockout (HKO) U-2 OS cells. To maximize the amount of mATG8 proteins, cells were starved in the presence of 100 nM bafilomycin A1 (BafA1) for 3 h. (B) schematic diagram of the HaloTag-GFP reporter-based bulk autophagy flux assay (created in BioRender. Bui, V. (2024) BioRender.com/t38p691). (C-G) Western blot analysis of the indicated U-2 OS (C-E) and HeLa (F and G) cells that were stably transduced with the HaloTag-GFP reporter, pulse-labeled for 20 min with tetramethylrhodamine (TMR)-conjugated membrane-permeable HaloTag ligand (MPL), and starved in the presence or absence of 100 nM BafA1 for 6 h. (D and G) quantification of HaloTag/(HaloTag-GFP + HaloTag) ratio relative to WT cells under starvation conditions in C and F (n = 3). (D) quantification of SQSTM1 levels relative to WT cells under starvation and BafA1 for 6 h (n = 3). All values in D, E and G are presented as mean ± SD. One-way ANOVA test was performed followed by Tukey’s multiple comparison test. The p-values in D: ****p < 0.0001, **p = 0.003, *p = 0.0363; in E: ****p < 0.0001; and in F: ****p < 0.0001, ***p = 0.0003, **p = 0.0072, *p = 0.016.
Figure 2.
Figure 2.
mATG8 loss impairs ESCRT recruitment to SQSTM1/p62 bodies. (A) confocal images of GFP-VPS37A-expressing WT, LC3 TKO, GBR TKO, and HKO U-2 OS cells that were transfected with siNT or siCHMP2A for 40 h, starved for 3 h, and stained for CHMP4B and SQSTM1. Scale bars: 10 μm; 1 μm in magnified images. (B and C) quantification of total area per cell positive for SQSTM1 and VPS37A (B) and CHMP4B (C) in A (n = 50 cells). (D) Western blot analysis of VPS37A KO U-2 OS cells that were stably transduced with either GFP-VPS37A, GFP-VPS37A Δ1–20 or control GFP-empty vector (EV), and starved in the presence or absence of 100 nM BafA1 for 3 h. (E-H) quantification of (“Stv+BafA1”-’Stv’)/“Stv+BafA1” ratio relative to GFP-VPS37A-expressing VPS37A KO U-2OS cells in D (n = 3) for starvation-induced fluxes of SQSTM1 in E and lipidated forms of LC3A-II (F), LC3B-II (G), and GBRL2-II (H). All values in B, C, E, F, G, H are presented as mean ± SD. One-way ANOVA test was performed followed by Tukey’s multiple comparison test. The p-values in B: ****p < 0.0001, ***p = 0.0002, *p = 0.0447 and 0.0164 (from left to right); in C: ****p < 0.0001, *p = 0.0474 and 0.011 (from left to right); in E: ****p < 0.0001; in F: ****p < 0.0001; in G: ****p < 0.0001; and in H: ****p < 0.0001.
Figure 3.
Figure 3.
mATG8 proteins are crucial for phagophore formation and expansion. (A) electron microscopy (EM) images of WT, VPS37A KO (mATG8 WT+VPS37A KO), VPS37A-deficient LC3 TKO (LC3 TKO+VPS37A KO), VPS37A-deficient GBR TKO (GBR TKO+VPS37A KO), and VPS37A-deficient mATG8 HKO (HKO+VPS37A KO) U-2 OS cells that were starved for 3 h. Asterisks indicate immature autophagic structures including phagophores. Scale bars: 1 μm. (B and C) quantification of the number of autophagic structures per cytoplasmic area (B; n = 15 cells) and the size of autophagic structures (C; n = 28 structures for HKO, 50 structures for the remaining groups) in A. (D) confocal images of the indicated GFP-ULK1-expressing U-2 OS cells that were starved for 3 h. Scale bars: 10 μm. (E and F) quantification of the number (E) and mean size (F) of GFP-ULK1 puncta per cell in D (n = 50 cells). All values in B, C, E and F are presented as mean ± SD. One-way ANOVA test was performed followed by Tukey’s multiple comparison test. The p-values in B: ****p < 0.0001, **p = 0.0047; in C: ****p < 0.0001; in E: ****p < 0.0001; and in F: ****p < 0.0001; ns, not significant.
Figure 4.
Figure 4.
Overexpression of an Atg8-family member can compensate for the loss of other family members and restore autophagy in HKO cells. (A) confocal images of WT and HKO U2-OS cells that were stably transduced with HaloTag-LC3A, LC3B, LC3C, GBR, GBRL1, and GBRL2, starved in the presence or absence of 100 nM BafA1 for 3 h, and subjected to the HaloTag-mATG8 autophagosome completion assay with Alexa Fluor 488-conjugated MIL (green) and tetramethylrhodamine-conjugated MPL (magenta). Scale bars: 10 μm. Expected unclosed (phagophores, MIL+ MPL) and closed (nascent autophagosomes, MIL+ MPL+; mature autophagosomes, MIL MPL+) structures distinguishably labeled by the assay are illustrated on the right (created in BioRender. Bui, V. (2024) BioRender.com/q66q604). (B-G) quantification of cytoplasmic fluorescence intensities of MIL and MPL in each cell in figure 4A (n = 50 cells). The mean fluorescence intensity, normalized to the cytoplasmic area, is shown. All values in B-G are presented as mean ± SD. One-way ANOVA test was performed followed by Tukey’s multiple comparison test. The p-values in B: ****p < 0.0001, **p = 0.0094, *p = 0.045; in C: ****p < 0.0001, **p = 0.0026; in D: ****p < 0.0001, *p = 0.0401; in E: ****p < 0.0001, *p = 0.0171; in F: ****p < 0.0001, **p = 0.0019 and 0.0038 (from left to right), *p = 0.0146; and in G: ****p < 0.0001; ns, not significant.
Figure 5.
Figure 5.
Overexpression of an Atg8-family member can restore autophagy in HKO cells. (A) Western blot analysis of wild-type and mATG8 HKO U-2 OS cells stably transduced with individual mATG8 family members). Note that LC3A and LC3B antibodies may exhibit cross-reactivity. (B) Western blot analysis of HKO U-2 OS cells that were transduced with individual non-tagged mATG8 members and starved in the presence or absence of 100 nM BafA1 for 3 h. (C) quantification of “Stv”/’Stv+BafA1’ ratio for remaining SQSTM1 after starvation relative to HKO cells in B (n = 3). (D) Western blot analysis of the indicated U-2 OS cells that were transduced with HaloTag-GFP, pulse-labeled with TMR for 20 min, and starved in the presence or absence of 100 nM BafA1 for 6 h. (E) quantification of HaloTag/(HaloTag-GFP + HaloTag) ratio relative to WT cells under starvation conditions in D (n = 3). All values in C and E are presented as mean ± SD. One-way ANOVA test was performed followed by Tukey’s multiple comparison test. The p-values in C: ***p = 0.0001, 0.0009, 0.0001 (from left to right), **p = 0.0032, *p = 0.0129, 0.0442 (from left to right); and in E: **p = 0.0015, 0.0024, 0.0059 (from left to right), *p = 0.0222.
Figure 6.
Figure 6.
The LIR motif-docking sites (LDSs) of mATG8 proteins are important for autophagosome biogenesis. (A) confocal images of WT, VPS37A KO, and mATG8 HKO U-2 OS cells that were stably transduced with HaloTag-LC3B (K51A; MutLC3B) and HaloTag-GBRL2 (Y49A, L50A; MutGBRL2), starved in the presence or absence of 100 nM BafA1 for 3 h, and subjected to the HaloTag-mATG8 autophagosome completion assay with Alexa Fluor 488-conjugated MIL (green) and tetramethylrhodamine-conjugated MPL (magenta). Scale bars: 10 μm. (B) quantification of cytoplasmic fluorescence intensities of MIL and MPL in each cell in A (n = 50 cells). The mean fluorescence intensity, normalized to the cytoplasmic area, is shown. (C-F) Western blot analysis of HaloTag-GFP-expressing WT and HKO U-2 OS cells that were stably transduced with non-tagged wild-type and mutant forms of LC3B (C) and GBRL2 (E), pulse-labeled for 20 min with TMR, and starved in the presence or absence of 100 nM BafA1 for 6 h. Quantification of HaloTag/(HaloTag-GFP + HaloTag) ratio relative to WT cells under starvation conditions in C and E are shown in D and F, respectively. All values in B, D and F are presented as mean ± SD. One-way ANOVA test was performed followed by Tukey’s multiple comparison test. The p-values in B: ****p < 0.0001, **p = 0.0015, *p = 0.0172; in D: ****p < 0.0001, ***p = 0.0002, **p = 0.0012; and in F: ****p < 0.0001, ***p = 0.0001, *p = 0.0129 and 0.0482 (from top to bottom); ns, not significant.

References

    1. Yamamoto H, Zhang S, Mizushima N.. Autophagy genes in biology and disease. Nat Rev Genet. 2023;24(6):382–400. doi: 10.1038/s41576-022-00562-w - DOI - PMC - PubMed
    1. Klionsky DJ, Petroni G, Amaravadi RK, et al. Autophagy in major human diseases. Embo J. 2021;40(19):e108863. doi: 10.15252/embj.2021108863 - DOI - PMC - PubMed
    1. Nakatogawa H. Mechanisms governing autophagosome biogenesis. Nat Rev Mol Cell Biol. 2020;21(8):439–458. doi: 10.1038/s41580-020-0241-0 - DOI - PubMed
    1. Melia TJ, Lystad AH, Simonsen A. Autophagosome biogenesis: from membrane growth to closure. J Cell Biol. 2020;219(6):e202002085. doi: 10.1083/jcb.202002085 - DOI - PMC - PubMed
    1. Lamark T, Johansen T. Mechanisms of selective autophagy. Annu Rev Cell Dev Biol. 2021;37(1):143–169. doi: 10.1146/annurev-cellbio-120219-035530 - DOI - PubMed

Publication types

Substances

LinkOut - more resources