. 2024 Dec 18;12(12):e009543.
doi: 10.1136/jitc-2024-009543.

Personalized neoantigen hydrogel vaccine combined with PD-1 and CTLA-4 double blockade elicits antitumor response in liver metastases by activating intratumoral CD8+CD69+ T cells

Affiliations

Personalized neoantigen hydrogel vaccine combined with PD-1 and CTLA-4 double blockade elicits antitumor response in liver metastases by activating intratumoral CD8+CD69+ T cells

Shichuan Tang et al. J Immunother Cancer. .

Abstract

Background: Liver metastasis is highly aggressive and immune tolerant, and lacks effective treatment strategies. This study aimed to develop a neoantigen hydrogel vaccine (NPT-gels) with high clinical feasibility and further investigate its efficacy and antitumor molecular mechanisms in combination with immune checkpoint inhibitors (ICIs) for the treatment of liver metastases.

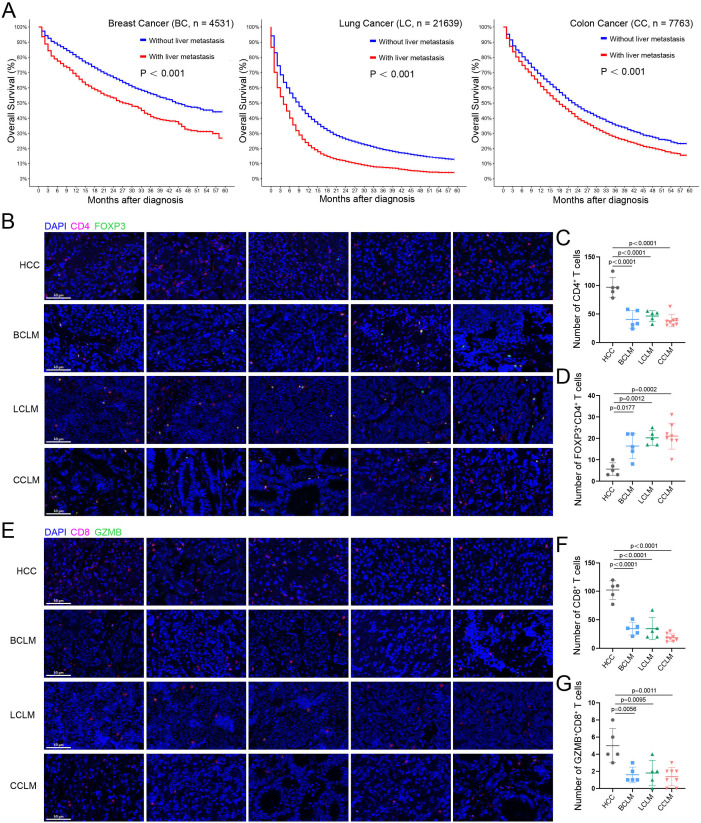
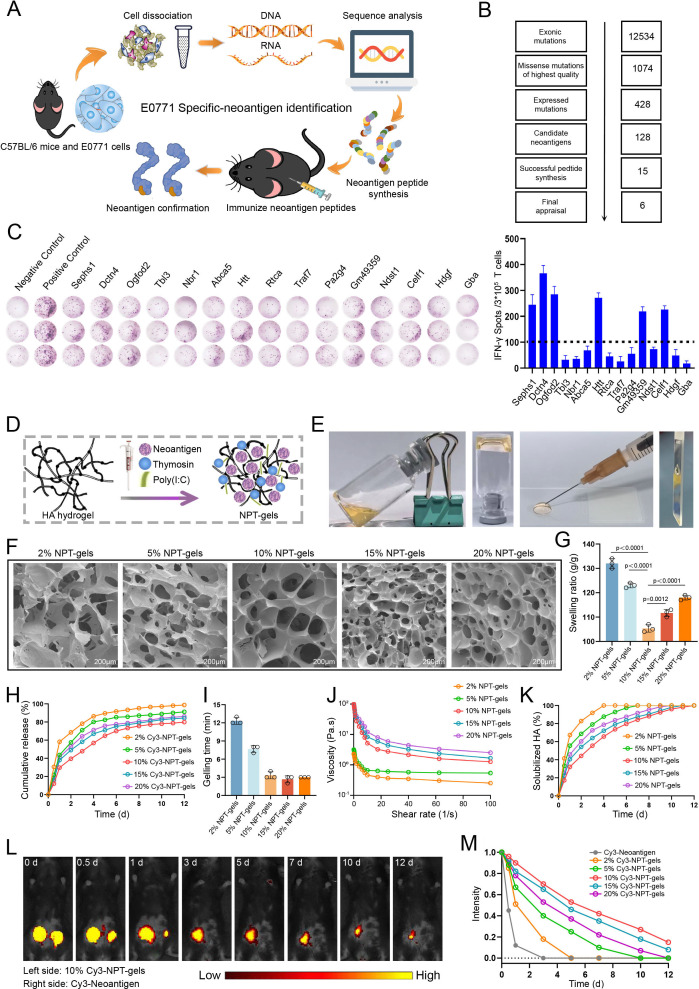
Methods: The effects of liver metastasis on survival and intratumor T-cell subpopulation infiltration in patients with advanced tumors were investigated using the Surveillance, Epidemiology, and End Results Program (SEER) database and immunofluorescence staining, respectively. NPT-gels were prepared using hyaluronic acid, screened neoantigen peptides, and dual clinical adjuvants [Poly(I:C) and thymosin α-1]. Then, the efficacy and corresponding antitumor molecular mechanisms of NPT-gels combined with programmed death receptor 1 and cytotoxic T-lymphocyte-associated protein 4 double blockade (PCDB) for the treatment of liver metastases were investigated using various preclinical liver metastasis models.

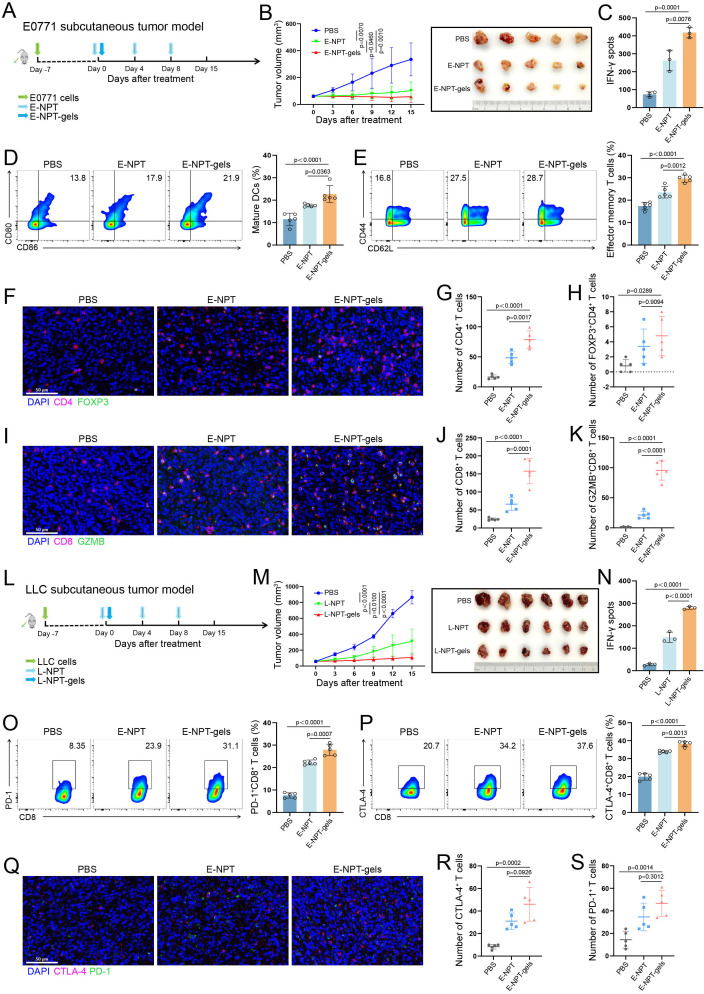
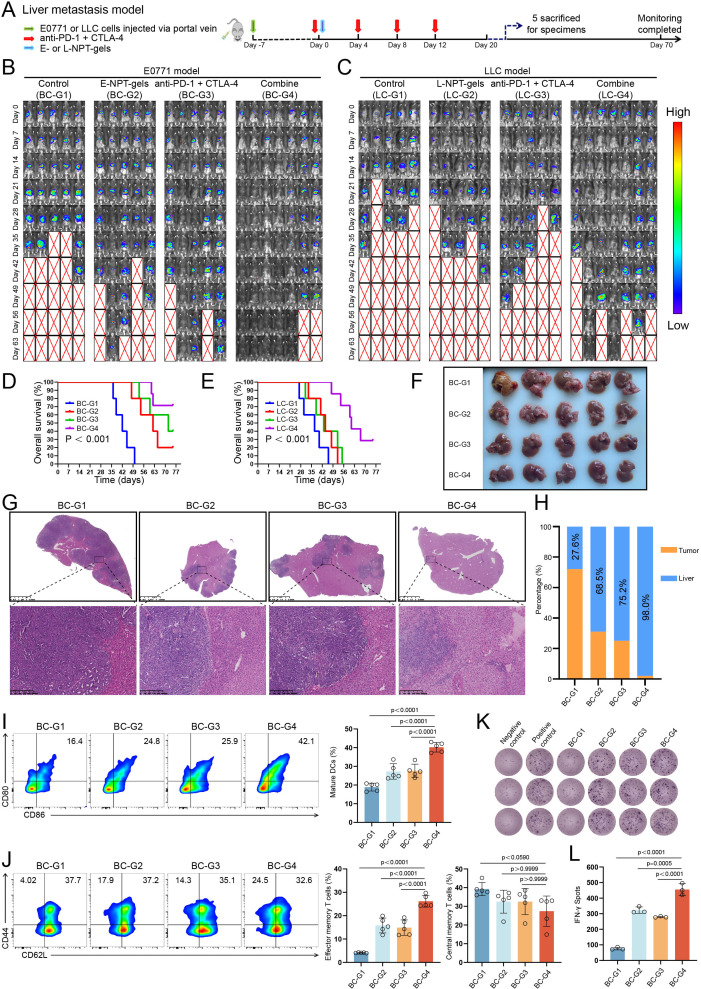
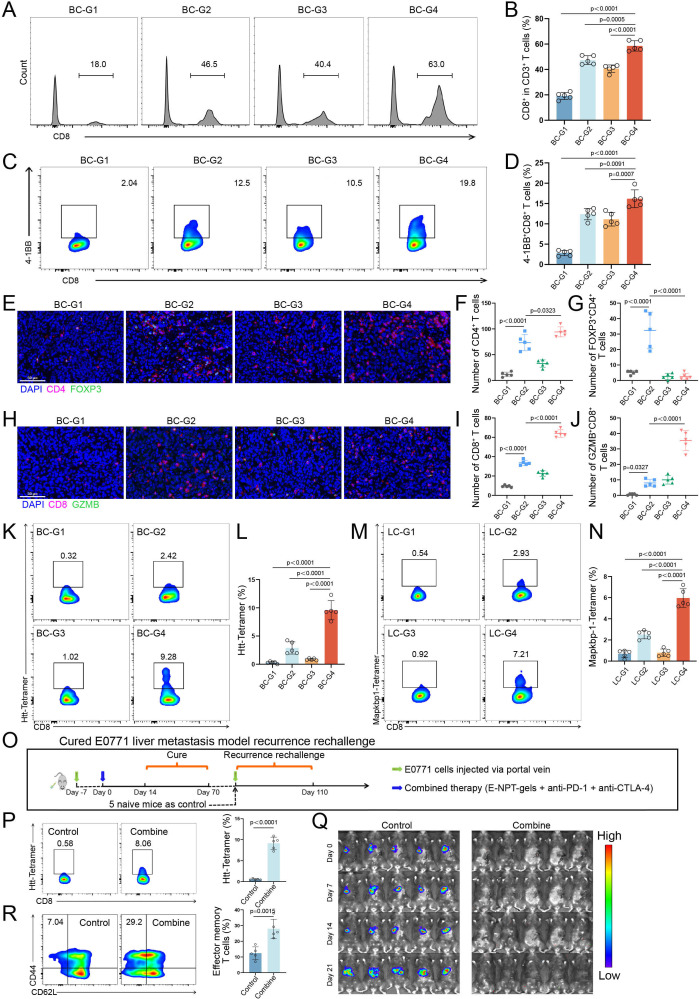
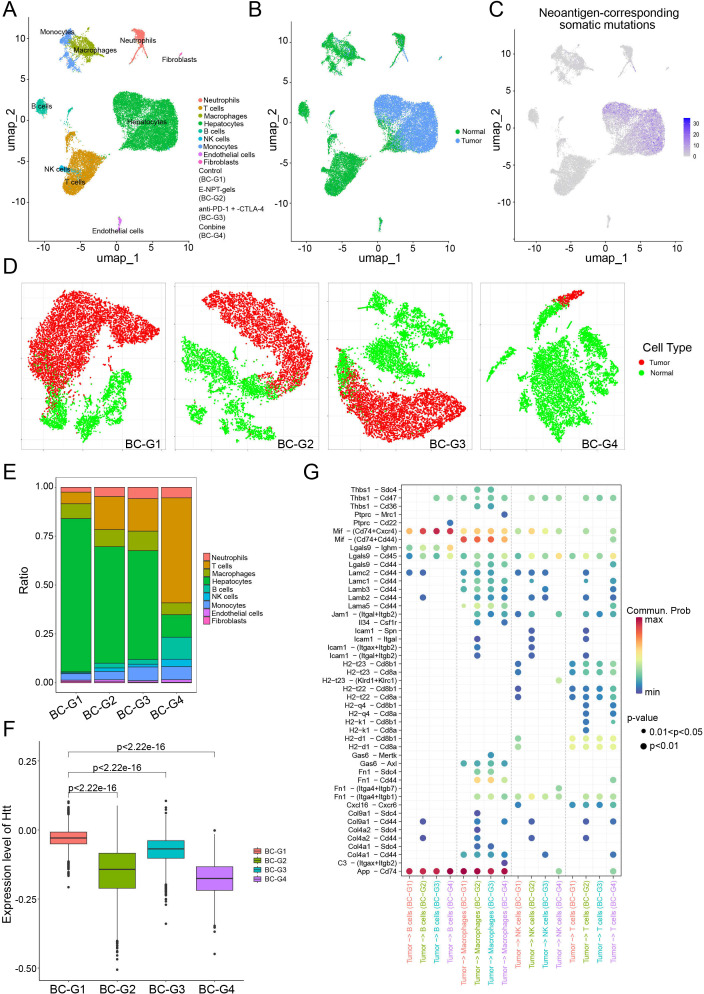
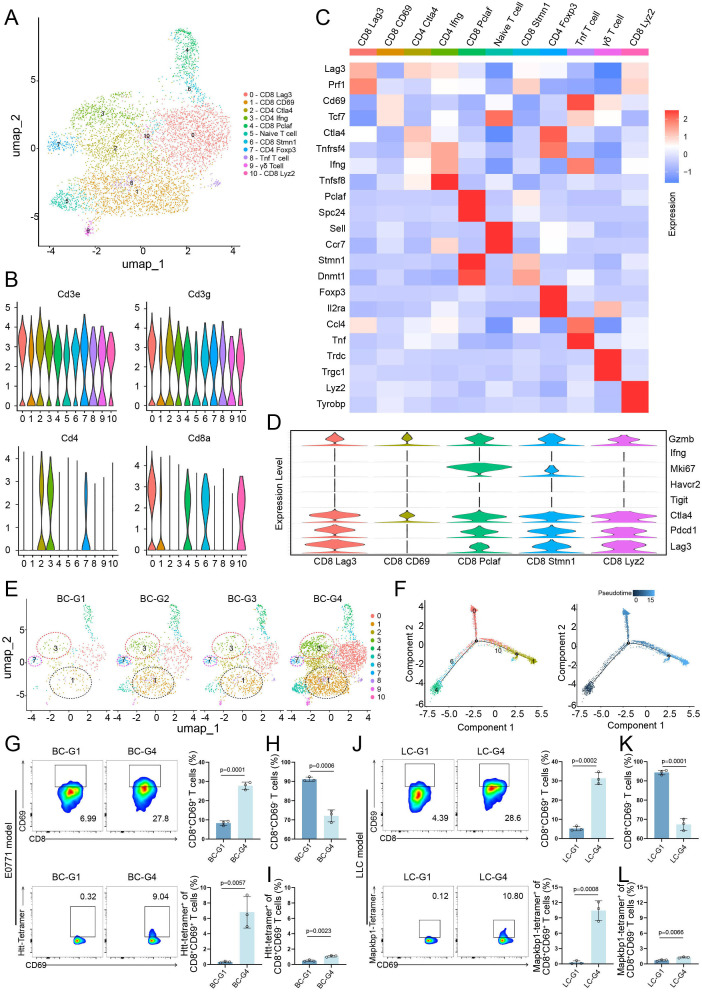
Results: Liver metastases are associated with poorer 5-year overall survival, characterized by low infiltration of cytotoxic CD8+ T cells and high infiltration of regulatory T cells (Tregs). NPT-gels overcame the challenges faced by conventional neoantigen peptide vaccines by sustaining a durable, high-intensity immune response with a single injection and significantly improving the infiltration of neoantigen-specific T-cell subpopulations in different mice subcutaneous tumor models. Importantly, NPT-gels further combined with PCDB could enhance neoantigen-specific T-cell infiltration and effectively unlock the immunosuppressive microenvironment of liver metastases, showing superior antitumor efficacy and inducing long-term immune memory in various preclinical liver metastasis models without obvious toxicity. Mechanistically, the combined strategy can inhibit Tregs, induce the production and infiltration of neoantigen-specific CD8+CD69+ T cells to enhance the immune response, and potentially elicit antigen-presenting effects in Naïve B_Ighd+ cells and M1-type macrophages.

Conclusions: This study demonstrated that NPT-gels combined with PCDB could exert a durable and powerful antitumor immunity by enhancing the recruitment and activation of CD8+CD69+ T cells, which supports the rationale and clinical translation of this combination strategy and provides important evidence for further improving the immunotherapy efficacy of liver metastases in the future.

Keywords: T cell; T regulatory cell - Treg; immune checkpoint inhibitor; immunotherapy; vaccine.


Conflict of interest statement

Competing interests: No, there are no competing interests.

Figures

Figure 1
Figure 1. The effect of tumor metastasis to the liver on survival and T-cell subset infiltration. (A) Comparison of OS in advanced breast, lung, and colon cancers with or without liver metastases from the SEER database. (B, C, and D) Immunofluorescence staining of CD4+ T cells and FOXP3+CD4+ T cells infiltration in human HCC, BCLM, LCLM, and CCLM tumor tissues (HCC, BCLM, LCLM, n=5; LCLM, n=8). (E, F and G) Immunofluorescence staining of CD8+ T cells and GZMB+CD8+ T cells infiltration in human HCC, BCLM, LCLM, and CCLM tumor tissues (HCC, BCLM, LCLM, n=5; LCLM, n=8). Scale bar: 50 μm (20×). BCLM, breast cancer liver metastasis; CCLM, colon cancer liver metastasis; GZMB, Granzyme B; HCC, hepatocellular carcinoma; LCLM, lung cancer liver metastasis; OS, overall survival.
Figure 2
Figure 2. Neoantigen identification and preparation for neoantigen hydrogel vaccines. (A) Process for identifying tumor neoantigen mutation sites in mouse E0771 cell line. (B) Workflow of tumor neoantigen mutation site screening. (C) Potential neoantigen immunogenicity validation performed by enzyme-linked immunospot (ELISPOT) assay. Six neoantigens with >100 spots were selected to develop neoantigen vaccines indicated by dotted line. (D and E) Process and appearance of neoantigen hydrogel vaccine preparation. (F and G) Three-dimensional structure and swelling rate of neoantigen hydrogel vaccines with different initial concentrations of hyaluronic acid (HA). (H) In vitro release curves of Cy-3 neoantigen hydrogel vaccines with different initial concentrations of HA. (I) The gelling time of neoantigen hydrogel vaccines with different initial concentrations of HA. (J) Viscosity of neoantigen hydrogel vaccines with different initial HA concentrations as a function of shear rate. (K) Degradation curves of neoantigen hydrogel vaccines with different initial HA concentrations in the presence of bovine testicular hyaluronidase. (L and M) In vivo release of neoantigen peptides from Cy3-labeled conventional neoantigen peptide vaccine (right) and neoantigen hydrogel vaccine (left) in mice and fluorescence change curves of neoantigen peptide vaccines with different initial HA concentrations.
Figure 3
Figure 3. Efficacy assessment of the neoantigen hydrogel vaccine in subcutaneous tumor models. (A) Schematic diagram of the E0771 breast cancer subcutaneous tumor model construction and vaccine-related treatment. (B) Tumor volume monitoring and gross conditions of C57BL/6 mice (n=5) treated with PBS, E0771 neoantigen peptides+Poly(I:C)+thymosin α-1 (E-NPT), and E-NPT-gels, respectively (tumors were excised after 15 days of treatment). (C) ELISPOT assay for neoantigen-specific immune response induced by different treatment strategies in the E0771 model. (D) The percentage of mature DCs co-expressing CD80 and CD86 in lymph nodes detected in E0771 model (n=5) by flow cytometry and statistical analysis. (E) The percentage of effector memory T cells among splenic CD8+ T cells detected in E0771 model (n=5) by flow cytometry and statistical analysis (n=5). (F–H) The schematic and statistical analysis of immunofluorescence for CD4+ T cells and FOXP3+CD4+ T cells in tumor tissues from E0771 model (n=5). (I–K) schematic and statistical analysis of immunofluorescence for CD8+ T cells and GZMB+CD8+ T cells in tumor tissues from E0771 model (n=5). (L) Schematic diagram of the LLC lung cancer subcutaneous tumor model construction and vaccine-related treatment. (M) Tumor volume monitoring and gross conditions of C57BL/6 mice (n=6) treated with PBS, LLC neoantigen peptides+Poly(I:C)+thymosin α-1 (L-NPT), and L-NPT-gels, respectively (tumors were excised after 15 days of treatment). (N) ELISPOT assay for neoantigen-specific immune response induced by different treatment strategies in the LLC model. (O and P) Flow cytometry was performed to detect the percentage of PD-1 and CTLA-4 expression on CD8+ T cells in tumors from E0771 model (n=5) and statistical analysis. (Q–S) The schematic and statistical analysis of immunofluorescence for the expression levels of PD-1 and CTLA-4 in tumor tissues from E0771 model (n=5). Scale bar: 50 μm (20×). CTLA-4, cytotoxic T-lymphocyte-associated protein 4; DCs, dendritic cells; ELISPOT, enzyme-linked immunospot; GZMB, Granzyme B; PBS, phosphate-buffered saline; PD-1, programmed death receptor 1.
Figure 4
Figure 4. Efficacy assessment of neoantigen hydrogel vaccine combined with PD-1 and CTLA-4 double blockade (PCDB) in liver metastasis models. (A) Schematic diagram of the construction and vaccine-related treatment for E0771 or LLC liver metastasis model. (B) Monitoring tumor burden changes among different treatment groups of mice in the E0771 liver metastasis model. (C) Monitoring tumor burden changes among different treatment groups of mice in the LLC liver metastasis model. (D and E) OS curves of mice in different treatment groups of E0771 and LLC liver metastasis models. (F) Liver gross appearance of each sacrificed mouse in the E0771 liver metastasis model on day 25 after treatment initiation. (G and H) H&E staining and statistical analysis of tumor nodules in liver tissues from E0771 liver metastasis model. (I) The percentage of mature DCs co-expressing CD80 and CD86 in lymph nodes of E0771 liver metastasis model detected by flow cytometry and statistical analysis (n=5). (J) The percentage of effector memory T cells and central memory T cells in splenic CD8+ T cells of E0771 liver metastasis model detected by flow cytometry and statistical analysis (n=5). (K and L) ELISPOT assay for neoantigen-specific immune response induced by different treatment strategies in the E0771 liver metastasis model. CTLA-4, cytotoxic T-lymphocyte-associated protein 4; DC, dendritic cell; ELISPOT, enzyme-linked immunospot; OS, overall survival; PD-1, programmed death receptor 1.
Figure 5
Figure 5. Immune response assessment of neoantigen hydrogel vaccine combined with PD-1 and CTLA-4 double blockade (PCDB) in liver metastasis models. (A and B) The percentage of CD8+ T-cell infiltration in tumor tissues of E0771 liver metastasis model detected by flow cytometry and statistical analysis (n=5). (C and D) The percentage of CD8+ T-cell activation in tumor tissues of E0771 liver metastasis model detected by flow cytometry and statistical analysis (n=5). (E–G)The schematic and statistical analysis of immunofluorescence for CD4+ T cells and FOXP3+CD4+ T cells in tumor tissues of E0771 liver metastasis model (n=5). (H–J) The schematic and statistical analysis of immunofluorescence for CD8+ T cells and GZMB+CD8+ T cells in tumor tissues from E0771 liver metastasis model (n=5). (K and L) The percentage and statistical analysis of Htt-specific CD8+ T cells in tumor tissues of E0771 liver metastasis mice (n=5). (M and N) The percentage and statistical analysis of Mapkbp1-specific CD8+ T cells in tumor tissues of LLC liver metastasis mice (n=5). (O) The schematic diagram of the recurrence rechallenge experiment of five mice cured in the combined treatment group from the E0771 liver metastasis model. (P) The percentage and statistical analysis of Htt-specific CD8+ T cells in blood mononuclear cells of mice in control and combined groups in the recurrence rechallenge experiment before injection of E0771 cells (n=5). (Q) Changes of tumor burden in mice of both groups were monitored by IVIS Spectrum Animal Imaging System. (R) Percentage and statistical analysis of effector memory CD8+ T cells in splenic cells of control and combined treatment mice at the end of monitoring in recurrence rechallenge experiments (n=5). Scale bar: 50 μm (20×). CTLA-4, cytotoxic T-lymphocyte-associated protein 4; GZMB, Granzyme B; PD-1, programmed death receptor 1.
Figure 6
Figure 6. Single-cell RNA sequencing characterizes immune microenvironment changes in E0771 liver metastasis model. (A) Two-dimensional t-distributed stochastic neighbor embedding (t-SNE) plot showing nine identified cell clusters in E0771 liver metastasis tumor. (B) The t-SNE plot of tumor cells originating from hepatocytes was clarified by copy number analysis. (C) t-SNE plot showing the number of neoantigen-corresponding somatic mutations detected in all cell clusters. (D) Distribution of tumor cells in each group. (E) Histogram showing the proportion of different cell clusters in each treatment group. (F) Expression levels of the parent gene of representative neoantigen mutations (Htt) at the tumor single-cell level in different treatment groups of the E0771 liver metastasis model. (G) Ligand-receptor interactions between tumor cells and B cells, macrophages, natural killer cells, and T cells calculated using CellChat.
Figure 7
Figure 7. (A) Two-dimensional t-distributed stochastic neighbor embedding (t-SNE) plot showing 11 identified T-cell clusters in E0771 liver metastasis tumor. (B) Violin plot showing the expression of recognized T-cell function markers. (C) Heatmap showing the expression levels of subtype-specific marker genes for all T-cell subtypes. (D) Violin plots showing expression of classical immune checkpoint and activation marker genes in CD8+ T-cell subtypes. (E) t-SNE plots of the enrichment of different T-cell clusters under different treatment strategies. (F) Pseudotime trajectory of CD8+ T-cell subtypes: colored by cell subtypes (left), colored by pseudotime (right). (G) The percentage of neoantigen Htt-specific T cells with high expression of CD69 in CD8+ T cells in tumor tissues of different treatment groups in the E0771 liver metastasis model was detected by tetramer flow cytometry and statistically analyzed (n=3). (H and I) The percentage of neoantigen Htt-specific T cells with low expression of CD69 in CD8+ T cells in tumor tissues of different treatment groups in the E0771 liver metastasis model was detected by tetramer flow cytometry and statistically analyzed (n=3). (J) The percentage of neoantigen Mapkbp1-specific T cells with high expression of CD69 in CD8+ T cells in tumor tissues of different treatments in the LLC liver metastasis model was detected by tetramer flow cytometry and statistically analyzed (n=3). (K and L) The percentage of neoantigen Mapkbp1-specific T cells with low expression of CD69 in CD8+ T cells in tumor tissues of different treatment groups in the LLC liver metastasis model was detected by tetramer flow cytometry and statistically analyzed (n=3).

Similar articles

Cited by

References

    1. Chaffer CL, Weinberg RA. A perspective on cancer cell metastasis. Science. 2011;331:1559–64. doi: 10.1126/science.1203543. - DOI - PubMed
    1. Riihimäki M, Thomsen H, Hemminki A, et al. Comparison of survival of patients with metastases from known versus unknown primaries: survival in metastatic cancer. BMC Cancer. 2013;13:36. doi: 10.1186/1471-2407-13-36. - DOI - PMC - PubMed
    1. Wagner JS, Adson MA, Van Heerden JA, et al. The natural history of hepatic metastases from colorectal cancer. A comparison with resective treatment. Ann Surg. 1984;199:502–8. doi: 10.1097/00000658-198405000-00002. - DOI - PMC - PubMed
    1. Xu Z, Yang Q, Chen X, et al. Clinical associations and prognostic value of site-specific metastases in non-small cell lung cancer: A population-based study. Oncol Lett. 2019;17:5590–600. doi: 10.3892/ol.2019.10225. - DOI - PMC - PubMed
    1. Kim JH, Kim SY, Baek JY, et al. A Phase II Study of Avelumab Monotherapy in Patients with Mismatch Repair-Deficient/Microsatellite Instability-High or POLE-Mutated Metastatic or Unresectable Colorectal Cancer. Cancer Res Treat. 2020;52:1135–44. doi: 10.4143/crt.2020.218. - DOI - PMC - PubMed

MeSH terms