. 2024 Dec 18;12(1):ENEURO.0532-24.2024.
doi: 10.1523/ENEURO.0532-24.2024. Online ahead of print.

The Epilepsy-Aphasia Syndrome gene, Cnksr2, Plays a Critical Role in the Anterior Cingulate Cortex Mediating Vocal Communication

Affiliations

The Epilepsy-Aphasia Syndrome gene, Cnksr2, Plays a Critical Role in the Anterior Cingulate Cortex Mediating Vocal Communication

Kazi Hossain et al. eNeuro. .

Abstract

Epilepsy Aphasia Syndrome (EAS) is a spectrum of childhood disorders that exhibit complex co-morbidities that include epilepsy and the emergence of cognitive and language disorders. CNKSR2 is an X-linked gene in which mutations are linked to EAS. We previously demonstrated Cnksr2 knockout (KO) mice model key phenotypes of EAS analogous to those present in clinical patients with mutations in the gene. Cnksr2 KO mice have increased seizures, impaired learning and memory, increased levels of anxiety, and loss of ultrasonic vocalizations (USV). The intricate interplay between these diverse phenotypes at the brain regional and cell type level remains unknown. Here we leverage conditional deletion of the X-linked Cnksr2 in a neuronal cell type manner in male mice to demonstrate that anxiety and impaired USVs track with its loss from excitatory neurons. Finally, we further narrow the essential role of Cnksr2 loss in USV deficits to excitatory neurons of the Anterior Cingulate Cortex (ACC), a region in mice recently implicated in USV production associated with specific emotional states or social contexts, such as mating calls, distress calls, or social bonding signals. Together, our results reveal Cnksr2-based mechanisms that underlie USV impairments that suggest communication impairments can be dissociated from seizures or anxiety. Furthermore, we highlight the cortical circuitry important for initiating USVs.Significance Statement Epilepsy-Aphasia Syndromes are at the severe end of a spectrum of cognitive-behavioral symptoms that are seen in childhood epilepsies and are currently an inadequately understood disorder. The prognosis of EAS is frequently poor and patients have life-long language and cognitive disturbances. We show that the deletion of Cnksr2 specifically within glutamatergic neurons of the anterior cingulate cortex leads to ultrasonic vocalization impairments, providing an important new understanding of the modulation of vocal communication.


Conflict of interest statement

The authors declare no competing financial interests.

Figures
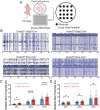
Figure 1.
Figure 1.
Cnksr2 loss in glutamatergic and GABAergic neurons leads to increased spontaneous firing rates of cortical neurons in vitro. A, Experimental design to record spontaneous local neural activity using the multielectrode array. Cultured cortical neurons were prepared from Cnksr2f/Y;Emx Cre+/−, Cnksr2f/Y;Emx Cre−/−, Cnksr2f/Y;Gad2 Cre+/−, and Cnksr2f/Y;Gad2 Cre−/− P0 neonatal male pups, and spontaneous neuronal activity was recorded at DIV7, 10, and 13. Three Cnksr2f/Y;Emx Cre+/− and Cnksr2f/Y;Gad2 Cre+/− and three Cnksr2f/Y;Emx Cre−/− and Cnksr2f/Y;Gad2 Cre−/− pups were used for three MEA plates. B, Representative raster plots showing spontaneous activity recorded Cnksr2f/Y;Emx Cre+/−, Cnksr2f/Y;Emx Cre−/−, Cnksr2f/Y;Gad2 Cre+/−, and Cnksr2f/Y;Gad2 Cre−/− cortical neurons on DIV 10. Electrodes 1–16 are presented on the y-axis, plotted against time. C, Graph of spontaneous weighted mean firing rates on DIV7, DIV10, and DIV13 for Cnksr2f/Y;Emx Cre+/− and Cnksr2f/Y;Emx Cre−/−. KO neurons displayed significantly increased weighted mean firing rates during all three time points (DIV7, *p = 0.0328; DIV10, ****p = <0.0001; DIV13, ****p < 0.0001; two-way ANOVA with multiple comparisons and repeated measures). n = 72 wells from three plates. Data are mean ±SEM. D, Graph of spontaneous weighted mean firing rates on DIV7, DIV10, and DIV13 for Cnksr2f/Y;Gad2 Cre+/− and Cnksr2f/Y;Gad2 Cre−/−. KO neurons displayed significantly increased weighted mean firing rates on DIV7 and DIV10 (DIV7, **p = 0.000013; DIV10, ***p < 0.000001; Wilcoxon test with multiple comparisons; non-Gaussian distribution). n = 72 wells from three plates, Data are mean ±SEM.
Figure 2.
Figure 2.
Loss of Cnksr2 in CaMKII excitatory neurons leads to USV deficits. A, Schematic experimental timeline for animal breeding and behavioral analysis. B, Representative spectrogram pattern of USVs in adult mice during courtship. Left, Cnksr2f/Y;CaMKII Cre+/− and Cnksr2f/Y;CaMKII Cre−/− spectrograms. Right, Cnksr2f/Y;Gad2 Cre+/− and Cnksr2f/Y;Gad2 Cre−/− spectrograms. C, Left, Graphs depicting the total number of calls for each genotype in a 10 min trial. Significant differences were observed in the Cnksr2f/Y;CaMKII Cre+/− (n = 12) group compared with Cnksr2f/Y;CaMKII Cre−/− (n = 13). No effect of genotype was detected for the Cnksr2f/Y;Gad2 Cre+/− (n = 8) group compared with Cnksr2f/Y;Gad2 Cre−/− (n = 8; *p = 0.0170 and p = 0.6712, respectively; unpaired t test). D, Right, Graphs depicting the average duration for each genotype. No significant difference was observed between genotypes in the duration of calls (p > 0.05, Mann–Whitney test). Data are ±SEM. E, Representative spatial heat maps of time spent in the arena during olfactory testing. Left, Cnksr2f/Y;CaMKII Cre−/− heat maps. F, Right, Cnksr2f/Y;CaMKII Cre+/− heat maps. The saline cassette was placed on the right side of the arena and the urine cassette on the left side of the arena. G, Graph depicting the quantification of total distance traveled for each group. No significant differences were observed between genotypes (Cnksr2f/Y;CaMKII Cre+/− n = 12; Cnksr2f/Y;CaMKII Cre−/− n = 11; p > 0.05 unpaired t test). Data are ±SEM. H, Graph depicting the sum number of scent zone visits for each group. No significant differences were observed between genotypes (Cnksr2f/Y;CaMKII Cre+/− n = 12; Cnksr2f/Y;CaMKII Cre−/− n = 11; p > 0.05 unpaired t test). Data are ±SEM.
Figure 3.
Figure 3.
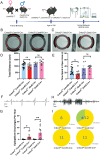
Loss of Cnksr2 in CaMKII-positive excitatory neurons contributes to elevated anxiety, while Gad2+ inhibitory deletion leads to seizures. A, Schematic experimental timeline for animal breeding and behavioral analysis. B, C, Elevated zero maze representative locomotion traces for Cnksr2f/Y;CaMKII Cre−/−, Cnksr2f/Y;CaMKII Cre+/−, Cnksr2f/Y;Gad2 Cre−/−, and Cnksr2f/Y;Gad2 Cre+/−, respectively. D, Graph of quantifications for EZM distance traveled (cm) showed no significant difference all groups (Cnksr2f/Y;CaMKII Cre−/− n = 14, Cnksr2f/Y;CaMKII Cre+/− n = 11; Cnksr2f/Y;Gad2 Cre−/− n = 8, Cnksr2f/Y;Gad2 Cre+/− n = 8; p > 0.05, unpaired t test). Data are mean ±SEM. E, Graph depicting time spent in the open arms (s) of Cnksr2f/Y;CaMKII Cre+/− (n = 11) showing a significant decrease compared with Cnksr2f/Y;CaMKII Cre−/− (n = 14; *p = 0.0476, unpaired t test). Cnksr2f/Y;Gad2 Cre+/− (n = 8) shows no significant change in time spent in open arms (p > 0.05, unpaired t test). Data are mean ±SEM. F, Representative EEG trace of short spike–wave epileptiform discharges detected in a Cnksr2f/Y; Gad2 Cre+/− mouse. G, Graph depicting the quantification of epileptiform discharges in all groups. Both Cnksr2f/Y; Gad2 Cre+/− (n = 12) and Cnksr2f/Y; CaMKII Cre+/− (n = 11) displayed significantly increased number epileptiform discharges compared with their control littermates (Cnksr2f/Y; Gad2 Cre−/− n = 8; Cnksr2f/Y; CaMKII Cre−/− n = 11; **p = 0.0014, *p = 0.04; Mann–Whitney test). Data are mean ±SEM. H, Representative EEG trace of electrographic seizures detected in a Cnksr2f/Y; Gad2 Cre+/− mouse. I, Pie chart of mice that display seizures during 1 d of recording. Cnksr2f/Y;CamKII Cre−/−, Cnksr2f/Y;CamKII Cre+/−, and Cnksr2f/Y;Gad2 Cre−/− lack seizure activity but 4/12 Cnksr2f/Y;Gad2 Cre+/− mice exhibit seizures with a total of 36 events collectively among the 4 mice. Data are mean ± SEM.
Figure 4.
Figure 4.
Loss of Cnksr2 in Emx+ glutamatergic neurons recapitulates the elevated anxiety and reduced USV phenotypes of knock-out mice. A, Schematic experimental timeline for animal breeding and behavioral analysis. B, Representative locomotion traces during elevated zero maze for Cnksr2f/Y;Emx Cre−/− (top) and Cnksr2f/Y;Emx Cre+/− (bottom) male mice. C, Graph depicting the total time spent in the open arms of the maze for both groups is shown. Cnksr2f/Y;Emx Cre+/− (n = 16) mice spent significantly less time in the open arms than the Cnksr2f/Y;Emx Cre−/− (n = 13; ***p = 0.0009, Mann–Whitney test). Data are mean ± SEM. D, Graph of the locomotor velocity. No significant effect of genotype in either group was detected (p > 0.05; unpaired t test). Cnksr2f/Y;Emx Cre+/− (n = 16) and Cnksr2f/Y;Emx Cre−/− (n = 13). Data are mean ± SEM. E, Graph of the distance traveled. No significant effect of genotype in either group was detected (p > 0.05; unpaired t test). Cnksr2f/Y;Emx Cre+/− (n = 16) and Cnksr2f/Y;Emx Cre−/− (n = 13). Data are mean ± SEM. F, Representative spectrogram pattern of USVs in adult mice during courtship. Top, Cnksr2f/Y;Emx Cre−/− spectrograms. Bottom, Cnksr2f/Y;Emx Cre+/− spectrograms. G, Graph depicting the total number of calls produced by male mice exposed to females. Cnksr2f/Y;Emx Cre+/− mice (n = 16) had a significant decrease in USVs produced compared with Cnksr2f/Y;Emx Cre−/− (n = 13; ***p = 0.0004, unpaired t test). Data are mean ± SEM. H, Graph showing the average duration of calls produced by male mice when exposed to female mice. Cnksr2f/Y;Emx Cre+/− mice (n = 16) had a significant decrease in the average duration of USVs compared with Cnksr2f/Y;Emx Cre−/− (n = 13) male mice (*p = 0.0196, Mann–Whitney test). Data are mean ± SEM.
Figure 5.
Figure 5.
Retro-orbital viral-mediated knock-out of Cnksr2 affects USV production. A, Schematic experimental timeline for animal breeding, injections, and behavioral analysis. B, Representative histology image for retro-orbital viral infection with Php.eB-CAG-tdTomato in a sagittal section of 50 µm at P60. Php.eB-CAG-tdTomato expression can be seen throughout the entire brain, particularly in the cortex. Scale bar, 500 µm. C, Representative spectrogram pattern of USVs in adult mice during courtship. Left, Cnksr2f/Y-AAV-Php.eB-CAG-tdTomato. Right, Cnksr2f/Y-AAV-Php.eB-CaMKII-Cre-GFP. D, The number of calls was significantly decreased in Cnksr2f/Y-AAV-Php.eB-CaMKII-Cre-GFP group (n = 8) when compared with Cnksr2f/Y-AAV-Php.eB-CAG-tdTomato (n = 7; *p = 0.0200, Mann–Whitney test). Data are mean ± SEM. E, Average duration of calls was significantly decreased in Cnksr2f/Y-AAV-Php.eB-CaMKII-Cre-GFP group (n = 8) when compared with Cnksr2f/Y-AAV-Php.eB-CAG-tdTomato (n = 7; *p = 0.0312 unpaired t test). Data are mean ± SEM.
Figure 6.
Figure 6.
Deletion of Cnksr2 within CaMKII-positive glutamatergic neurons of the mPFC does not affect USV production. A, Schematic experimental timeline for animal breeding, injections, and behavioral analysis. B, Representative histology image for mPFC viral targeting of Cnksr2 in coronal section of 50 µm at P60. AAV2/9-CamKII-Cre-GFP expression can be seen in the mPFC. Scale bar, 500 µm. C, Example spectrogram pattern of USV's in (top) Cnksr2f/Y-AAV2/9-CAG-tdTomato and (bottom) Cnksr2f/Y-AAV2/9-CaMKII-Cre-GFP adult male mice during courtship. Graphs of (D) total number of calls and (E) average call duration. No significant effect was observed on the number of calls and average duration of calls (p > 0.05 unpaired t test; n = 6). Data are mean ± SEM. F, Representative locomotion traces in the elevated zero maze for (left) Cnksr2f/Y-AAV2/9-CAG-tdTomato and (right) Cnksr2f/Y-AAV2/9-CaMKII-Cre-GFP male mice. Graphs showing elevated zero maze data for (G) time in the open arms; (H) average velocity; and (I) total distance moved. No significant effect of treatment was observed in any of these metrics (p > 0.05; unpaired t test; Cnksr2f/Y-AAV2/9-CAG-tdTomato n = 6 and Cnksr2f/Y-AAV2/9-CaMKII-Cre-GFP n = 7). Data are mean ± SEM.
Figure 7.
Figure 7.
Deletion of Cnksr2 within CaMKII-positive glutamatergic neurons of the ACC leads to altered USV behavior. A, Schematic of experimental timeline for animal breeding, injections, and behavioral analysis. B, Representative histology image for ACC viral targeting of Cnksr2 in coronal section of 50 µm at P60. AAV2/9-CamKII-Cre-GFP expression can be seen in the ACC. Scale bar, 500 µm. C, Example spectrogram pattern of USV's in (top) Cnksr2f/Y-AAV2/9-CAG-tdTomato and (bottom) Cnksr2f/Y-AAV2/9-CaMKII-Cre-GFP adult male mice during courtship. Graphs of (D) total number of calls and (E) average call duration. The number of calls was significantly decreased in Cnksr2f/Y-AAV2/9-CaMKII-Cre-GFP (n = 13) when compared with Cnksr2f/Y-AAV2/9-CAG-tdTomato groups (n = 12). The average duration was not affected (p > 0.05, Mann–Whitney test; number of calls **p = 0.0089, unpaired t test). F, Elevated zero maze representative locomotion traces shown for (left) AAV2/9-CAG-tdTomato and (right) AAV2/9-CaMKII-Cre-GFP injections. Graphs showing elevated zero maze data for (G) time in the open arms; (H) average velocity; and (I) total distance moved. No significant effect of treatment was observed in any of these metrics (p > 0.05; unpaired t test; n = 13; p > 0.05; unpaired t test). Data are mean ± SEM.
Figure 8.
Figure 8.
Quantitative analysis of the viral-mediated depletion of Cnksr2 from the ACC and mPFC. A, Schematic showing three different peptides and the exons they are derived from that were targeted for PRM LC-MS assay to quantify relative protein expression levels across WT and cKO animals. B–F, Representative PRM chromatograms of the examples for the most abundant product ions for (B) Cnksr2, (C) plectin, (D) bassoon, (E) myosin 10, and (F) alpha II spectrin. G, Quantification of protein abundance of Cnksr2 in control and cKO ACC and mPFC regions as calculated by averaging the abundance of all three peptides targeted for all samples. Cnskr2 was significantly depleted in the cKOs compared with the WT control (****p = <0.0001 for ACC cKO, ***p = 0.0004 for mPFC cKO, one-way ANOVA with multiple comparisons). n = 3 animals per group. Data are mean ± SEM. H, Quantification of protein abundance for control proteins in WT and cKO ACC and mPFC regions as calculated by averaging the abundance of all three peptides targeted for all samples. No significant differences were observed. Data are mean ± SEM.

Similar articles

References

    1. Arriaga G, Jarvis ED (2013) Mouse vocal communication system: are ultrasounds learned or innate? Brain Lang 124:96–116. 10.1016/j.bandl.2012.10.002 - DOI - PMC - PubMed
    1. Arriaga G, Zhou EP, Jarvis ED (2012) Of mice, birds, and men: the mouse ultrasonic song system has some features similar to humans and song-learning birds. PLoS One 7. 10.1371/journal.pone.0046610 - DOI - PMC - PubMed
    1. Beckstead RM, Morse JR, Norgren R (1980) The nucleus of the solitary tract in the monkey: projections to the thalamus and brain stem nuclei. J Comp Neurol 190:259–282. 10.1002/cne.901900205 - DOI - PubMed
    1. Bennett PJG, Maier E, Brecht M (2019) Involvement of rat posterior prelimbic and cingulate area 2 in vocalization control. Eur J Neurosci 50:3164–3180. 10.1111/ejn.14477 - DOI - PMC - PubMed
    1. Benvenuto M, Palumbo P, Di Muro E, Perrotta CS, Mazza T, Mandarà GML, Palumbo O, Carella M (2023) Identification of a novel FOXP1 variant in a patient with hypotonia, intellectual disability, and severe speech impairment. Genes (Basel) 14. 10.3390/genes14101958 - DOI - PMC - PubMed

LinkOut - more resources