. 2024 Dec 18;15(12):911.
doi: 10.1038/s41419-024-07287-0.

Downregulation of tRNA methyltransferase FTSJ1 by PM2.5 promotes glycolysis and malignancy of NSCLC via facilitating PGK1 expression and translation

Affiliations

Downregulation of tRNA methyltransferase FTSJ1 by PM2.5 promotes glycolysis and malignancy of NSCLC via facilitating PGK1 expression and translation

Yiling Wang et al. Cell Death Dis. .

Abstract

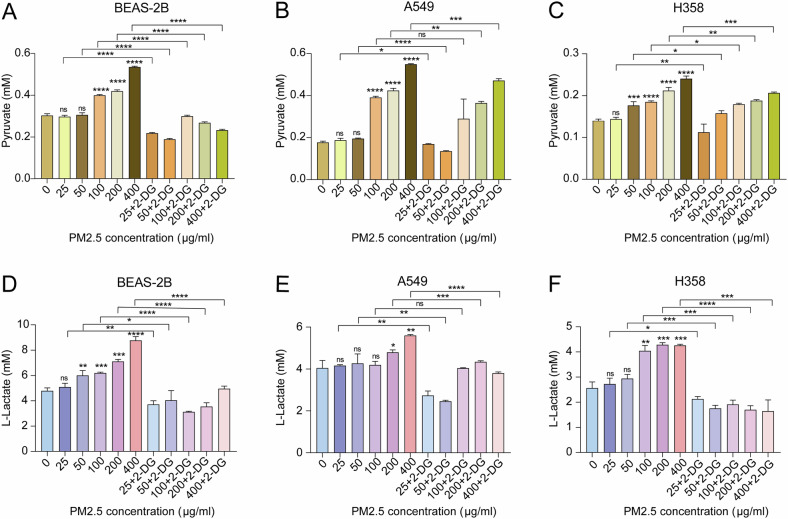
Fine particulate matter (PM2.5) exposure has been associated with increased incidence and mortality of lung cancer. However, the molecular mechanisms underlying PM2.5 carcinogenicity remain incompletely understood. Here, we identified that PM2.5 suppressed the expression of tRNA methyltransferase FTSJ1 and Am modification level of tRNA in vitro and in vivo. FTSJ1 downregulation enhanced glycolytic metabolism of non-small cell lung cancer (NSCLC) cells, as indicated by increased levels of lactate, pyruvate, and extracellular acidification rate (ECAR). Whereas treatment with glycolytic inhibitor 2-DG reversed this effect. In contrast, upregulation of FTSJ1 significantly suppressed glycolysis of NSCLC cells. Mechanistically, the silencing of FTSJ1 increased NSCLC cell proliferation and glycolysis through enhancing the expression and translation of PGK1. In human NSCLC tumor samples, FTSJ1 expression was negatively correlated with PGK1 expression level and the SUVmax value of PET/CT scan. In summary, our work reveals a previously unrecognized function of PM2.5-downregulated FTSJ1 on PGK1-mediated glycolysis in NSCLC, suggesting that targeted upregulation of FTSJ1 may represent a potential therapeutic strategy for NSCLC.


Conflict of interest statement

Competing interests: The authors declare no competing interests. Ethics approval and consent to participate: All methods were performed in accordance with the relevant guidelines and regulations. Studies using human samples were approved by the Medical Ethics Committee of Shenzhen University (Approved no. 2016002) and informed, written consents were obtained from all study subjects. All animal experiments were carried out following the procedures approved by the Institutional Animal Care and Use Committee of Shenzhen University Medical School (Approval No. IACUC-202300059).

Figures

Fig. 1
Fig. 1. PM2.5 suppresses the expression of tRNA methyltransferase FTSJ1 in vitro and in vivo.
A Schematic diagram and timeframe for PM2.5 exposure experiments in rat model. B PM2.5 inhibits FTSJ1 gene expression in lung tissues of rats. C, D PM2.5 suppresses FTSJ1 protein expression in lung tissue of rats in a dose-response manner. E PM2.5 downregulates tRNA AM modification levels in lung tissue of rats. F PM2.5 inhibits FTSJ1 gene expression in BEAS-2B cells. G PM2.5 suppresses FTSJ1 gene expression in A549 cells. H PM2.5 reduces FTSJ1 gene expression level in H358 cells. I, L PM2.5 downregulates FTSJ1 protein expression in BEAS-2B cells. J, M PM2.5 inhibits FTSJ1 protein expression in A549 cells. K, N PM2.5 suppresses FTSJ1 protein expression in H358 cells. Data are presented as mean ± SD, Student’s t test. NS not significant; *p < 0.05 vs. control (no PM2.5 exposure); **p < 0.01 vs. control;***p < 0.001 vs. control; ****p < 0.0001 vs. control.
Fig. 2
Fig. 2. PM2.5 promotes glycolysis metabolism in BEAS-2B and NSCLC cells.
A PM2.5 increases the production of pyruvate from BEAS-2B cells, and the effect of PM2.5 on pyruvate production is suppressed by 2-DG. B PM2.5 enhances the generation of pyruvate from A549 cells in a dose response fashion, and 2-DG treatment alleviates the impacts of PM2.5 on pyruvate generation from A549 cells. C PM2.5 promotes pyruvate release from H358 cells, and 2-DG inhibits the effects of PM2.5 on pyruvate release from H358 cells. D PM2.5 augments L-lactate release from BEAS-2B cells, and 2-DG suppresses the effects of PM2.5 on L-lactate release from BEAS-2B cells. E PM2.5 up-regulates L-lactate levels in the culture medium A549 cells, while 2-DG downregulates the levels of PM2.5-induced L-lactate. F PM2.5 augments the production of L-lactate from H358 cells, and 2-DG represses PM2.5-induced L-lactate production from H358 cells. Data are presented as mean ± SD, Student’s t test. NS not significant; *p < 0.05, **p < 0.01, ***p < 0.001. All p values are versus control or similar PM2.5 exposure level group.
Fig. 3
Fig. 3. Down-regulation of FTSJ1 increases glycolysis metabolism in NSCLC cells.
A FTSJ1 induces differentially expressed genes (DEGs) in NSCLC cells. B GSEA suggests that DEGs are enriched in glycolysis-gluconeogenesis pathway. C DEGs are abundant in oxidative phosphorylation pathway. D GO analysis implies that DEGs are involved in metabolic biological processes. E Downregulation of FTSJ1 promotes L-lactate production in A549 cells. F Inhibition of FTSJ1 leads to higher generation of L-lactate from H358 cells. G Knockdown of FTSJ1 potentiates production of pyruvate in A549 cells. H Suppression of FTSJ1 promotes pyruvate generation from H358 cells. I Upregulation of FTSJ1 suppresses L-lactate production in A549 cells. J Overexpression of FTSJ1 inhibits L-lactate release from H358 cells. K Higher FTSJ1 expression decreases pyruvate production in A549 cells. L Increased expression of FTSJ1 reduces the production of pyruvate from H358 cells. M Overexpression of FTSJ1 decreases the levels of extracellular acid ratio (ECAR) in A549 cells. N Downregulation of FTSJ1 increases ECAR levels of A549 cells. O FTSJ1 suppresses ECAR levels of H358 cells. P Inhibition of FTSJ1 enhances ECAR levels of H358 cells. Data are presented as mean ± SD, Student’s t test. *p < 0.05, **p < 0.01, ***p < 0.001; ****p < 0.0001. All p values are versus NC or between different treated groups.
Fig. 4
Fig. 4. FTSJ1 modulates the expression of glycolytic gene PGK1 in NSCLC cells.
A Molecular structure of FTSJ1 (left) and predicted 3D structures of FTSJ1 and PGK1, and the binding mode of FTSJ1 to PGK1 (right). B Overexpression of FTSJ1 suppresses PGK1 gene expression in A549 cells. C Up-regulation of FTSJ1 inhibits PGK1 gene expression in H358 cells. D Inhibition of FTSJ1 expression promotes PGK1 gene expression in A549 cells. E Knockdown of FTSJ1 enhances PGK1 gene expression in H358 cells. F, J Overexpression of FTSJ1 suppresses PGK1 protein expression in A549 cells. G, K Upregulation of FTSJ1 downregulates PGK1 protein expression in H358 cells. H, L Downregulation of FTSJ1 increases PGK1 protein expression in A549 cells. I, M Knockdown of FTSJ1 promotes PGK1 protein expression in H358 cells. Data are presented as mean ± SD, Student’s t test. *p < 0.05, **p < 0.01, ***p < 0.001. All p values are versus NC.
Fig. 5
Fig. 5. FTSJ1 regulates aerobic glycolysis and proliferation of NSCLC cells in a PGK1-dependent manner.
A Rescue assays showed that co-transfection of OE-FTSJ1 and OE-PGK1 suppresses the promoting ability of PGK1 on proliferation of A549 cells. B Up-regulation of FTSJ1 decreases PGK1-induced proliferation rate in H358 cells. C OE-FTSJ1 inhibits PGK1-induced production of L-Lactate from A549 cells. D OE-FTSJ1 reduces PGK1-mediated production of pyruvate from A549 cells. E OE-FTSJ1 decreases PGK1-induced release of L-Lactate from H358 cells. F OE-FTSJ1 inhibits PGK1-mediated generation of pyruvate from H358 cells. Data are presented as mean ± SD, Student’s t test. *p < 0.05, **p < 0.01, ***p < 0.001; ****p < 0.0001. All p values are versus NC or between different treated groups.
Fig. 6
Fig. 6. FTSJ1 regulates the translation and histone H3K27ac modification of PGK1 in NSCLC cells.
A Polysome profiling shows a general translation suppression in FTSJ1-overexpression cells compared with that in NC cells. B Up-regulation of FTSJ1 decreases the abundance of PGK1 mRNA in the polysomes but increases the expression levels of PGK1 in monosomes in A549 cells. C Overexpression of FTSJ1 decreased the polysome to monosome ratio of PGK1 mRNA expression, indicating a reduction of PGK1 translation. D Polysome profiling of si-FTSJ1-treated A549 cells suggests a trend of increasing translation in comparison with control cells. E Inhibition of FTSJ1 increases the abundance of PGK1 mRNA in polysomes but decreases the expression levels of PGK1 in monosomes in A549 cells. F Downregulation of FTSJ1 enhances the polysome to monosome ratio of PGK1 mRNA expression, indicating an increase of PGK1 translation. G Schematic illustration of four potential binding sites (Ch-IP1, Ch-IP2, Ch-IP3, Ch-IP4) in the PGK1 promoter for FTSJ1 (top). ChIP assay indicates the binding of FTSJ1 and PGK1 (bottom). H ChIP-qPCR assay with anti-FTSJ1 antibody verifies the binding between FTSJ1 and two sites in the PGK1 promoter in A549 cells. I ChIP-qPCR assay shows that inhibition of FTSJ1 increases H3K27ac levels in PGK1 promoter region. Data are presented as mean ± SD, Student’s t test. *p < 0.05, **p < 0.01, ***p < 0.001. All p values are versus NC.
Fig. 7
Fig. 7. Association of FTSJ1 and PGK1 expression with glucose uptake in patients with NSCLC.
A Representative immunohistochemical staining (IHC) images of high and low FTSJ1 expression in tumor tissues from NSCLC patients. Scale bar: 5 µm. B Mean SUVmax score in FTSJ1 negative NSCLC tissue samples was higher than that of positive tissues. C FTSJ1 expression level in tumor tissues was negatively correlated with SUVmax score. D Representative IHC images of high and low PGK1 expression in tumor tissues of NSCLC patients. Scale bar: 5 µm. E Mean SUVmax score in PGK1 positive tissues was higher than that of PGK1 negative samples. F PGK1 expression level in NSCLC tumor tissues was positively correlated with SUVmax score. G FTSJ1 expression level was negatively correlated with PGK1 expression in NSCLC tumor tissues. H Representative image of 18FDG PET-CT scan in NSCLC patients with high FTSJ1 expression. The arrow reveals lower glucose uptake. I Representative image of 18FDG PET-CT scan in NSCLC patients with low FTSJ1 expression level in tumor tissues. The arrow points to higher glucose uptake. Data are presented as mean ± SD. Two-tailed paired t-test. *p < 0.05, **p < 0.01, ***p < 0.001.

References

    1. Lim SS, Vos T, Flaxman AD, Danaei G, Shibuya K, Adair-Rohani H, et al. A comparative risk assessment of burden of disease and injury attributable to 67 risk factors and risk factor clusters in 21 regions, 1990-2010: a systematic analysis for the Global Burden of Disease Study 2010. Lancet. 2012;380:2224–60. - PMC - PubMed
    1. Samek L, Furman L, Mikrut M, Regiel-Futyra A, Macyk W, Stochel G, et al. Chemical composition of submicron and fine particulate matter collected in Krakow, Poland. Consequences for the APARIC project. Chemosphere. 2017;187:430–9. - PubMed
    1. Javed W, Iakovides M, Stephanou EG, Wolfson JM, Koutrakis P, Guo B. Concentrations of aliphatic and polycyclic aromatic hydrocarbons in ambient PM2.5 and PM10 particulates in Doha, Qatar. J Air Waste Manag Assoc. 2019;69:162–77. - PubMed
    1. Hamra GB, Guha N, Cohen A, Laden F, Raaschou-Nielsen O, Samet JM, et al. Outdoor particulate matter exposure and lung cancer: a systematic review and meta-analysis. Environ Health Perspect. 2014;122:906–11. - PMC - PubMed
    1. Eckel SP, Cockburn M, Shu YH, Deng H, Lurmann FW, Liu L, et al. Air pollution affects lung cancer survival. Thorax. 2016;71:891–8. - PMC - PubMed

MeSH terms