. 2024 Dec 18;14(1):488.
doi: 10.1038/s41398-024-03206-1.

GABAAR-PPT1 palmitoylation homeostasis controls synaptic transmission and circuitry oscillation

Affiliations

GABAAR-PPT1 palmitoylation homeostasis controls synaptic transmission and circuitry oscillation

Jia Tong et al. Transl Psychiatry. .

Abstract

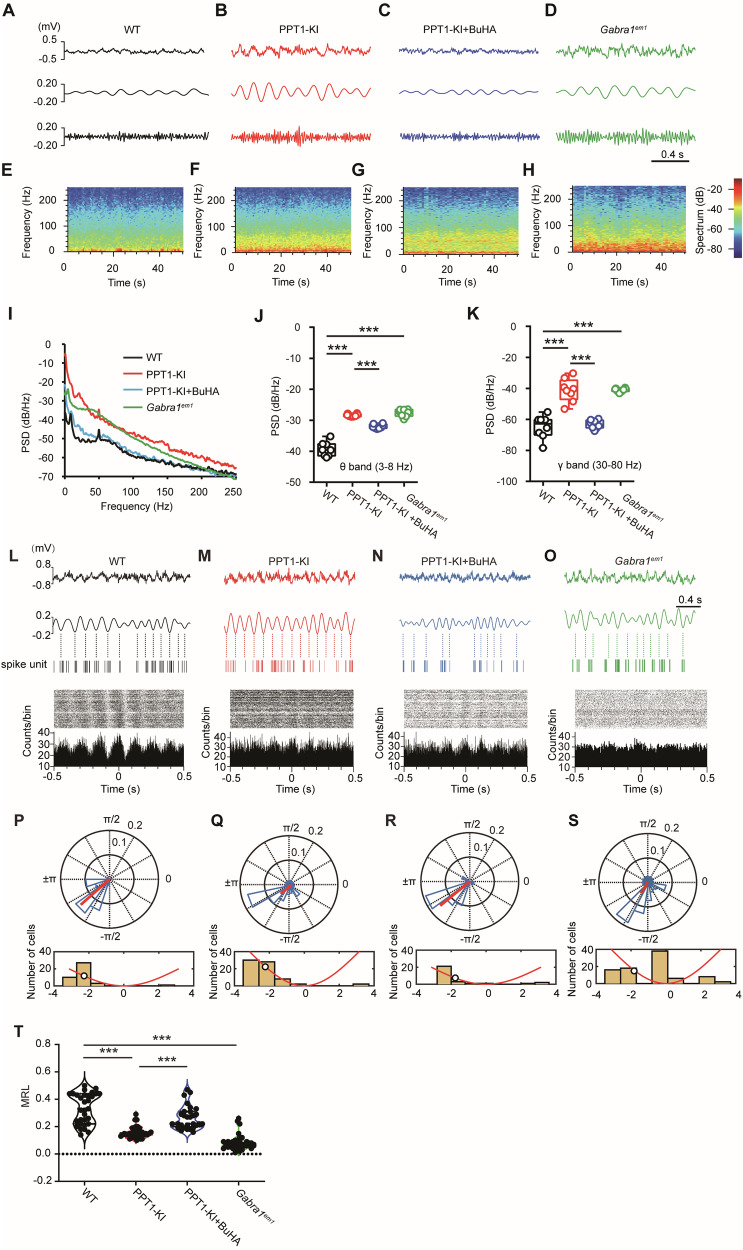
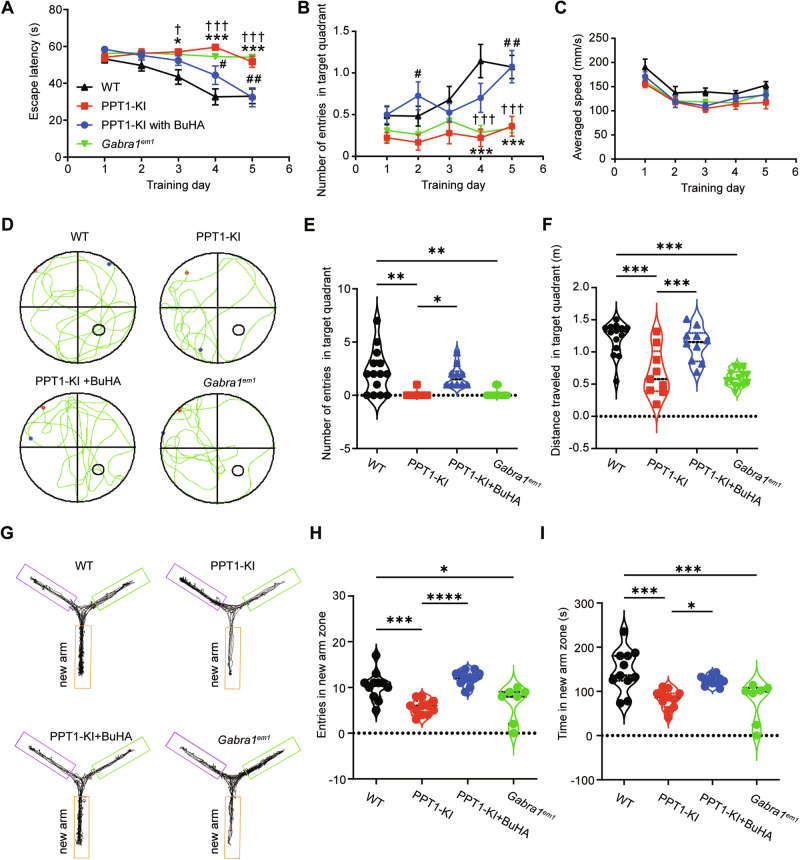
The infantile neuronal ceroid lipofuscinosis, also called CLN1 disease, is a fatal neurodegenerative disease caused by mutations in the CLN1 gene encoding palmitoyl protein thioesterase 1 (PPT1). Identifying the depalmitoylation substrates of PPT1 is crucial for understanding CLN1 disease. In this study, we found that GABAAR, the critical synaptic protein essential for inhibitory neurotransmission, is a substrate of PPT1. PPT1 depalmitoylates GABAAR α1 subunit at Cystein-260, while binding to Cystein-165 and -179. Mutations of PPT1 or its GABAAR α1 subunit binding site enhanced inhibitory synaptic transmission and strengthened oscillations powers but disrupted phase coupling in CA1 region and impaired learning and memory in 1- to 2-months-old PPT1-deficient and Gabra1em1 mice. Our study highlights the critical role of PPT1 in maintaining GABAAR palmitoylation homeostasis and reveals a previously unknown molecular pathway in CLN1 diseases induced by PPT1 mutations.


Conflict of interest statement

Competing interests: The authors declare no competing interests. Ethics approval and consent to participate: The experiments did not involve tissues from humans. Animal use and procedures were performed according to the regulations and requirements of XXMU Animal Ethics Committee (No. XYLL2021053).

Figures

Fig. 1
Fig. 1. PPT1 deficiency enhances GABAergic transmission without affecting the excitatory synaptic transmission.
A Sample traces showing evoked IPSCs recorded at +40 mV from CA1 pyramidal cells in 1- to 2-month-old WT (black trace) and PPT1-KI mice (red trace). Amplitude (B), fast tau, and slow tau (C) of IPSCs from (A). WT: n = 8 neurons from six slices; PPT1-KI: n = 8 neurons from five slices. T-test, **P < 0.01. Sample traces (D) showing mIPSCs amplitude (E) and frequency (F) are enhanced in PPT1-KI mice, Gabra1em1 mice, compared to WT mice, and partially recovered by pre-incubation with 1 μM BuHA. WT: n = 12 neurons from 9 slices; PPT1-KI: n = 11 neurons from 7 slices; Gabra1em1: n = 11 neurons from 10 slices, PPT1-KI with BuHA: n = 11 neurons from 6 slices. Histogram: One-way ANOVA, *P < 0.05, **P < 0.01, ***P < 0.001; cumulative curve: Kolmogorov–Smirnov test, **P < 0.01, ***P < 0.001. G Sample traces of evoked EPSCs recorded from WT (black trace) and PPT1-KI mice (red trace) hippocampal pyramidal neurons at +40 mV (upper traces) and -70 mV (bottom traces). Amplitudes of AMPAR (H), NMDAR (I), and AMPAR/NMDA ratio (J) from the evoked EPSCs of hippocampal pyramidal neurons. WT: n = 11 neurons from 10 slices; PPT1-KI: n = 8 neurons from 6 slices; t-test: no significant difference. KM Representative traces and analyses of mEPSCs recorded from CA1 pyramidal neurons of WT (black trace) and PPT1-KI (red trace) mice. WT: n = 12 neurons from 10 slices; PPT1-KI: n = 9 neurons from 9 slices; PPT1-KI with 5 μM BuHA: n = 8 neurons from 7 slices. A one-way ANOVA showed no significant differences. Data are represented as mean ± SEM.
Fig. 2
Fig. 2. GABAAR α1 subunit is a substrate of PPT1 enzyme.
Representative immunoblot (A) and quantification (B) of GABAAR α1 subunits levels on the cellular membrane in WT and PPT1-KI mice at indicated ages. N = 3 for each group, two-way ANOVA, *P < 0.05. C Quantitative PCR showing developmental changes in the mRNA expression of GABAAR α1 subunit at the indicated ages. N = 3, two-way ANOVA, *P < 0.05. Representative immunoblotting (D) and quantification (E) of GABAAR α1 subunit levels on the cellular membrane in WT, PPT1-KI, and PPT1-KI mice treated with BuHA. N = 3 for each group, one-way ANOVA; *P < 0.05, **P < 0.01. F, G Increased levels of the palmitoylated GABAAR α1 subunit in cultured PPT1-KI neurons, which were recovered by incubation with BuHA. Representative images (H) and colocalization analysis (I) of GABAAR α1 subunit and PPT1 enzyme in cultured hippocampal neurons from WT mice. Fluorescence intensity was measured using the red line across the cell body. N = 8 cells. +HA, with hydroxylamine; N = 3 for each group, one-way ANOVA, *P < 0.05; **P < 0.01. Data are represented as mean ± SEM.
Fig. 3
Fig. 3. Identification of the binding sites between GABAAR α1 subunit and PPT1.
(A) Interaction between PPT1 and GABAAR α1 subunit verified by in vitro CO-IP using mouse hippocampal tissue. IB: immunoblotting. (B) Bioinformatic prediction of palmitoylation site (Cys). (C, D) Identification of palmitoylation sites within GABAAR α1 subunit. Mutation of Cys-260 residues to alanine reduce palmitoylation level of GABAAR α1 in 293 T cell line. N = 3, one-way ANOVA, *P < 0.05. (E-H) Representative blots and quantification of immunoprecipitation show that mutations of Cys-165 and Cys-179 (E, F), but not Cys-260 or Cys-319 (G, H), to alanine block GABAAR α1 subunit binding to PPT1 in 293 T cell line. N = 3, one-way ANOVA, **P < 0.01.
Fig. 4
Fig. 4. Disruption of PPT1-GABAAR interaction enhances theta and gamma oscillation power but impairs theta phase coupling in CA1 region.
FP signals recorded in the CA1 region of WT (A), PPT1-KI (B), PPT1-KI treated with BuHA (C), and Gabra1em1 mice (1 to 2 months old) (D). Lower traces show filtered theta (3–8 Hz) and gamma oscillation (30–80 Hz) from the FP signals. Spectrograms of the FP signals recorded from WT (E), PPT1-KI (F), BuHA-treated PPT1-KI (G), and Gabra1em1 (H) mice. I PSD of FP recorded from WT (black), PPT1-KI (red), BuHA-treated PPT1-KI (blue), and Gabra1em1 (green) mice. Analysis of the theta (J) and gamma (K) PSD. WT: n = 8 mice; PPT1-KI: n = 8 mice; PPT1-KI treated with BuHA: n = 8 mice; Gabra1em1: n = 6 mice; one-way ANOVA, ***P < 0.001. Sample traces show theta phase locking in the CA1 region. Peri-event raster (upper panel) and histogram (lower panel) displaying phase coupling of spike units and theta waves recorded from WT (L), PPT1-KI (M), BuHA-treated PPT1-KI (N), and Gabra1em1 (O) mice. Tips display the timestamps of the spike units. Dotted lines indicate valleys of theta waves. Bin width is 2 ms. Circular distribution of mean-spike theta phase angles (15° bin width) (upper panel) recorded from the CA1 area of WT (P), PPT1-KI (Q), BuHA-treated PPT1-KI (R), and Gabra1em1 (S) mice. The red bars represent the direction and magnitude (length) of the MRL of the population. T Comparison of mean MRL values between multiple groups. WT: n = 31 neurons from 6 mice; PPT1-KI: n = 35 neurons from 5 mice; BuHA-treated PPT1-KI: n = 29 neurons from 5 mice; Gabra1em1: n = 40 neurons from 6 mice. Kruskal–Wallis test, ***P < 0.001. Data are represented as mean ± SEM.
Fig. 5
Fig. 5. PPT1-GABAAR axis interruption causes spatial learning and memory deficits.
Average latency to reach the hidden platform (A), number of times entering the platform area (B), averaged swimming speed (C) in five days. WT (n = 14), PPT1-KI (n = 9), PPT1-KI mice treated with BuHA (n = 10), and Gabra1em1 mice (n = 12), two-way ANOVA, WT vs. PPT1-KI: *P < 0.05, **P < 0.01, ***P < 0.001; PPT1-KI vs. PPT1-KI mice treated with BuHA: #P < 0.05, ##P < 0.01; WT vs. Gabra1em1: P < 0.05, †††P< 0.001. D Representative paths of WT, PPT1-KI, PPT1-KI mice treated with BuHA, and Gabra1em1 mice were recorded on the spatial probe test day. Times entering the platform area (E) and total distance (F) in the test trial (day 6). WT mice: n = 14; PPT1-KI mice: n = 9; PPT1-KI mice treated with BuHA: n = 10; Gabra1em1 mice: n = 12, one-way ANOVA, *P < 0.05, **P < 0.01, ***P < 0.001. G Path taken in the Y-maze test by WT, PPT1-KI, PPT1-KI mice treated with BuHA and Gabra1em1 mice. Times of novel arm entries in test trial (H) and time spent in the novel arm zone (I). WT (n = 11), PPT1-KI (n = 11), PPT1-KI mice treated with BuHA (n = 11), and Gabra1em1 mice (n = 7); one-way ANOVA, *P < 0.05, ***P < 0.001. Data are represented as mean ± SEM.

Similar articles

Cited by

References

    1. Camp LA, Verkruyse LA, Afendis SJ, Slaughter CA, Hofmann SL. Molecular cloning and expression of palmitoyl-protein thioesterase. J Biol Chem. 1994;269:23212–9. - PubMed
    1. Jin J, Zhi X, Wang X, Meng D. Protein palmitoylation and its pathophysiological relevance. J Cell Physiol. 2021;236:3220–33. - PubMed
    1. Lemonidis K, Werno MW, Greaves J, Diez-Ardanuy C, Sanchez-Perez MC, Salaun C, et al. The zDHHC family of S-acyltransferases. Biochem Soc Trans. 2015;43:217–21. - PubMed
    1. Mitchell DA, Vasudevan A, Linder ME, Deschenes RJ. Protein palmitoylation by a family of DHHC protein S-acyltransferases. J Lipid Res. 2006;47:1118–27. - PubMed
    1. Vesa J, Hellsten E, Verkruyse LA, Camp LA, Rapola J, Santavuori P, et al. Mutations in the palmitoyl protein thioesterase gene causing infantile neuronal ceroid lipofuscinosis. Nature. 1995;376:584–7. - PubMed

Substances

LinkOut - more resources