. 2024 Dec 18;15(12):897.
doi: 10.1038/s41419-024-07274-5.

Overexpression of ELF3 in the PTEN-deficient lung epithelium promotes lung cancer development by inhibiting ferroptosis

Affiliations

Overexpression of ELF3 in the PTEN-deficient lung epithelium promotes lung cancer development by inhibiting ferroptosis

Zengzhuang Yuan et al. Cell Death Dis. .

Erratum in

Abstract

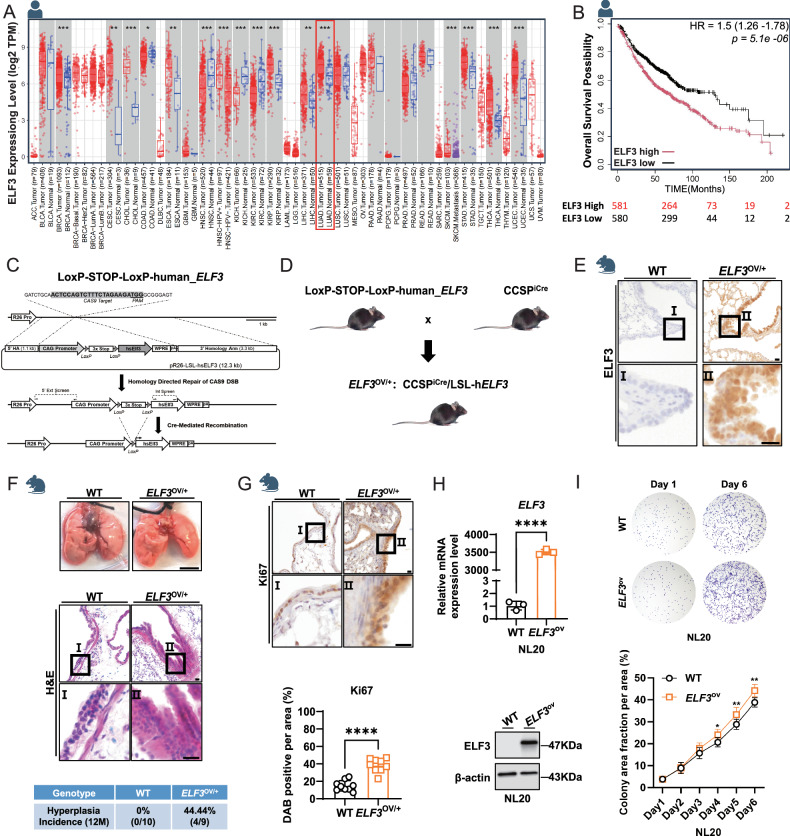
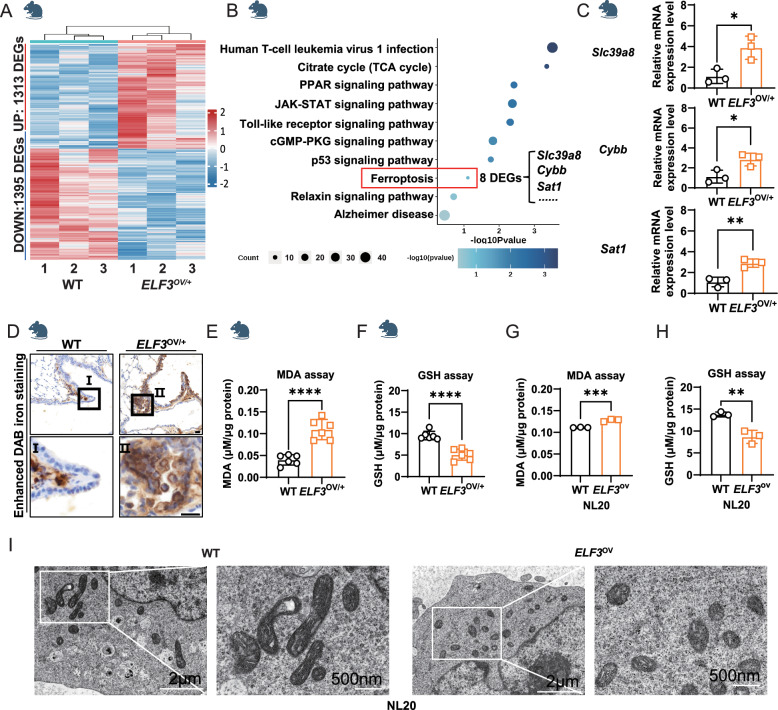
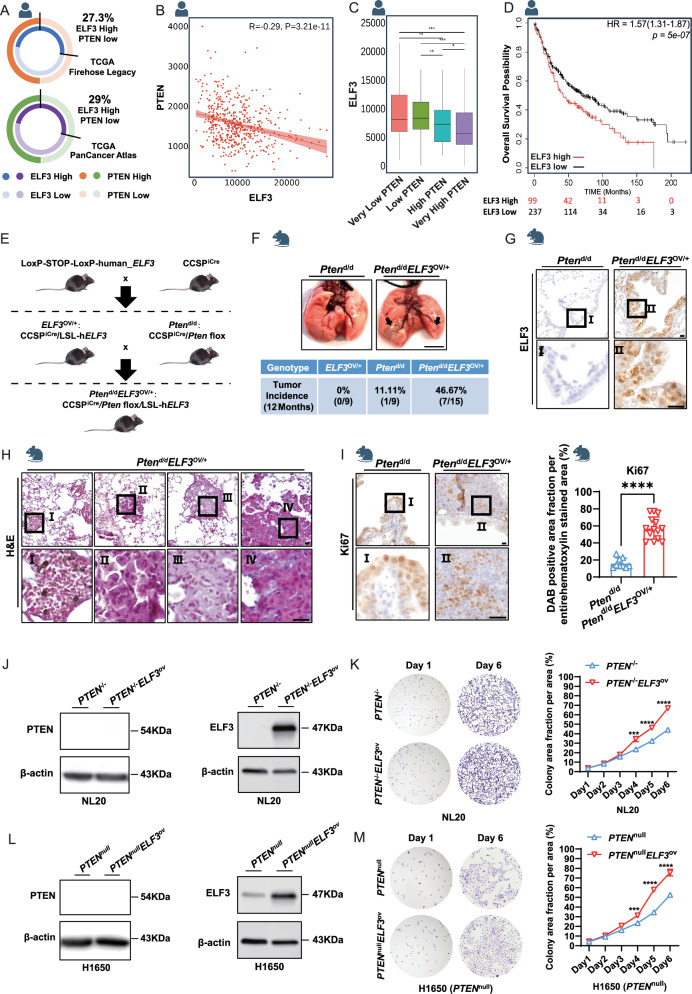
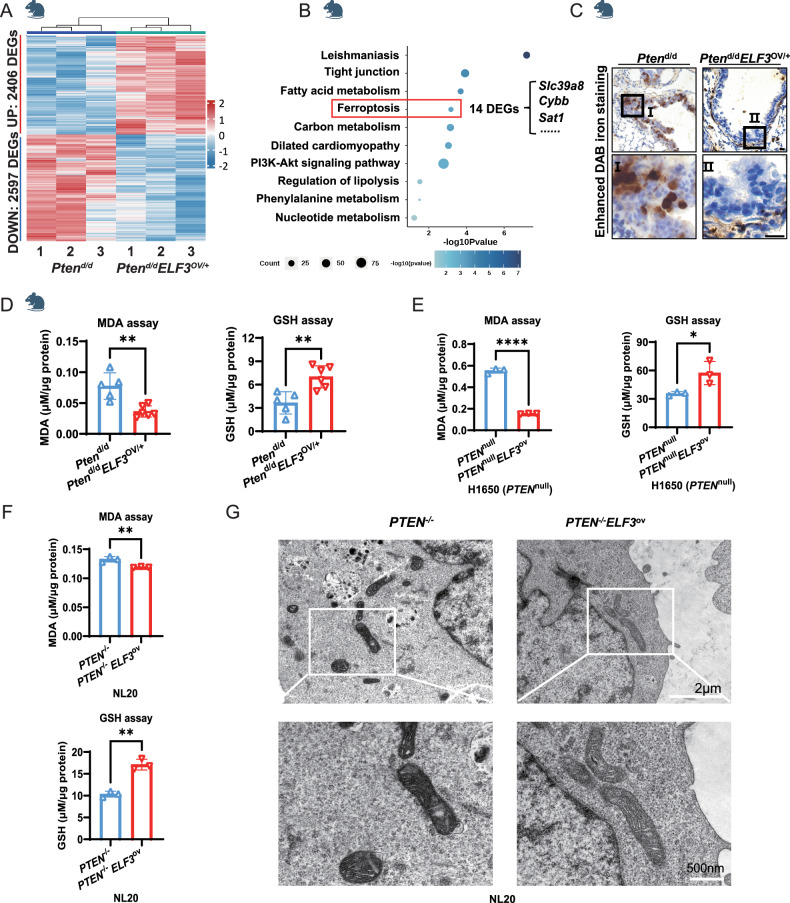
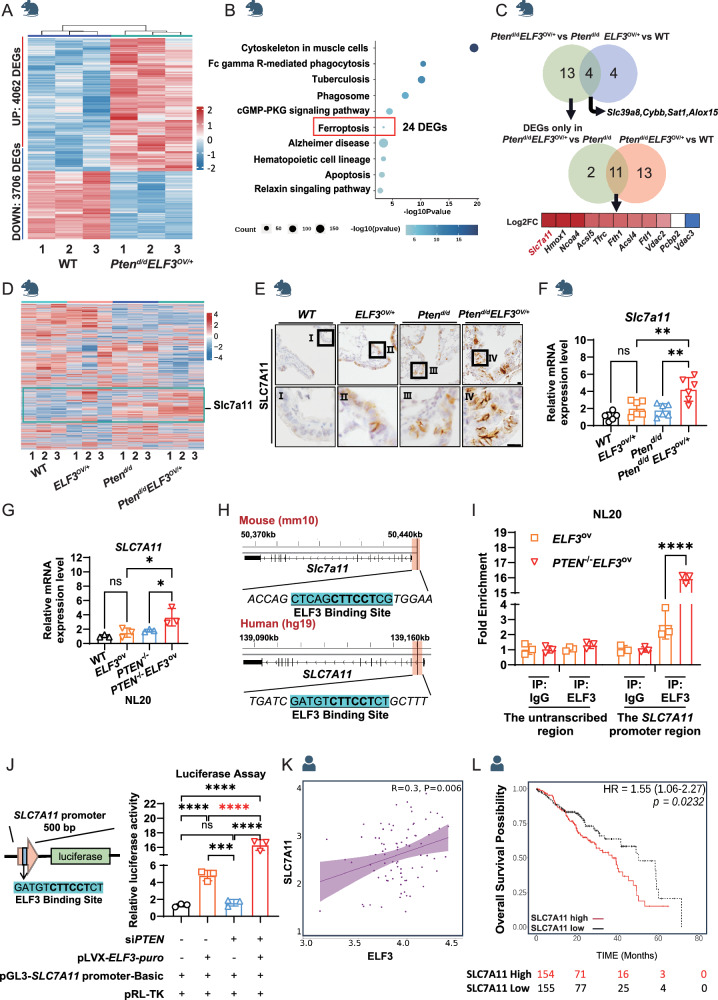
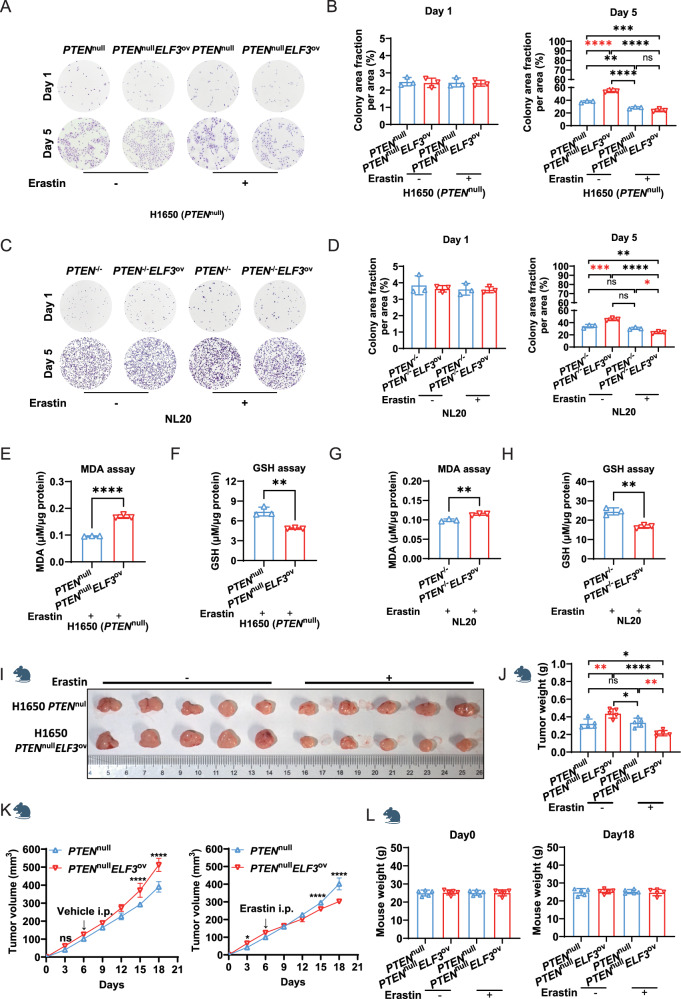
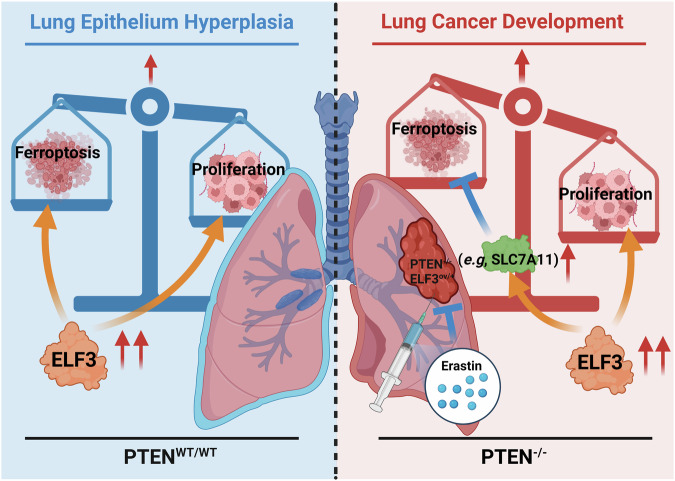
Ferroptosis has been shown to play a crucial role in preventing cancer development, but the underlying mechanisms of dysregulated genes and genetic alternations driving cancer development by regulating ferroptosis remain unclear. Here, we showed that the synergistic role of ELF3 overexpression and PTEN deficiency in driving lung cancer development was highly dependent on the regulation of ferroptosis. Human ELF3 (hELF3) overexpression in murine lung epithelial cells only caused hyperplasia with increased proliferation and ferroptosis. hELF3 overexpression and Pten genetic disruption significantly induced lung tumor development with increased proliferation and inhibited ferroptosis. Mechanistically, we found it was due to the induction of SCL7A11, a typical ferroptosis inhibitor, and ELF3 directly and positively regulated SCL7A11 in the PTEN-deficient background. Erastin-mediated inhibition of SCL7A11 induced ferroptosis in cells with ELF3 overexpression and PTEN deficiency and thus inhibited cell colony formation and tumor development. Clinically, human lung tumors showed a negative correlation between ELF3 and PTEN expression and a positive correlation between ELF3 and SCL7A11 in a subset of human lung tumors with PTEN-low expression. ELF3 and SCL7A11 expression levels were negatively associated with lung cancer patients' survival rates. In summary, ferroptosis induction can effectively attenuate lung tumor development induced by ELF3 overexpression and PTEN downregulation or loss-of-function mutations.


Conflict of interest statement

Competing interests: The authors declare no competing interests. Ethics approval: All methods were performed in accordance with the relevant guidelines and regulations. All animal experiments were approved by the Biomedical Research Ethics Committee, Zhejiang University, China. Reference Number: 13888. Consent to publish: Informed consent was obtained from all participants.

Figures

Fig. 1
Fig. 1. Overexpression of ELF3 in human and murine lung epithelium promotes cell proliferation and hyperplasia.
A ELF3 expression levels across various cancer types and corresponding adjust normal tissues in TCGA (PMID: 32442275). B The correlation between ELF3 expression levels and overall survival in lung cancer patients (PMID: 37783508). The numbers below the graph are the numbers of patients. C, D Strategy for constructing a mouse model (ELF3OV/+) with overexpression of human ELF3 in mouse lung epithelial cells. E Comparative analysis of hELF3 expression levels in lung tissues of WT and ELF3OV/+ mice through IHC staining. Scale bar, 10 μm. F Statistical analysis of lung tissue phenotypes in WT (n = 10) and ELF3OV/+ (n = 9) mice based on appearance and H&E staining. The scale bar of lung tissues represents 0.5 cm, of H&E represents 10 μm. G Comparative analysis of Ki67 expression levels in lung tissues of WT (n = 8) and ELF3OV/+ (n = 9) through IHC staining, followed by quantitative analysis of Ki67-positive staining using ImageJ. Statistical comparisons were performed using the Unpaired t-test, * p < 0.05, **p < 0.01, ***p < 0.001. Error bars represent the SEM. Scale bar, 10 μm. H RT-qPCR and WB detected expression levels of ELF3 in NL20 WT and ELF3ov cells. The 2−ΔΔCt method was used to determine the relative expression levels of ELF3 mRNA. n = 3 (three independent experiments). Statistical comparisons were performed using the Unpaired t-test, *p < 0.05, **p < 0.01, ***p < 0.001. Error bars represent the SEM. I Detection of differences in cell proliferation capacity after overexpression of ELF3 in NL20 cells using cell colony formation assay. n = 3 (three independent experiments). Statistical comparisons were performed using the 2-way ANOVA, *p < 0.05, **p < 0.01, ***p < 0.001. Error bars represent the SEM.
Fig. 2
Fig. 2. Overexpression of ELF3 in human and murine lung epithelium induces ferroptosis.
A Transcriptomic analysis of lung tissues from WT (n = 3) and ELF3OV/+ (n = 3). DEGs represent the differentially expressed genes from ELF3OV/+ vs WT. B Conducting pathway enrichment analysis of DEGs from ELF3OV/+ vs WT by KEGG. C Gene expression levels of Slc39a8, Cybb, and Sat1 in mouse lung tissue samples were detected by RT-qPCR. The 2−ΔΔCt method was used to determine the relative expression levels of Slc39a8, Cybb and Sat1 mRNA. n = 3 (three independent experiments). Statistical comparisons were performed using the Unpaired t-test, *p < 0.05, **p < 0.01, ***p < 0.001. Error bars represent the SEM. D Comparing the expression levels of iron ions in lung tissues between WT and ELF3OV/+ mice using Prussian blue staining. Scale bar, 10 μm. Detecting the content of MDA (E) and GSH (F) in lung tissues of WT (n = 6) and ELF3OV/+ (n = 6) mice, μM/μg protein represents the level of MDA/GSH. Statistical comparisons were performed using the Unpaired t-test, *p < 0.05, **p < 0.01, ***p < 0.001. Error bars represent the SEM. Detecting the content of MDA (G) and GSH (H) in NL20 cells of WT and ELF3ov/+, μM/μg protein represents the level of MDA/GSH. n = 3 (three independent experiments). Statistical comparisons were performed using the Unpaired t-test, *p < 0.05, **p < 0.01, ***p < 0.001. Error bars represent the SEM. (I) The TEM captures mitochondria in NL20 WT and ELF3ov/+ cell lines. The scale bar above is 2 μm, and the below one is 500 nm.
Fig. 3
Fig. 3. Overexpression of ELF3 under the PTEN-deficient Human and Murine Lung Epithelium Promotes Lung Cancer Development.
A The percentage of lung cancer patients with ELF3 overexpression and PTEN low or deficient in two databases (n = 586 and 566, respectively). B The correlation between ELF3 and PTEN at the mRNA level based on lung cancer patients’ data (PMID: 29625048). C The ELF3 expression in different groups of lung cancer patients with diverse PTEN expression levels (PMID: 29625048). D The correlation between ELF3 levels and overall survival in lung cancer patients with low PTEN expression (PMID: 29625048). E Strategy for constructing a mouse model (Ptend/dELF3OV/+) with deletion of Pten and overexpression of hELF3 in lung epithelial cells. F Lung cancer incidence in 12-month-old Ptend/d (n = 9) and Ptend/dELF3OV/+ (n = 15) mice based on appearance and H&E staining. Scale bar, 0.5 cm. G Comparative analysis of hELF3 expression levels in lung tissues of Ptend/d and Ptend/dELF3OV/+ mice through IHC staining. Scale bar, 10 μm. H Analysis of the morphological characteristics of lung tumors in Ptend/dELF3OV/+ mice through H&E staining. Scale bar, 10 μm. I Comparative analysis of Ki67 expression levels in lung tissues of Ptend/d (n = 9) and Ptend/dELF3OV/+ (n = 14) mice through IHC staining, followed by quantitative analysis of Ki67-positive staining using ImageJ. Statistical comparisons were performed using the Unpaired t-test, *p < 0.05, **p < 0.01, ***p < 0.001. Error bars represent the SEM. Scale bar, 10 μm. J Expression levels of PTEN and ELF3 in NL20 PTEN−/− and PTEN−/−ELF3ov cells were detected by WB. n = 3 (three independent experiments). K Detection of differences in cell proliferation capacity of NL20 PTEN−/− and PTEN−/−ELF3ov cells using cell colony formation assay. n = 3 (three independent experiments). Statistical comparisons were performed using the 2-way ANOVA, *p < 0.05, **p < 0.01, ***p < 0.001. Error bars represent the SEM. L Expression levels of PTEN and ELF3 in H1650 PTENnull and PTENnullELF3ov cells were detected by WB. n = 3 (three independent experiments). M Detection of differences in cell proliferation capacity of H1650 PTENnull and PTENnullELF3ov cells using cell colony formation assay. n = 3 (three independent experiments). Statistical comparisons were performed using the 2-way ANOVA, *p < 0.05, **p < 0.01, ***p < 0.001. Error bars represent the SEM.
Fig. 4
Fig. 4. Overexpression of ELF3 in PTEN-deficient human and murine lung epithelium inhibits ferroptosis.
A Transcriptomic analysis of lung tissues from Ptend/d (n = 3) and Ptend/dELF3OV/+ (n = 3). DEGs represent the differentially expressed genes from Ptend/dELF3OV/+ vs Ptend/d. B Conducting pathway enrichment analysis of DEGs from Ptend/dELF3OV/+ vs Ptend/d by KEGG. C Comparing the expression levels of iron ions in lung tissues between Ptend/d and Ptend/dELF3OV/+ mice using Prussian blue staining. Scale bar, 10 μm. D Detecting the content of MDA (left) and GSH (right) in lung tissues of Ptend/d (n = 5) and Ptend/dELF3OV/+ (n = 6) mice, μM/μg protein represents the level of MDA/GSH. Statistical comparisons were performed using the Unpaired t-test, *p < 0.05, **p < 0.01, ***p < 0.001. Error bars represent the SEM. E Detecting the content of MDA (left) and GSH (right) in H1650 PTENnull and PTENnullELF3ov cells, μM/μg protein represents the level of MDA/GSH. n = 3 (three independent experiments). Statistical comparisons were performed using the Unpaired t-test, *p < 0.05, ** p < 0.01, ***p < 0.001. Error bars represent the SEM. F Detecting the content of MDA (upper) and GSH (lower) in NL20 PTEN−/− and PTEN−/−ELF3ov cells, μM/μg protein represents the level of MDA/GSH. n = 3 (three independent experiments). Statistical comparisons were performed using the Unpaired t-test, *p < 0.05, **p < 0.01, ***p < 0.001. Error bars represent the SEM. G The TEM captures of mitochondria in NL20 PTEN−/− and PTEN−/−ELF3ov cell lines. The scale bar above is 2 μm, and the below one is 500 nm.
Fig. 5
Fig. 5. Overexpression of ELF3 in PTEN-deficient Human and Murine Lung Epithelium Induces the Expression of Ferroptosis Inhibitor SLC7A11.
A Transcriptomic analysis of lung tissues from WT (n = 3) and Ptend/dELF3OV/+ (n = 3). DEGs represent the differentially expressed genes from Ptend/dELF3OV/+ vs WT. B Conducting pathway enrichment analysis of DEGs from Ptend/dELF3OV/+ vs WT by KEGG. C Venn diagrams indicate the strategy to select DEGs related to tumorigenesis and inhibition of ferroptosis from three groups, Ptend/dELF3OV/+ vs WT, Ptend/dELF3OV/+ vs WT and Ptend/dELF3OV/+ vs WT. D Joint analysis of 4 groups of transcriptomic data of mouse models, showing the expression profiling of all genes in 4 groups (12 samples), Wild-type, ELF3OV/+, Ptend/d and Ptend/dELF3OV/+. E, F Comparative analysis of SLC7A11 expression levels in lung tissues of WT, ELF3OV/+, Ptend/d and Ptend/dELF3OV/+ mice through IHC staining and RT-qPCR. The 2−ΔΔCt method was used to determine the relative expression levels of Slc7a11 mRNA. n = 3 (three independent experiments). Statistical comparisons were performed using the one-way ANOVA, *p < 0.05, **p < 0.01, ***p < 0.001. G Expression levels of SLC7A11 in NL20 PTEN−/− and PTEN−/−ELF3ov cells were detected by RT-qPCR and WB. The 2−ΔΔCt method was used to determine the relative expression levels of SLC7A11 mRNA. n = 3 (three independent experiments). Statistical comparisons were performed using the Unpaired t-test, *p < 0.05, **p < 0.01, ***p < 0.001. Error bars represent the SEM. H ELF3 motif is detected at the promoter region of SLC7A11. I, J Left: Verification of the binding frequency of ELF3 at the SLC7A11 promoter region through ChIP-qPCR. Right: Detecting the regulatory relationship between ELF3 and SLC7A11 through dual-luciferase reporter gene assay. K The correlation between ELF3 and SLC7A11 expression in lung cancer patients with low PTEN expression (PMID: 29625048). L The correlation between SLC7A11 expression levels and overall survival in lung cancer patients with low PTEN expression and high expression of ELF3 (PMID: 29625048).
Fig. 6
Fig. 6. Erastin, targeting SLC7A11, significantly induces ferroptosis of lung cancer cells with ELF3 overexpression and PTEN-deficient background.
A Cell proliferation capacity of H1650 PTENnull and PTENnullELF3ov cells after erastin treatment measured using cell colony formation assay. n = 3 (three independent experiments). B Quantitative analysis of cell colony formation of H1650 PTENnull and PTENnullELF3ov cells treated with erastin on the first and fifth days using ImageJ. Statistical comparisons were performed using the 2-way ANOVA, *p < 0.05, **p < 0.01, ***p < 0.001. Error bars represent the SEM. C Cell proliferation capacity of NL20 PTEN−/− and PTEN−/−ELF3ov cells after erastin treatment using cell colony formation assay. n = 3 (three independent experiments). D Quantitative analysis of cell colony formation of NL20 PTEN−/− and PTEN−/−ELF3ov cells treated with erastin on the first and fifth days using ImageJ. Statistical comparisons were performed using the 2-way ANOVA, *p < 0.05, **p < 0.01, ***p < 0.001. Error bars represent the SEM. MDA (E) and GSH (F) assays of H1650 PTENnull and PTENnullELF3ov cells after five days of erastin treatment. μM/μg protein represents the level of MDA/GSH. n = 3 (three independent experiments). Statistical comparisons were performed using the Unpaired t-test, *p < 0.05, **p < 0.01, ***p < 0.001. Error bars represent the SEM. MDA (G) and GSH (H) assays in NL20 PTEN−/− and PTEN−/−ELF3ov cells after five days of erastin treatment. μM/μg protein represents the level of MDA/GSH. n = 3 (three independent experiments). Statistical comparisons were performed using the Unpaired t-test, *p < 0.05, **p < 0.01, ***p < 0.001. Error bars represent the SEM. IL The volume of the xenograft tumors was measured and quantified. Each group consists of five nude mice (n = 5). Statistical comparisons were performed using the 1-way & 2-way ANOVA, *p < 0.05, **p < 0.01, ***p < 0.001. Error bars represent the SEM.
Fig. 7
Fig. 7. The working model of this study.
ELF3 overexpression promoted proliferation and ferroptosis at the same time; thus, the induced ferroptosis likely formed a barrier to constrain these hyperplastic lung epithelia from being transformed into lung tumors (Fig. 7 left); ELF3 overexpression in the Pten deletion mouse lung epithelium significantly promoted lung tumor developments by inhibiting ferroptosis while remaining the proliferation-promoting effect (Fig. 7 right). Mechanistically, this effect is largely dependent on the induced expression of SLC7A11, a typical inhibitor of ferroptosis, in mouse lungs and human lung epithelial cells and cancer cells (Fig. 7 right). Importantly, targeting SLC7A11 using its inhibitor, erastin, showed obvious inhibition of the colony formation of lung cancer cells and cancer development with ELF3 overexpression and PTEN deficiency by inducing ferroptosis.

References

    1. Leiter A, Veluswamy RR, Wisnivesky JP. The global burden of lung cancer: current status and future trends. Nat Rev Clin Oncol. 2023;20:624–39. - PubMed
    1. Brea E, Rotow J. Targeted therapy for non-small cell lung cancer first line and beyond. Hematol Oncol Clin N. 2023;37:575–94. - PubMed
    1. McFadden DG, Politi K, Bhutkar A, Chen FK, Song XL, Pirun M, et al. Mutational landscape of EGFR-, MYC-, and Kras-driven genetically engineered mouse models of lung adenocarcinoma. Proc Natl Acad Sci USA. 2016;113:E6409–E17. - PMC - PubMed
    1. Zhao YC, Li YQ, Zhang RF, Wang F, Wang TJ, Jiao Y. The role of erastin in ferroptosis and its prospects in cancer therapy. Oncotargets Ther. 2020;13:5429–41. - PMC - PubMed
    1. Liu J, Cho SN, Akkanti B, Jin NL, Mao JQ, Long WW, et al. ErbB2 pathway activation upon loss promotes lung tumor growth and metastasis. Cell Rep. 2015;10:1599–613. - PMC - PubMed

MeSH terms