. 2024 Dec 18;15(1):10482.
doi: 10.1038/s41467-024-54843-5.

Collagen signaling and matrix stiffness regulate multipotency in glandular epithelial stem cells in mice

Affiliations

Collagen signaling and matrix stiffness regulate multipotency in glandular epithelial stem cells in mice

Chen Jiang et al. Nat Commun. .

Abstract

Glandular epithelia, including mammary gland (MG) and prostate, are composed of luminal and basal cells. During embryonic development, glandular epithelia arise from multipotent stem cells (SCs) that are replaced after birth by unipotent basal and unipotent luminal SCs. Different conditions, such as basal cell transplantation, luminal cell ablation, and oncogene expression can reinduce adult basal SC (BaSCs) multipotency in different glandular epithelia. The mechanisms regulating the reactivation of multipotency are incompletely understood. Here, we have found that Collagen I expression is commonly upregulated in BaSCs across the different multipotent conditions. Increasing collagen concentration or stiffness of the extracellular matrix (ECM) promotes BaSC multipotency in MG and prostate organoids. Single cell RNA-seq of MG organoids in stiff conditions have uncovered the importance of β1 integrin/FAK/AP-1 axis in the regulation of BaSC multipotency. Altogether our study uncovers the key role of Collagen signaling and ECM stiffness in the regulation of multipotency in glandular epithelia.


Conflict of interest statement

Competing interests: The authors declare no competing interests.

Figures
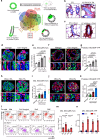
Fig. 1
Fig. 1. Collagen 1 and ECM stiffness promotes BaSC multipotency in MG and the prostate.
a Venn diagram illustrating the genes upregulated in the 5 multipotent conditions as indicated in MG and the prostate. The intersection shows that Col1a1, Col1a2, and Col3a1 are commonly upregulated. Immunohistochemistry of COL1A1 in control (CTL) and K5CreER/PIK3CA mice 7 months after TAM administration (b) and CTL (no dox) and K5CreER/Rosa-tdTomato/K8rtTA/TetO-DTA mice 1 week after Dox administration (c). n = 3 mice. Confocal imaging of immunostaining of MG organoid from K5CreER/td-Tomato mice in Matrigel and Col1 4 mg/ml gel (d) and in PEG 2.5% + RGD and PEG 7% + RGD conditions 1 week after TAM administration (h). tdTomato (TOM) in red, K8 in green, Hoechst in blue. Arrows indicate multipotent cells (TOM + K8+). Scale bars, 10 μm. Quantification of TOM + K8+ cells on total K8+cells at different Col1 gel (e) and PEG gel (i). n = 4 experiments (Matrigel and Col1 4 mg/ml), n = 3 experiments (Col1 2 mg/ml and 8 mg/ml), n = 5 experiments (PEG gel). Representative images of immunostaining of the prostate organoid derived from K5CreER-YFP mice in Matrigel and Col1 4 mg/ml gel (f) and in PEG 2% + RGD and PEG 9% + RGD gels (j) 5 days after TAM administration using anti-GFP (green) and anti-K8 (Red) antibodies. Hoechst in blue. Arrows indicate multipotent cells (YFP + K8+). Scale bar, 10 μm. Quantification of K8 + YFP+ cells on total K8+cells in different Col1 gel (g) and PEG gel (k). n = 4 experiments. l Representative FACS plot of K5 and K8 expression of MG organoids derived from K5CreER/td-Tomato mice at different conditions 1 week after TAM administration. m FACS quantification of TOM+ LCs on total LCs in MG organoids. n = 7 experiments. p-values are derived from two-sided unpaired t-test. n FACS quantification of YFP+ LCs on total LCs and YFP+ BCs on total BCs in MG organoids derived from K8CreER-YFP mice at different conditions 1 week after TAM administration. n = 5 experiments. Graphs are mean ± s.e.m. For (e, g, i, and k), p-values are derived from one-way ANOVA followed by Tukey’s test. Source data are provided as a Source Data file.
Fig. 2
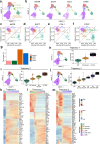
Fig. 2. Single-cell RNA sequencing shows an increase of hybrid state in MG organoid embedded in Collagen 1 and stiff matrix.
UMAP dimensionality reduction plots with different colors representing unsupervised clustering: Integrated data using Seurat (a) and the plot of integrated data split by different conditions as indicated (b). HY stands for hybrid and Pr stands for proliferating cells. Integration of data did not bring an over-correction of the data or disappearance of certain population. Quantitative assessment of LC and BC marker gene expression in MATR (c), SOFT (d), COL1 (e), and STIFF (f) condition: Scatterplot with the x-axis representing the adjusted proportion of BC-specific marker genes and the y-axis representing the adjusted proportion of LC-specific markers. The proportion of cells which express more than 65% (0.65) of BC and LC markers is indicated as red square. g Quantification of cells in each data considered as hybrid status, indicated as red square on 2 (cf). Slingshot pseudotime trajectory analysis: UMAP dimensionality reduction plots of integrated data for the trajectory and quantification of pseudotime as violin plot composed of trajectory 1: BC – BC Primed – LC ER+ (h), trajectory 2: BC – BC Primed – HY BC/ER- – LC ER- (i) and trajectory 3: BC – BC Primed – HY BC/ER- – LC ER- – HY ER+/ER- – LC ER+ (j). BC primed indicates BC primed LC differentiation cluster. Triangle indicates start of trajectory and square indicates termination of trajectory. Heatmaps illustrate the expression levels of genes that are differentially expressed along the trajectories in the integrated dataset, encompassing marker genes for BC, LC ER+, and LC ER-: trajectory 1 (k), trajectory 2 (l), trajectory 3 (m). Source data are provided as a Source Data file.
Fig. 3
Fig. 3. In situ characterization of hybrid cells.
a Confocal imaging of immunostaining of MG organoid from K5CreER/td-Tomato mice in Matrigel, Soft, Col1, and Stiff gel 1 week after TAM administration using anti-K14 (White) and anti-K8 (Green) antibodies. TOM in red, Hoechst in blue. Arrows indicate hybrid cells (TOM + K14 + K8+) and fully differentiated LCs (TOM + K14− K8+). Scale bars, 10 μm. FACS quantification of TOM+ hybrid (K5 + K8+) on the total cells (b) and TOM+ BCs on the total BCs (c) in MG organoids at different conditions indicated 1 week after TAM administration. n = 7 independent experiments. d Representative images of immunostaining of the organoid derived from K5CreER/td-Tomato mice in Matrigel, Col1, Soft, and Stiff gel 2 days after TAM administration. TOM in red, K8 in green, K14 in white, Hoechst in blue. Arrows indicate hybrid cells (TOM + K14 + K8+). Scale bars, 50 μm. e Representative FACS plot of K5 and K8 expression on TOM+ cells from MG organoids derived from K5CreER/td-Tomato 2 days after TAM administration. MG organoids are embedded in the different gels indicated. BC: K5-high K8-low; LC: K5-low K8-high; Hybrid: K5 + K8+. f Quantification of TOM+ LCs on total LCs, Tom+ Hybrid on total cells, Tom+ BCs on total BCs in MG organoids at different conditions indicated 2 days after TAM administration. n = 3 independent experiments. For (b, c, and f), graphs are mean ± s.e.m. p-values are derived from two-sided unpaired t-test. Source data are provided as a Source Data file.
Fig. 4
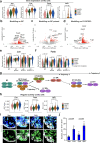
Fig. 4. Identification of genes and TFs associated with BC multipotency in MG organoids embedded in collagen 1 and stiff matrix.
a Violin plots showing the expression level of the genes which were commonly upregulated on BC cells of multipotent conditions (COL1 and STIFF) compared to unipotent conditions (MATR and SOFT). P-values were calculated using the non-parametric Wilcoxon rank sum test (two-sided). Volcano plots showing the results on the linear modeling on the BC (b), BC primed (c), and HY BC/ER- (d) for stiffness-dependent genes. BC primed indicates BC primed LC differentiation cluster. Significant genes on the linear models are marked as red (adjusted P-value < 0.01). P-value were calculated by negative binomial regression, two-sided. Violin plots showing the gene expression level of Jun (e) and Fosb (f) on BC, BC primed, HY BC/ER- cells, and HY BC/ER- proliferating on integrated data, split by different conditions. P-value is from modeling on each cell type to test the correlation between stiffness and gene expression, calculated by negative binomial regression, two-sided. g Schematic representation of the transcription factors (TFs) found as activated by SCENIC leading to BC-to-LC differentiation. Dashed arrow indicates that the lineage trajectory can go further, but not necessarily. h Violin plots showing the regulon activity of Fos, Fosb, and Atf3 on BC, which are more activated on multipotent conditions compared to the unipotent conditions. P-values were calculated using the non-parametric Wilcoxon rank sum test (two-sided) to compare AUC scores. i Representative images of immunostaining of the MG organoid embedded in Matrigel, Col1, Soft, and Stiff gel using anti-K14 (White) anti-Jun (green) antibodies, Hoechst in blue. Scale bars, 50 μm. j Quantification of nuclear Jun+ K14+ on total K14+ in MG organoids embedded in the different gels indicated (mean ± s.e.m.; n = 3 independent experiments). p-values are derived from two-sided unpaired t-test. Source data are provided as a Source Data file.
Fig. 5
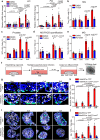
Fig. 5. Integrin-β1/FAK signaling controls collagen and stiffness-induced multipotency in glandular epithelia.
a Quantification of TOM + K8+ cells on the total K8+cells in K5CreER/td-Tomato MG organoids treated for 1 week either with IgG control antibody or with a blocking β1 antibody (HMβ1.1). MG organoids are embedded in the different gels as indicated (n = 4 independent experiments). b Quantification of YFP + K8+ cells on the total K8+cells in K5CreER/Rosa-YFP prostate organoids treated for 5 days either with IgG control antibody or with HMβ1.1 antibody. Prostate organoids are embedded in the different gels as indicated. (n = 3 independent experiments). c Quantification of TOM + K8+ cells on the total K8+cells in K5CreER/td-Tomato MG organoids treated for 1 week with control DMSO, α2β1 inhibitor (BTT 3033) at 5 μM, or FAK inhibitor (PF573228) at 10 μM. MG organoids are embedded in the different gels indicated (n = 4 independent experiments). d Quantification of YFP + K8+ cells on the total K8+cells in K5CreER/RosaYFP prostate organoids treated for 5 days with control DMSO, BTT 3033 at 2 μM, or PF573228 at 10 μM. Prostate organoids are embedded in the different gels as indicated. (n = 4 independent experiments). e Experimental design. f Representative images of YFP fluorescence of MG fat pad after DMSO and FAK inhibitor (FAKi, PF573228) treatment 8 weeks (Biweekly i.p. injection, 10 mg/kg). Scale bars, 1 mm. g Quantification of YFP+ transplantation in all transplantation. n = 16 transplantation in DMSO group, n = 18 transplantation in FAKi group. h Representative images of immunostaining of the transplanted fat pad using anti-K14 (White), anti-GFP (green), and anti-K8 (Red) antibodies. Hoechst in blue. Scale bars, 20 μm. n = 3 transplanted glands. For (ad), graphs are mean ± s.e.m. p-values are derived from two-sided unpaired t-test. Source data are provided as a Source Data file.
Fig. 6
Fig. 6. Integrin-β1/FAK/AP-1 axis controls collagen and stiffness-induced multipotency in glandular epithelia.
a MG organoids treated for 1 week with control DMSO, α2β1 inhibitor (BTT 3033) at 5 μM, or FAK inhibitor (PF573228) at 10 μM. Relative mRNA expression levels of Jun and Fos were determined by quantitative RT-PCR. MG organoids are embedded in the different gels as indicated. n = 4 independent experiments. b Quantification of TOM + K8+ cells on total K8+ cells in K5CreER/td-Tomato MG organoids treated for 1 week with DMSO control and AP1 inhibitor (T-5224) at 10 μM. n = 3 independent experiments. c Quantification of YFP + K8+ cells on total K8+cells in K5CreER-YFP prostate organoids treated for 5 days with DMSO control and T-5224 at 10 μM. n = 3 independent experiments. d FACS quantification of TOM+ LCs on total LCs in K5CreER/td-Tomato MG organoids treated for 1 week with DMSO control and T-5224 at 10 μM. n = 5 independent experiments. e Quantification of TOM + K8+ cells on total K8+ cells in K5CreER/td-Tomato MG organoids treated for 1 week with DMSO and CDK inhibitor (RO-3306) at 10 μM. n = 3 independent experiments. f Experimental design. g Representative images of immunostaining of Ade-K5Cre infected MG organoid derived from Rosa-YFP and Junbfl/fl/Juncfl/fl /mTmG mice using anti-Jun (white) and anti-GFP (green). Hoechst in blue. Arrows indicate nuclear Jun+ YFP+ cells. Scale bars, 20 μm. h Quantification of nuclear Jun+ YFP+ cells on total YFP+ cells in Ade-K5Cre infected MG organoids from Rosa-YFP and Junbfl/fl/Juncfl/fl /mTmG mouse. n = 3 independent experiments. i Representative images of immunostaining of Ade-K5Cre infected MG organoid derived from Rosa-YFP and Junbfl/fl/Juncfl/fl /mTmG mice using anti-K8 (White) and anti-GFP (green). Hoechst in blue. Arrows indicate multipotent cells (YFP + K8+). Scale bars, 50 μm. j Quantification of YFP + K8+ cells on total K8+ cells in Ade-K5Cre infected MG organoids from Rosa-YFP and Junbfl/fl/Juncfl/fl /mTmG mice. n = 3 independent experiments. Graphs are mean ± s.e.m. Organoids are embedded in the different gels as indicated. For (a, h, and j), p-values are derived from one-way ANOVA followed by Tukey’s test. For (be), p-values are derived from two-sided unpaired t-test. Source data are provided as a Source Data file.

References

    1. Toivanen, R. & Shen, M. M. Prostate organogenesis: tissue induction, hormonal regulation and cell type specification. Development144, 1382–1398 (2017). - PMC - PubMed
    1. Lloyd-Lewis, B., Harris, O. B., Watson, C. J. & Davis, F. M. Mammary stem cells: premise, properties, and perspectives. Trends Cell Biol.27, 556–567 (2017). - PubMed
    1. Ousset, M. et al. Multipotent and unipotent progenitors contribute to prostate postnatal development. Nat. Cell Biol.14, 1131–1138 (2012). - PubMed
    1. Van Keymeulen, A. et al. Distinct stem cells contribute to mammary gland development and maintenance. Nature479, 189–193 (2011). - PubMed
    1. Wuidart, A. et al. Quantitative lineage tracing strategies to resolve multipotency in tissue-specific stem cells. Genes Dev.30, 1261–1277 (2016). - PMC - PubMed

Publication types

MeSH terms

Associated data