. 2024 Dec 18;15(1):10694.
doi: 10.1038/s41467-024-54206-0.

Structural mechanism of CB1R binding to peripheral and biased inverse agonists

Affiliations

Structural mechanism of CB1R binding to peripheral and biased inverse agonists

Punita Kumari et al. Nat Commun. .

Abstract

The cannabinoid receptor 1 (CB1R) regulates synaptic transmission in the central nervous system, but also has important roles in the peripheral organs controlling cellular metabolism. While earlier generations of brain penetrant CB1R antagonists advanced to the clinic for their effective treatment of obesity, such molecules were ultimately shown to exhibit negative effects on central reward pathways that thwarted their further therapeutic development. The peripherally restricted CB1R inverse agonists MRI-1867 and MRI-1891 represent a new generation of compounds that retain the metabolic benefits of CB1R inhibitors while sparing the negative psychiatric effects. To understand the mechanism of binding and inhibition of CB1R by peripherally restricted antagonists, we developed a nanobody/fusion protein strategy for high-resolution cryo-EM structure determination of the GPCR inactive state, and used this method to determine structures of CB1R bound to either MRI-1867 or MRI-1891. These structures reveal how these compounds retain high affinity and specificity for CB1R's hydrophobic orthosteric site despite incorporating polar functionalities that lead to peripheral restriction. Further, the structure of the MRI-1891 complex along with accompanying molecular dynamics simulations shows how differential engagement with transmembrane helices and the proximal N-terminus can propagate through the receptor to contribute to biased inhibition of β-arrestin signaling.


Conflict of interest statement

Competing interests: The authors declare no competing interests.

Figures
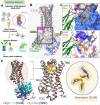
Fig. 1
Fig. 1. Nanobody selection and cryo-EM structure of CB1R inactive state.
A Schematic of nanobody selection process. Yeast displaying nanobodies were incubated with purified CB1R-PGS. Specific binders were enriched using iterative rounds of MACS and FACS selection. B Cryo-EM structure of taranabant bound CB1R-CNb36 complex. CB1R is depicted in gray, PGS in blue, and CNb36 in green, with an inset emphasizing the CDRs of the nanobody. CDR1 is illustrated in green, CDR2 is pink, and CDR3 is yellow. C Zoomed-in view of the CDRs contacting CB1R (gray surface) and PGS (blue surface). D View of the interaction between the CDRs and CB1R-PGS colored according to electrostatic surface potential. E Superposition of the crystal structure of CB1R-PGS with taranabant (PDB: 5U09) and the cryo-EM structure of CB1R-PGS bound to taranabant (PDB: 9B9Y), using the receptor Cα positions. The overlay show high similarity of the receptors, despite a 64° rotation of the PGS domain (blue in the cryo-EM structure, cyan in the crystal structure). Taranabant binding (right) is almost identical between the cryo-EM structure (yellow sticks) and the crystal structure (brown sticks).
Fig. 2
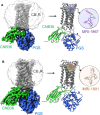
Fig. 2. Structures of CB1R-PGS/CNB36 with peripheral inverse agonists.
A Cryo-EM reconstruction of CB1R-PGS/CNB36 complex bound to MRI-1867. Cryo-EM density was rendered in ChimeraX as colored surfaces (contoured at 4 sigma). CB1R density is shown in gray, CNb36 is green, and PGS is blue. The corresponding model is displayed as a cartoon with MRI-1867 shown as purple spheres. The inset shows MRI-1867 as sticks in density. B Cryo-EM reconstruction of CB1R-PGS/CNB36 complex bound to MRI-1891. Cryo-EM density was rendered in ChimeraX as colored surfaces (contoured at 4 sigma). CB1R density is shown in gray, CNb36 is green, and PGS is blue. The corresponding model is displayed as a cartoon with MRI-1891 shown as orange spheres. The inset shows MRI-1867 as sticks in density.
Fig. 3
Fig. 3. Interactions of CB1R with peripheral inverse agonists.
A Structural overlay of CB1R bound to MRI-1891 and MRI-1867. Receptor is shown as a gray cartoon. The two MRI compounds are displayed as sticks, with MRI-1891 in orange and MRI-1867 in purple. The inset shows a rotated extracellular view of the ligands binding to the receptor. B Detailed interactions between MRI-1891 and CB1R. Contact residues within 4 Å of MRI-1891 (orange sticks) are shown as gray sticks. C Detailed interactions between MRI-1867 and CB1R. Contact residues within 4 Å of MRI-1867 (purple sticks) are shown as gray sticks.
Fig. 4
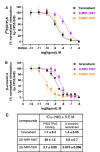
Fig. 4. Signaling properties of CB1R inhibitors.
A Inhibition of CB1R agonist(CP55,940)-induced [35S]GTPγS binding in hCB1R-CHO-K1 cell membranes (Revvity, ES-110-M400UA). Taranabant curves are black, (S)-MRI-1867 curves are purple, and (S)-MRI-1891 curves are orange. Values represent mean ± s.e.m from n = 4 independent experiments, each done in triplicate. Source data are provided with this manuscript as Source Data file. B Inhibition of CB1R agonist(CP55,940)-induced β-arrestin-2 recruitment in PathHunter eXpress CNR1 CHO-K1 β-arrestin-2 assay (DiscoverX, 93 − 0959E2CP0M). Taranabant curves are black, (S)-MRI-1867 curves are purple, and (S)-MRI-1891 curves are orange. For (S)-MRI-1867, values represent mean ± s.e.m from n = 4 independent experiments, each done in triplicate. For taranabant and (S)-MRI-1891, values represent mean ± s.e.m from n = 3 independent experiments, each done in triplicate. Source data are provided with this manuscript as Source Data file. C Inhibitory concentration (IC50) of cannabinoid receptor antagonists, derived from A and B. Data are expressed as a percentage of mean specific binding ± s.e.m.
Fig. 5
Fig. 5. Comparative dynamics of CB1R bound to MRI-1891, MRI-1867, and taranabant.
A Intracellular view of CB1R (left panel); same orientation as panels B-E; side view (right). Transmembrane helices (TM; black) and intracellular loops (ICL; red) are numbered. The comparative analysis focuses on the intracellular side of the receptor (orange). B Intracellular surface topography. On average, the crevice formed by the convergence of TM 3, TM 5, and TM 6 (arrow A) is narrower for taranabant than for MRI-1891 or MRI-1867. This crevice expands upon receptor activation as ICL3 moves away from the core (indicated by the green arrow). Along with the adjacent central crevice (arrow B), it accommodates the α5 helix of Gα and two loops of the central crest of β-arrestin. C Changes in local side chain flexibility mapped as heatmaps on the molecular surface (cf. scale at the bottom of panel F; flexibility of ICL3 and tethered portions of the helices not shown). Significant differences are observed at the confluence of TM1, ICL2, TM7, and H8 (white arrow), where one of the β-arrestin loops docks. D Conformational substates on the intracellular side. As shown in panel C, major differences are observed in the TM1-ICL2-TM7-H8 region (white arrow). E H-bond interaction networks on the intracellular side of the receptor. Some of the structural and dynamic changes in the intracellular crevice are correlated to the disruption of the salt bridge between D338 (TM6) and R214 (TM3); R214 is part of the conserved DRY motif. F Details of the DRY interactions. G Schematic representation of polar (primarily H-bond) and nonpolar (including hydrophobic) ligand-receptor interactions; each star represents one or more interactions (Supplementary Fig. 6A).
Fig. 6
Fig. 6. Overlap of MRI-1891 and taranabant bound in the CB1R orthosteric pocket.
Superposition is based on all receptor Cα positions (rmsd 0.6 Å). The MRI-1891 inverse agonist and selected sidechains from its complex are shown as orange sticks. Superimposed structure of taranabant and the same sidechains in its complex are shown as transparent gray sticks. Dotted line indicates base of the orthosteric pocket.

References

    1. Kendall, D. A. & Yudowski, G. A. Cannabinoid receptors in the central nervous system: their signaling and roles in disease. Front Cell Neurosci.10, 294 (2016). - PMC - PubMed
    1. Mechoulam, R. & Parker, L. A. The endocannabinoid system and the brain. Annu Rev. Psychol.64, 21–47 (2013). - PubMed
    1. Gaoni, Y. & Mechoulam, R. Isolation, structure, and partial synthesis of an active constituent of hashish. J Am Chem Soc. (1964). - PubMed
    1. Mackie, K. Cannabinoid receptors as therapeutic targets. Annu. Rev. Pharmacol. Toxicol.46, 101–122 (2006). - PubMed
    1. Ramesh, K. & Rosenbaum, D. M. Molecular basis for ligand modulation of the cannabinoid CB1 receptor. Br. J. Pharmacol.179, 3487–3495 (2022). - PubMed

Publication types

Substances

LinkOut - more resources