. 2025 Jan;637(8047):955-964.
doi: 10.1038/s41586-024-08318-8. Epub 2024 Dec 18.

Engineered extrachromosomal oncogene amplifications promote tumorigenesis

Affiliations

Engineered extrachromosomal oncogene amplifications promote tumorigenesis

Davide Pradella et al. Nature. 2025 Jan.

Abstract

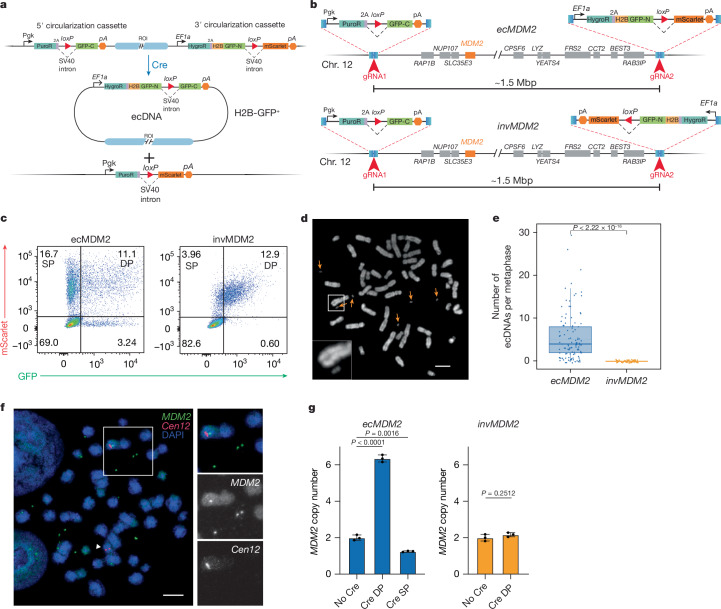
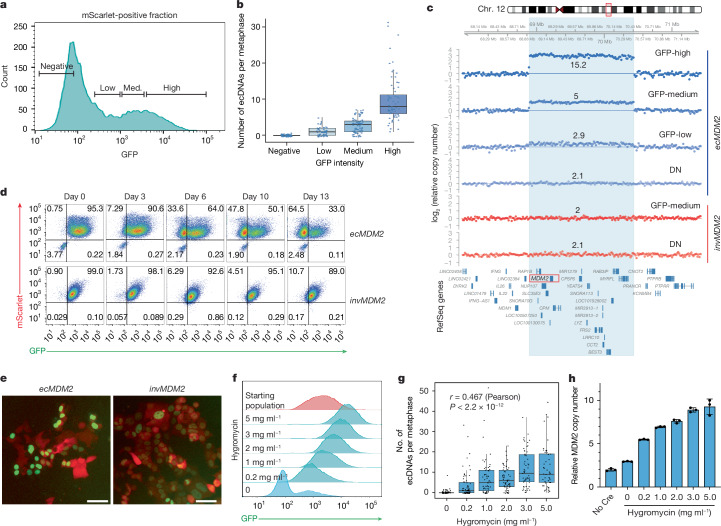
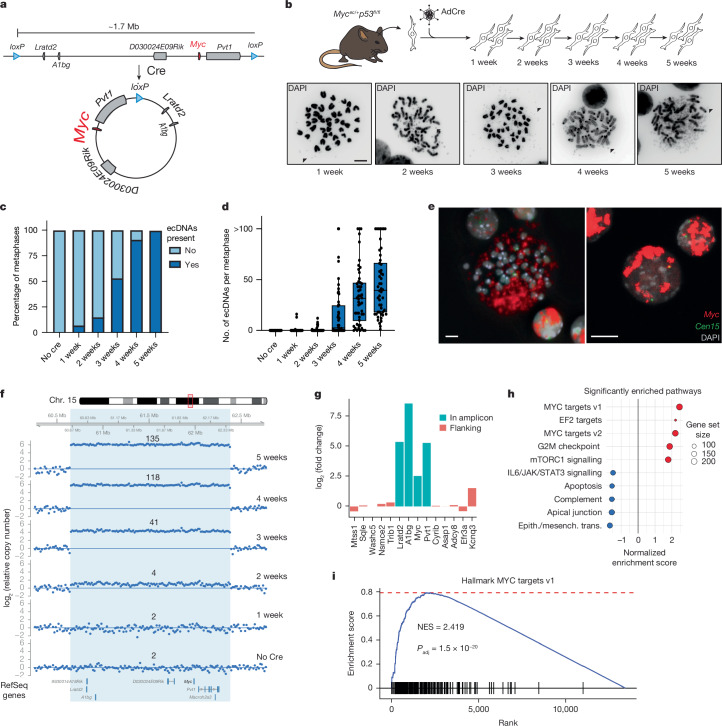
Focal gene amplifications are among the most common cancer-associated mutations1 but have proven challenging to engineer in primary cells and model organisms. Here we describe a general strategy to engineer large (more than 1 Mbp) focal amplifications mediated by extrachromosomal DNAs (ecDNAs)2 in a spatiotemporally controlled manner in cells and in mice. By coupling ecDNA formation with expression of selectable markers, we track the dynamics of ecDNA-containing cells under physiological conditions and in the presence of specific selective pressures. We also apply this approach to generate mice harbouring Cre-inducible Myc- and Mdm2-containing ecDNAs analogous to those occurring in human cancers. We show that the engineered ecDNAs spontaneously accumulate in primary cells derived from these animals, promoting their proliferation, immortalization and transformation. Finally, we demonstrate the ability of Mdm2-containing ecDNAs to promote tumour formation in an autochthonous mouse model of hepatocellular carcinoma. These findings offer insights into the role of ecDNA-mediated gene amplifications in tumorigenesis. We anticipate that this approach will be valuable for investigating further unresolved aspects of ecDNA biology and for developing new preclinical immunocompetent mouse models of human cancers harbouring specific focal gene amplifications.


Conflict of interest statement

Competing interests: H.Y.C. is a cofounder of Accent Therapeutics, Boundless Bio, Cartography Biosciences and Orbital Therapeutics and an advisor for 10x Genomics, Arsenal Biosciences, Chroma Medicine, Exai Bio and Spring Discovery. P.S.M. is a cofounder of, chairs the scientific advisory board of and has equity interest in Boundless Bio. V.B. is a cofounder of, consultant for and SAB member of and has equity interest in Boundless Bio, Inc. and Abterra, Inc. The remaining authors declare no competing interests.

Figures

Fig. 1
Fig. 1. A general strategy for ecDNA engineering.
a, Schematic of the circularization strategy. b, Schematics of the ecMDM2 and invMDM2 alleles generated in HCT116 cells. The circularization cassettes are not drawn to scale. c, Flow cytometry scatter plot of representative ecMDM2 and invMDM2 clones 6 days after AdCre infection. SP, single positive (mScarlet+GFP); DP, double positive (mScarlet+GFP+). d, Metaphase spread obtained from sorted double-positive ecMDM2 cells. Orange arrows indicate double minutes (ecDNAs). Inset shows a magnified ecDNA next to a chromosome. Repeated three times in independent clones. e, Numbers of ecDNAs observed in metaphases from double-positive ecMDM2 and invMDM2 cells (P value: two-tailed Fisher t-test; at least 50 metaphases per genotype were analysed). Boxes indicate upper quartile, median and lower quartile. Whiskers extend to ±1.5 × IQR (interquartile range). f, Representative DNA FISH using MDM2 (green) and Chr12 centromere (red) probes performed on metaphase spreads from double-positive ecMDM2 cells. Numerous MDM2-positive double minutes are observed (insets), with concomitant loss of MDM2 signal from one of the two chromosomes 12 (white arrowhead). Representative of three independent experiments. g, Relative MDM2 copy number determined by qPCR in the different ecMDM2 and invMDM2 cell populations (P values are indicated; analysis of variance for multiple comparison and two-tailed Student’s t-test; n = 3). Error bars indicate mean ± s.d. ROI, region of interest. Scale bars, 5 μm.
Fig. 2
Fig. 2. Dynamics of engineered ecDNAs in HCT116 cells.
a, Double-positive cells from an AdCre-infected ecMDM2 line were cultured in the absence of hygromycin and sorted into four bins on the basis of GFP intensity (negative, low, medium (med.) and high) as indicated. b, Box-and-whiskers plot showing the number of ecDNAs per metaphase in each bin. Box plot represents upper quartile, median and lower quartile. Whiskers extending to ±1.5 × IQR are shown (n = 60, 57, 78 and 68 metaphases). c, ecMDM2 and invMDM2 cells were infected with AdCre, sorted according to mScarlet and GFP intensity, and analysed by sWGS. The panel shows the log2 ratio of relative copy number, as inferred from quantitative DNA sequencing (QDNAseq) analysis, across the region of chromosome 12 surrounding the expected ecDNA (defined by the light blue highlight). The number above each track indicates the amplicon copy number. d, Sorted double-positive cells from AdCre-infected ecMDM2 and invMDM2 clones were cultured in the absence of hygromycin and analysed by flow cytometry at the indicated time points. e, mScarlet and GFP expression in double-positive sorted ecMDM2 (left) and invMDM2 (right) cells maintained in media without hygromycin for 1 week. Independently repeated twice. f, Histogram plot of GFP fluorescence. AdCre-infected and sorted double-positive ecMDM2 cells were expanded for 13 days in medium containing the indicated concentration of hygromycin and analysed by flow cytometry. g, Box-and-whiskers plot showing the number of ecDNAs per metaphase observed in the cells described in e. Boxes indicate upper quartile, median and lower quartile. Whiskers extend to ±1.5 × IQR. Pearson correlation coefficients and associated P values are shown (n = 58, 65, 56, 56, 54 and 51 metaphases). h, MDM2 copy number as determined by genomic qPCR on cells from f. Error bars indicate mean ± s.d. n = 3 technical replicates. Scale bars, 50 μm.
Fig. 3
Fig. 3. Generation of Myc-containing ecDNAs in primary cells from genetically engineered mice.
a, Schematic of the Mycec allele. b, aNSCs derived from Mycec/+p53fl/fl mice were infected with AdCre and propagated in vitro for 5 weeks. Metaphase spreads (lower panels) at different time points were collected, and representative micrographs are shown. Arrowheads indicate double minutes (ecDNAs). c, Bar plot showing the fraction of metaphases with or without ecDNAs. d, Box-and-whiskers plot showing the number of ecDNA per metaphase in Mycec/+p53fl/fl aNSC at different times upon AdCre infection. n = 50 metaphases analysed per condition. Boxes indicate upper quartile, median and lower quartile. Whiskers extend to ±1.5  × IQR. e, Metaphase (left) and interphase FISH (right) performed on aNSCs from Mycec/+p53fl/fl 5 weeks after AdCre infection. The Myc signal is shown in red, and a probe labelling a pericentromeric region of chromosome 15 is shown in green. Representative of two independent experiments. f, sWGS analysis of Mycec/+p53fl/fl aNSCs at different time points after AdCre infection. The panel shows relative copy number, as inferred from QDNAseq analysis, across the region of chromosome 15 surrounding the predicted Myc-containing ecDNA (light blue). Notice the progressive increase in copy number of a focal amplification matching the predicted ecDNA boundaries. g, log2 fold change of mRNA expression of genes included in (blue) or flanking (red) the engineered Myc amplicon in Mycec/+p53fl/fl versus p53fl/fl aNSCs 5 weeks after AdCre infection, as determined by RNA-seq analysis. h, Gene set enrichment analysis showing the top enriched hallmark pathways in Mycec/+p53fl/fl versus p53fl/fl aNSCs at 5 weeks after AdCre infection. i, Gene set enrichment plot of hallmark gene set MYC Targets v.1, the most enriched gene set in Mycec/+p53fl/fl aNSCs. NES, normalized enrichment score; Padj, adjusted P value. NES and Padj were calculated as per the fgsea package in R. Scale bars, 5 μm.
Fig. 4
Fig. 4. Engineered Mdm2-containing ecDNAs promote immortalization and transformation of primary mouse cells.
a, Schematic of the Mdm2ec allele. b, Mdm2ec/+ MEFs approximately 5 weeks after being infected with AdCre or left untreated. Repeated on three independent MEF lines. c, Metaphase spread and DNA FISH showing the presence of multiple Mdm2-positive ecDNAs in AdCre-infected Mdm2ec/+ MEFs (inset). Repeated twice. d, Number of ecDNAs per metaphase in AdCre-infected Mdm2ec/+ MEFs transduced or not with HRASG12V and in tumours (n = 4) derived from injecting the transduced cells into the flanks of nude mice. Boxes indicate upper quartile, median and lower quartile. Whiskers extend to ±1.5 × IQR. P values, pairwise Wilcoxon rank-sum test corrected for multiple testing. n = 57, 54 and 106 metaphases. e, sWGS analysis of AdCre-infected Mdm2ec/+ MEFs at the indicated time points after AdCre infection showing progressive accumulation of the Mdm2 ecDNA over time. ‘Tumour’ indicates sWGS of a tumour obtained by injecting the HRAS-infected cells into the flank of a nude mouse. The absence of signal in the region immediately downstream of the amplicon is due to QDNASeq ignoring low-mappability regions. Amplicon copy number is indicated above each track. f, Representative image of a tumour developing in a nude mouse injected subcutaneously with AdCre- and HRASG12V-infected Mdm2ec/+ MEFs. g, Metaphase spread showing numerous ecDNAs (arrows) in cells isolated from the tumour shown in f. h, MDM2 immunoblot of lysates from tumours generated as indicated above. Mdm2-p53 double-knockout tumours served as negative controls for the MDM2 antibody. Asterisks indicate non-specific bands. Repeated on three independent tumours. i, Bar plot showing the log2 fold change of genes included within the Mdm2 amplicon (light orange) and immediately flanking it (grey) in Cre-treated Mdm2ec/+HRASG12V versus p53fl/flHRASG12V MEFs as determined by RNA-seq. Mdm2 is highlighted in blue. Scale bars, 350 μm (b), 10 μm (c,g).
Fig. 5
Fig. 5. An autochthonous mouse model of cancer harbouring engineered ecDNAs.
a, Schematics of the experimental strategy. A MYC-IRES-luciferase-encoding transposon and the Sleeping Beauty transposase were delivered by hydrodynamic tail-vein injection to six ActinCre Mdm2ec/+ and six ActinCre mice. b, Macroscopic appearance of the liver of a MYC-injected ActinCre Mdm2ec/+ mouse showing multiple nodules. c,d, Representative haematoxylin and eosin staining (c) and anti-Hnf4a immunostaining (d) of a liver lesion arising in ActinCre Mdm2ec/+ mouse. Arrowheads in d point to mitotic figures. Representative of eight tumour nodules in three mice. e, Metaphase spreads of cells obtained from a dissociated liver tumour showing multiple double-minute chromosomes (left panel) containing the Mdm2 locus (DNA FISH, right panel). Representative of three independent experiments f, DNA FISH on a tumour section using an Mdm2-specific probe showing amplification of the Mdm2 locus. g, Sections of normal liver and of a tumour nodule were stained by RNA FISH using a probe specific to the Mdm2 mRNA. A marked increase in Mdm2 signal (red) is evident in the tumour section. Repeated on three independent tumours. h, sWGS analysis of tumours from three mice, showing the presence of a focal amplification spanning the Mdm2ec region (blue shaded area). The computed average copy number of the amplicon is indicated on top of each track. Scale bars, 100 μm (c,d,g), 10 μm (e), 20 μm (f).
Extended Data Fig. 1
Extended Data Fig. 1. Generation of ecMDM2 and invMDM2 cells.
a. Schematic and predicted outcomes of the circularization strategy. Upon Cre-mediated recombination, ecDNAs encoding GFP are generated, while mScarlet is expressed from the linear chromosome harboring the corresponding deletion. Random segregation of the ecDNAs will lead some cells to acquire extra copies of the ecDNAs and therefore become more strongly positive for GFP, while other cells will lose the ecDNAs and become GFP-negative. b. Schematic and predicted outcome of the inversion strategy. In this allele, the 3’ circularization cassette is inserted at the same location as in the ecDNA allele, but with opposite orientation. Upon Cre-mediated recombination, the entire region is inverted resulting in the expression of both GFP and mScarlet reporters. Because both reporters remain on the chromosome, the resulting cells are predicted to remain double positive for mScarlet and GFP indefinitely. c. ecMDM2 and invMDM2 cells were infected with AdCre, and then sorted for GFP + ;mScarlet+ population. The mScarlet vs. GFP scatter plots of post-sorted double positive cells are overlaid, and the density plots for each fluorescence are shown on their respective axes. d. Box-and-whiskers plots comparing mScarlet or GFP fluorescence of sorted double positive ecMDM2 and invMDM2 cells, respectively, with indicated ratio of variances as determined by the F-test. n = 43760 cell for ecMMD2 and 48911 cells for invMDM2. Boxplot represents upper quartile, median, lower quartile. Whiskers extend to ±1.5 × IQR. Illustrations in a and b were created using BioRender (https://biorender.com).
Extended Data Fig. 2
Extended Data Fig. 2. Characterization of ecDNAs in ecMDM2 cells.
a. ecMDM2 and invMDM2 cells were infected with AdCre, expanded in the absence of hygromycin, and analyzed by flow cytometry at the indicated timepoints. Clones were propagated for 6 days in the presence or absence of hygromycin (200 µg/ml) and analyzed by flow cytometry. Pseudocolor scatter plots of GFP and mScarlet fluorescence at each time point are shown. Notice the progressive disappearance of double positive cells and the concomitant increase in GFP-;mScarlet+ cells in the ecMDM2 samples. b. Violin plots showing GFP intensity of sorted double positive ecMDM2 and invMDM2 cells expanded in the presence of the indicated concentration of hygromycin for 13 days and analyzed by flow cytometry (see also Fig. 2F–H). Median GFP intensity for each sample is also indicated. Boxes indicated interquartile range. **** indicates p-value < 0.0001 as determined by the Wilcoxon–Mann–Whitney two-side test. c. Representative DNA FISH on metaphase spreads from ecMDM2 cells maintained at the indicated hygromycin concentration. Scale bar: 7.5 µm. n = 15 (No Hygro), 14 (0.2 mg/ml), 16 (1 mg/ml), 14 (5 mg/ml) metaphases analyzed. d. Presence of MDM2-positive HSRs in representative metaphase spreads (n = 6 HSR containing metaphases out of 91 analyzed). Scale bar: 7.5 µm.
Extended Data Fig. 3
Extended Data Fig. 3. Generation and characterization of Mycec/+ mice.
a. Schematic of the Mycec allele. Upon AdCre transduction, Cre recombinase promotes the excision and circularization of the genomic region flanked by the two loxP sites. Genes are indicated in gray boxes. Myc gene is highlighted in red. Arrows indicate primers to detect the insertion of loxP sites for genotyping and Sanger sequencing. b. Sanger sequencing results of inserted loxP sites in the F1 progeny. LoxP sequences in the correct orientation are highlighted in light blue. c. Breeding schemes to test viability and fertility of Mycec/+ mice. Expected and observed genotypes in the F2 generation are reported. Representative genotyping PCR results are shown. All animals were genotyped. gDNA-PCR analysis to check for the insertion of both loxP sites (A-B and C-D) is shown on the left. d. Breeding schemes to test viability and fertility of Mycec mice. Expected and observed genotypes in the F2 generation are reported. e. gDNA-PCR analysis with primers designed to detect the circularized allele (Primers C-B) and scar on the linear chromosome (Primers A-D) on the linear chromosome upon Cre-expression performed on DNA extracted from different tissues of a Mycec/+;Actin-Cre mouse (1 month old). Amplification of an unrelated genomic region is included as a PCR control. Quantification by digital droplet PCR (ddPCR) of the circularized allele (Probes c-b) and the scar in linear chromosome (Probes a-d) is shown at the bottom. Heart, kidney, large bowel, pancreas, and spleen of a single Myc+/+;Actin-Cre mouse are used as controls. f. gDNA-PCR analysis (top) and quantification by ddPCR (bottom) of the circularized allele and the scar in linear chromosome in brain and large intestine of mice expressing the Cre recombinase under the control of the tissue-specific promoter of Nestin and Villlin1 (Vil1), respectively. The genotype of each mouse is indicated.
Extended Data Fig. 4
Extended Data Fig. 4. Characterization of ecDNAs in Mycec/+ NSCs.
a. sWGS data from the 5 week time points (see Fig. 3B) were analyzed using AmpliconArchitect to identify structural variants. The structural variant plot reveals a structural variant closing the left-and-right endpoints of the amplified region forming an ecDNA-like cycle spanning the region flanked by the loxP sites. b. Representative interphase-nuclei FISH (right) on aNSC from Mycec/+; p53fl/fl 5 weeks upon AdCre infection showing clustering inside the nucleus. Myc probe is in red. Control probe labeling a pericentromeric region of chromosome 15 is in green. Scale bar: 5 μm. c. ATAC-seq fragment size distribution of ecDNA and chromosomal DNA regions. n = 2 replicate per group. d. Location of active enhancers contained within and immediately outside the Myc ecDNA. Enhancers from the indicated mouse tissues at birth (P0) were obtained from the Encyclopedia of DNA elements (ENCODE) (ref. ). The two bottom tracks show ATAC-Seq reads count across the same region generated from NSCs with the indicated genotypes. The region corresponding to the ecDNA is highlighted in light red. e. ATAC-seq read counts in Mycec region normalized by sequencing depth and copy number in p53fl/fl;Mycec/+ and p53fl/fl cells (5,001,487 and 58,957 reads, respectively). Boxes indicate upper quartile, median, and lower quartile. Whiskers extend to ±1.5 × IQR. Two-sided Wilcoxon test. P value = 8.3e-10. f. Relative copy number and mRNA expression were determined by qPCR in Mycec/+;p53fl/fl neuronal stem cells at 1 week, 3 weeks, and 5 weeks post Ad-Cre infection. Only genes within the amplicon detectable at baseline are shown. Note that A1bg and Pvt1 expression increases more than predicted based on copy number (dashed line), while Myc expression increase is lower than predicted. g. Immunoblotting of MYC expression levels in Mycec/+; p53fl/fl and p53fl/fl aNSC 5 weeks upon AdCre Infection. h. Volcano plot of Mycec/+; p53fl/fl vs p53fl/fl aNSC 5 weeks upon AdCre infection. Genes with log2 Fold Change > 1, and adjusted P-value calculated using the DESeq2 R package <0.01 are indicated in red. Genes located in the Mycec amplicon are labeled. i. Growth curves of Mycec/+; p53fl/fl (black) and control p53fl/fl (grey) aNSC 5 weeks after AdCre infection. n = 10 biological replicates, 3 fields for each replicate have been acquired.
Extended Data Fig. 5
Extended Data Fig. 5. Generation of Myc-containing ecDNAs in different primary cell types.
Mycec/+;p53fl/fl and Myc+/+;p53fl/fl primary mouse embryo fibroblasts (a-d), cerebellar stem cells (e-h), and primary hepatocytes (i-l) were infected with Cre recombinase, passaged for 5-8 weeks and analyzed by PCR to detect circularization and excision of the ecDNA allele (a, e, i). (b,f,j) Metaphase spreads were examined by DNA-FISH using a Myc probe. Scale bar = 5 µm (c,g,k) Total genomic DNA was used to determine mean Myc copy number. Each bar corresponds to a biological replicate. (Error bars: mean ± SD). (d,h,l) Stacked bar plot showing the fraction of metaphases with (dark color) or without (light color) detectable Myc positive double minutes (ecDNAs). n = 50 metaphases per bar. Illustrations in a, b and i were created using BioRender (https://biorender.com).
Extended Data Fig. 6
Extended Data Fig. 6. Generation and characterization of Mdm2ec/+ mice.
a. Schematic of the Mdm2ec allele, with the two loxP sites flanking a 1.3Mbp region on chromosome 12. Arrowheads indicate the PCR primers used to identify successful loxP insertion. b. Zygotes were injected with Cas9-gRNA complexes and donor DNA containing loxP sites. Genotyping of F0 mice shows that Mouse #2 has loxP sites inserted at both the upstream and downstream locations. Note that the upstream wildtype band for Mouse #2 is lost, in this case indicating homozygous insertion of the loxP. After initial validation by sequencing, all mice were genotyped by PCR. c. Chromatograms showing correct insertion of the two loxP sites. d. A heterozygote F1 progeny of Mouse #2 crossed to a wildtype mouse shows that the loxP bands for the upstream and downstream integration sites co-segregate in the resulting F2 progeny, indicating that the loxP sites were inserted in cis e. Mdm2ec/+ F1 mice are bred to each other and resulting expected and observed F2 progeny ratio are described. f. AdCre-treated Mdm2ec/+ MEFs develop recombination of the loxP sites, resulting in the circularization of the intervening region as indicated by the amplification product of primers B and C. Repeated in three independent experiments. g. Chromatogram obtained by Sanger sequencing of the circularization product from E) demonstrated expected recombination sequence surrounding the loxP site.
Extended Data Fig. 7
Extended Data Fig. 7. Mdm2 expression in Mdm2ec/+ MEFs.
a. Western blot for MDM2 and tubulin of wildtype, Mdm2ec/+, and p53fl/fl MEFs with or without treatment by Cre and HRASG12V show significant accumulation of Mdm2 only in Cre-treated Mdm2ec/+ MEFs. Biological replicates from different Mdm2ec/+ MEF lines were analyzed. b. qPCR in Cre-treated Mdm2ec/+, and p53fl/fl MEFs show preferential upregulation of Mdm2 transcripts in Mdm2ec/+ MEFs. p-value: 0.0018, two-tailed t-test, Error bars: mean ± SD. N = 3 technical replicates. c. sWGS data from AdCre- and HRAS infected Mdm2ec/+ MEFs (see Fig. 4) were analyzed using AmpliconArchitect to identify structural variants. The coverage and structural variant plot reveals a structural variant closing the left-and-right endpoints of the amplified region forming an ecDNA-like cycle spanning the region flanked by the loxP sites.
Extended Data Fig. 8
Extended Data Fig. 8. Characterization of Mdm2ec/+;HRASG12V sarcomas.
a. Location of active enhancers contained within and immediately outside the Mdm2 ecDNA. Enhancers from the indicated mouse tissues at birth (P0) were obtained from the Encyclopedia of DNA elements (ENCODE) (ref. ). The two bottom tracks show ATAC-Seq reads count across the same region generated from NSCs with the indicated genotypes. The region corresponding to the ecDNA is highlighted in light red. b. ATAC-seq fragment size distribution of ecDNA and chromosomal DNA regions in Mdm2ec/+ and p53fl/fl MEFs transduce with HRASG12V. n = 4 replicates for Mdm2ec/+ and 3 replicates for p53fl/fl. c. ATAC-seq read counts in Mdm2ec region normalized by sequencing depth and copy number in Mdm2ec/+;p53fl/fl and p53fl/fl cells. (3,693,906 and 108,897 reads, respectively). Boxes indicate upper quartile, median, and lower quartile. Whiskers extend to ±1.5 × IQR. Two-sided Wilcoxon test. P value = 5.2e-10. d. RNA-FISH using an Mdm2 probe on tumour tissues from Mdm2ec/+;HRASG12V and p53fl/fl;HRASG12V MEFs at both low (20x, scale bar = 50 µm) and high (100x, scale bar = 10 µm) magnifications. e. Low magnification view showing a high-grade spindle cell sarcoma arranged in short fascicles and infiltrating into skeletal muscle. f. The lesional cells show increased nuclear pleomorphism, with scattered multinucleated forms (arrows) and increased mitotic activity (arrowheads). g. Higher magnification shows solid sheets of epithelioid to ovoid cells with distinct single or multi- intra-cytoplasmic fat vacuoles consistent with signet ring lipoblasts. Focal nuclear indentation, a characteristic feature of lipoblasts, is also noted. h. Increased mitotic activity and pleomorphic spindle cells with amphophilic cytoplasm and ovoid nuclei with clumped chromatin and prominent nucleoli in keeping with a high-grade sarcoma. Analysis repeated in tumours from 3 mice.
Extended Data Fig. 9
Extended Data Fig. 9. Mdm2ec/+;HRASG12V sarcomas response to Milademetan.
a. Dose-response curve of AdCre-treated p53fl/fl;HRASG12V and Mdm2ec/+;HRASG12V cells treated with the MDM2 antagonist milademetan. Each dot represents a technical replicate (n = 3). A representative plot of two independent experiments is shown. b-c. Cre-treated Mdm2ec/+;HRASG12V and p53fl/fl;HRASG12V MEFs were exposed to 1 µM milademetan, collected at indicated time points, and analyzed by RT-qPCR (b) and immunoblot (c). Error bars: mean ± SD. N = 3 technical replicates. Mdm2 and p21 mRNA and protein products are rapidly induced in Mdm2ec/+;HRASG12V cells in response to milademetan.
Extended Data Fig. 10
Extended Data Fig. 10. Characterization of Mdm2ec/+;Myctg liver tumours.
a. gDNA-PCR analysis with primers designed to detect the circularized allele (Primers C-B) and allele excision (Primers A-D) on the linear chromosome upon Cre-expression performed on DNA extracted from different tissues of Mdm2ec/+;Actin-Cre mouse (1 month old). Amplification of an unrelated genomic region is included as a PCR control. Quantification by digital droplet PCR (ddPCR) of the circularized allele (Probes C-B) and excision from the linear chromosome (Probes A-D) is shown at the bottom. Heart, kidney, large bowel, pancreas, and spleen of Mdm2+/+;Actin-Cre mouse are used as controls. b. Lower magnification of a representative H&E of Mdm2ec/+ liver tumour, showing the primary tumour is a poorly differentiated hepatocellular carcinoma (scale bar = 500 µm). c. Representative CK19 staining with a CK19+ bile duct, indicating tumours are negative for the cholangiocyte marker CK19 (scale bar = 100 µm, n = tumours from 3 mice). d. qPCR analysis of Mdm2 mRNA expression levels in Mdm2ec/+tumours compared to normal liver. Error bars: mean ± SD. N = 3 technical replicates. e. sWGS data from a representative Mdm2ec/+ tumour were analyzed using Amplicon Architect to identify structural variants. The structural variant plot reveals a structural variant closing the left-and-right endpoints of the amplified region forming an ecDNA-like cycle spanning the region flanked by the loxP sites. All tumours analyzed from three mice showed the same circular amplicon. f. sWGS analysis of individual liver tumours from three Actin-Cre;Mdm2ec/+ mice.

References

    1. Beroukhim, R. et al. The landscape of somatic copy-number alteration across human cancers. Nature463, 899–905 (2010). - PMC - PubMed
    1. Yi, E., Chamorro Gonzalez, R., Henssen, A. G. & Verhaak, R. G. W. Extrachromosomal DNA amplifications in cancer. Nat. Rev. Genet.23, 760–771 (2022). - PMC - PubMed
    1. Rosswog, C. et al. Chromothripsis followed by circular recombination drives oncogene amplification in human cancer. Nat. Genet.53, 1673–1685 (2021). - PubMed
    1. Shoshani, O. et al. Chromothripsis drives the evolution of gene amplification in cancer. Nature591, 137–141 (2021). - PMC - PubMed
    1. Cox, D., Yuncken, C. & Spriggs, A. I. Minute chromatin bodies in malignant tumours of childhood. Lancet1, 55–58 (1965). - PubMed

MeSH terms

Substances