. 2025 Feb;638(8049):251-260.
doi: 10.1038/s41586-024-08333-9. Epub 2024 Dec 18.

Nucleosome fibre topology guides transcription factor binding to enhancers

Affiliations

Nucleosome fibre topology guides transcription factor binding to enhancers

Michael R O'Dwyer et al. Nature. 2025 Feb.

Abstract

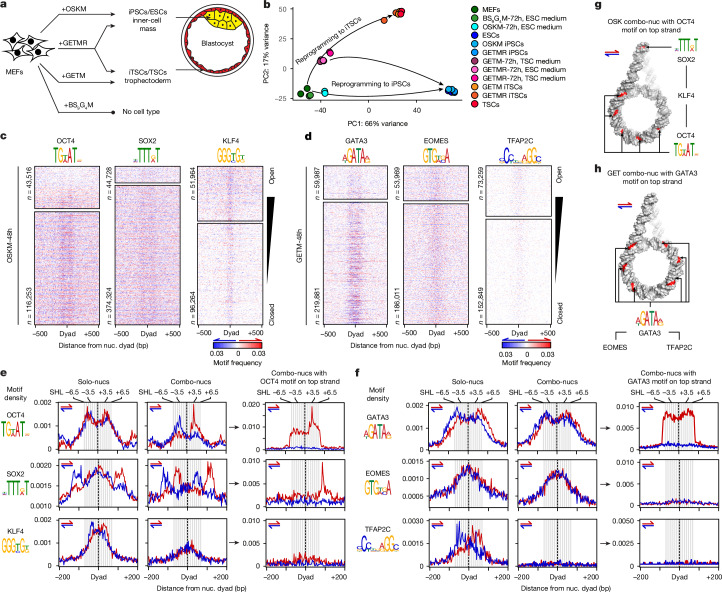
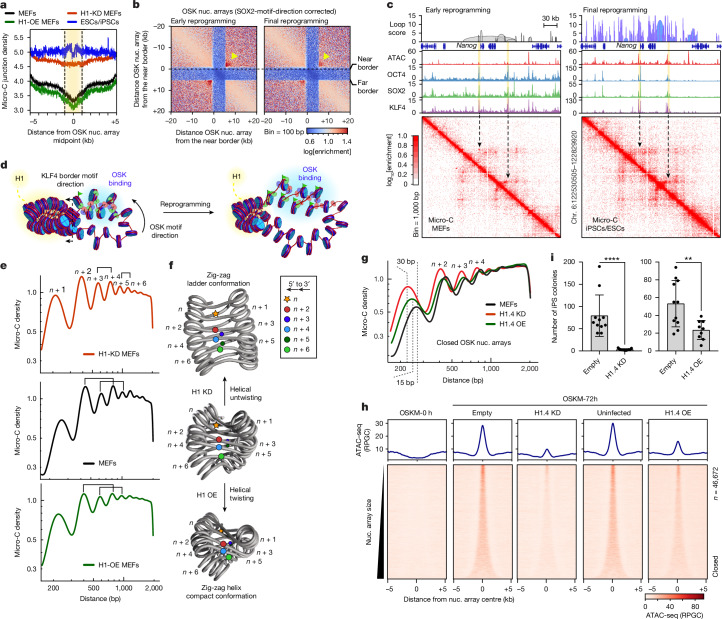
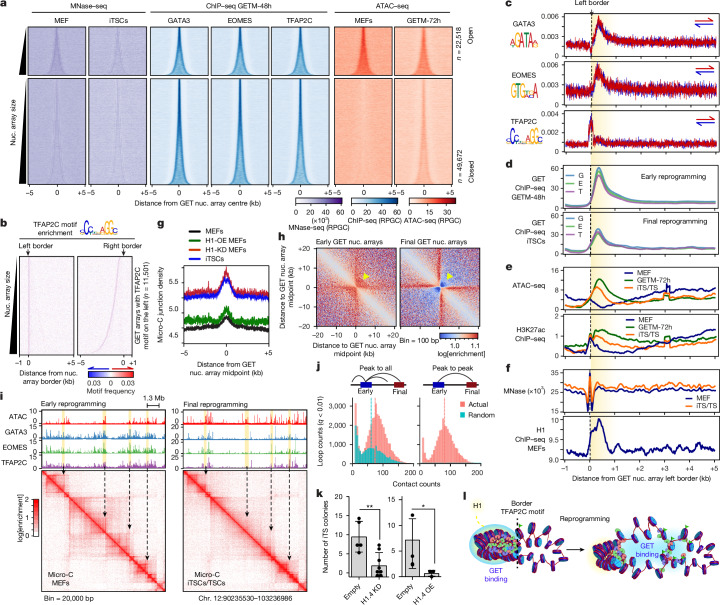
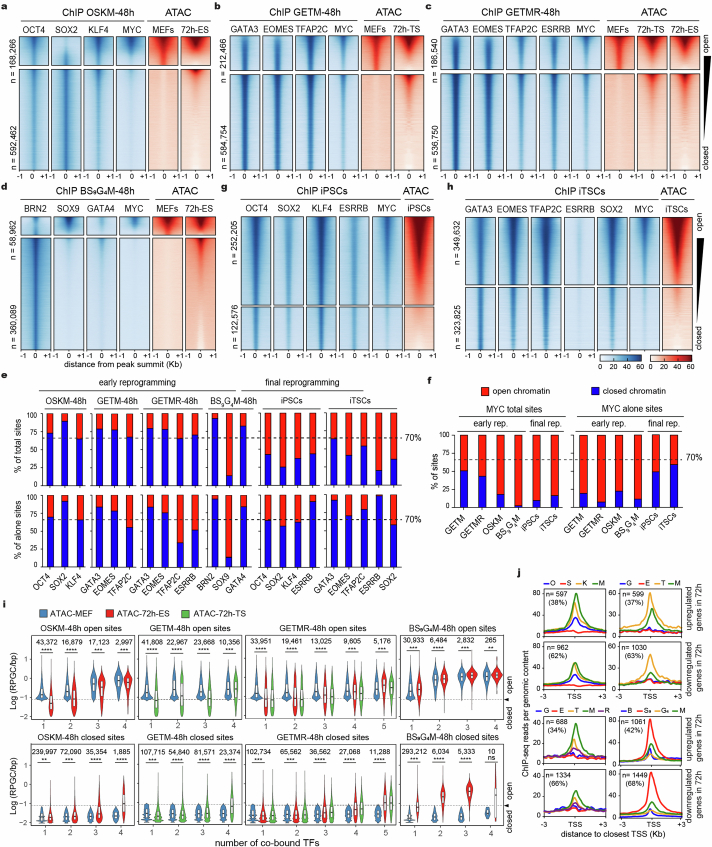
Cellular identity requires the concerted action of multiple transcription factors (TFs) bound together to enhancers of cell-type-specific genes. Despite TFs recognizing specific DNA motifs within accessible chromatin, this information is insufficient to explain how TFs select enhancers1. Here we compared four different TF combinations that induce different cell states, analysing TF genome occupancy, chromatin accessibility, nucleosome positioning and 3D genome organization at the nucleosome resolution. We show that motif recognition on mononucleosomes can decipher only the individual binding of TFs. When bound together, TFs act cooperatively or competitively to target nucleosome arrays with defined 3D organization, displaying motifs in particular patterns. In one combination, motif directionality funnels TF combinatorial binding along chromatin loops, before infiltrating laterally to adjacent enhancers. In other combinations, TFs assemble on motif-dense and highly interconnected loop junctions, and subsequently translocate to nearby lineage-specific sites. We propose a guided-search model in which motif grammar on nucleosome fibres acts as signpost elements, directing TF combinatorial binding to enhancers.


Conflict of interest statement

Competing interests: The authors declare no competing interests.

Figures

Fig. 1
Fig. 1. Motif readout on mononucleosomes can explain only TF solo binding.
a, Schematic of preimplantation blastocysts recapitulated by the different reprogramming cocktails used in this study. b, Principal component analysis of RNA-seq data in the early and final reprogramming contexts, showing a bifurcated trajectory (arrows) to iPS cells (iPSCs) and iTS cells (iTSCs) driven by GETMR. The reprogramming trajectory to iPS cells by OSKM is also indicated. c, Density heat maps of de novo motifs (logos on top) around nucleosome (nuc.) dyads (±500 bp) targeted by OSK during early reprogramming within open (top) and closed (bottom) chromatin. Motif density is scored on both DNA strands (red and blue) according to the colour gradient scale shown at the bottom. The number (n) of nucleosomes closest to each TF peak summit is indicated. d, The same as in c, but for GET during early reprogramming. e, Average profile plots of motif density scores on the two DNA strands (red and blue) around nucleosome dyads (±200 bp) targeted by OSK individually (solo-nucs) or in combination (combo-nucs) during early reprogramming. Nucleosomes with dyads within ±80 bp from ChIP–seq peak summits are considered to be OSK targets. Nucleosomes targeted by all possible OSK combinations are considered to be combo-nucs. OSK combo-nucs with OCT4 motifs on the top strand ±80 bp from the dyad are shown on the right. Weighed frequency values were generated using kernel smoothing in 3 bp windows. DNA 10 bp twists are shown in grey–white stripes, indicating nucleosome SHL positions on top. f, The same as in e, but for GET during early reprogramming. g, Cartoon representation of OSK combo-nucs DNA (grey) containing an OCT4 motif on the top strand (red), highlighting possible SOX2 and KLF4 motif positions (red). h, The same as in g, but for GET combo-nucs with a GATA3 motif on the top strand. ESC, embryonic stem cell.
Fig. 2
Fig. 2. Motif readout on nucleosome arrays deciphers OSK combinatorial binding.
a, Density heat maps showing the MNase–seq (purple), OSK ChIP–seq (blue) and ATAC–seq (red) signal, spanning ±5 kb around OSK nucleosome arrays during early reprogramming. The arrays within open (top) and closed (bottom) chromatin were separated according to ATAC–seq in MEFs and rank ordered based on size. The number of nucleosome arrays (n) is indicated. b, Profile plots of motif enrichment on both DNA strands (red and blue) around OSK nucleosome arrays (±5 kb) during early reprogramming. The average array size is highlighted in yellow. The dashed lines indicate near and far borders. c, Density heat maps showing OSK motif distribution (logos on top) around the OSK nucleosome array midpoints (±5 kb) during early reprogramming within closed chromatin and containing ≥7 SOX2 motifs per kb on the bottom strand. The motif density is scored on the top (red) and bottom (blue) strands, as indicated by the colour gradient scale shown at the bottom. MNase–seq read density heat maps (purple) are also shown. The arrays were rank ordered based on size, and those within 0.8–2.8 kb are indicated by arrowheads, dashed lines and number (n). d, Profile plots of OSK motifs centred around the near border (dashed line) of OSK nucleosome arrays (0.8–2.8 kb in size) as shown in c. The average array size is highlighted in yellow. e, The same as in d, but showing MNase–seq (top) and H1 ChIP–seq (bottom) in MEFs (blue) and ES cells (orange). f, The same as d, but showing the OSK occupancy (ChIP–seq). g, Genome browser screenshot around an exemplar OSK nucleosome array targeted in early and final reprogramming, showing MNase–seq, ATAC–seq and OSK ChIP–seq. The near and far borders are indicated by dashed lines, with the direction of KLF4 motifs on top. h, The same as d, but showing ATAC–seq (top) and H3K27ac ChIP–seq (bottom). i,j, The same as in d, but showing OSK ChIP–seq data from two independent studies ((i) and (j)). RPGC, reads per genome coverage.
Fig. 3
Fig. 3. Signpost elements guide OSK binding to pluripotency enhancers during reprogramming.
a, Genome browser screenshot of the Nanog locus bound by OSK (ChIP–seq) in early (top) and final reprogramming (bottom). A schematic of the Nanog promoter (pro.) and enhancer (enh.) separated by a signpost element, with the directionality of OSK motifs indicated by chevrons, is shown below. b, Schematic of the PiggyBac (PB) construct containing the dual eGFP/tdTomato reporter cassettes. eGFP is driven by the WT Nanog promoter–signpost–enhancer shown in a, and tdTomato is driven by the same promoter–enhancer but separated by a flipped signpost element. ITR, inverted terminal repeat. c, Experimental flow chart illustrating PB construct integration into ES cells, which contributed to chimeric embryos from which MEFs were derived; these cells were then used for iPS reprogramming to examine the reactivation of the dual reporters. d, The expression of eGFP and tdTomato in ES cells targeted by the PB construct was measured using flow cytometry and the percentages of eGFP+ and tdTomato+ cells are indicated. FL8, fluorescence channel 8 (non-specific channel). e, Expression of eGFP and tdTomato in the male gonad isolated from chimeric embryos at E13.5, reflecting Nanog expression. Representative image from n = 3 biological replicates. Scale bar, 100 µm. f, Motif directionality in the signpost element leads to more efficient eGFP activation during reprogramming. Quantification of eGFP+ and tdTomato+ cells during reprogramming is shown, as measured using flow cytometry. Statistical significance was determined using two-sided paired t-tests; *P = 0.03, **P = 0.01, ***P < 0.001. Data are mean ± s.d. from three biological replicates (n = 3). g, eGFP expression precedes tdTomato in reprogramming. Fluorescence images of an iPS cell colony showing expression of eGFP and tdTomato at day 15 followed by 4 days without doxycycline (dox.). Bright-field (BF) and merged images are also shown. Representative image from n = 3 biological replicates. Scale bar, 100 µm.
Fig. 4
Fig. 4. OSK target chromatin loops with diminished linker histone.
a, Profile plots of Micro-C ligation junctions around OSK nucleosome arrays (±5 kb) in early (black) and final (blue) reprogramming, H1-KD MEFs (red) and H1-OE MEFs (green). b, Micro-C pileup heat maps of OSK nucleosome arrays (SOX2-motif-direction corrected) in early (right) and final (left) reprogramming. Maps are plotted using bin = 100 bp at log scale. The arrowheads indicate strong interactions across chromatin loops. c, Micro-C contact matrices (bottom), showing 1-kb-resolution interactions around the Nanog locus in early (left) and final (right) reprogramming. Contacts around exemplar OSK nucleosome arrays are indicated by arrows with the corresponding genome browser tracks of ATAC–seq and ChIP–seq shown above and highlighted in yellow. Associated loops called by FitHiChIP (q < 0.01) are shown at the top. d, Schematic of the nucleosome array organization within chromatin loops, illustrating OSK co-binding in early (left) and final (right) reprogramming. OSK binding is highlighted in blue, H1-enrichment in yellow and H3K27 acetylation is indicated by green flags. e, Micro-C decay curves showing internucleosomal contacts in H1-KD MEFs (red), MEFs (black) and H1-OE MEFs (green). Interactions between nucleosome n and n + x in 5′-to-3′ orientation and similar abundance are linked by brackets. f, Cartoon representations of the two-start zig-zag nucleosome fibre that comply with the internucleosomal n and n + x contacts shown in e. The coloured circles indicate the ligated partners between n (star) to n + x (coloured circles) in 5′-to-3′ orientation. g, Micro-C decay curves as in e for OSK nucleosome arrays. Nucleosome repeat-length changes are indicated by dashed lines. h, Profile plots (top) and heat maps (bottom) of ATAC–seq around OSK nucleosome arrays of TNG-KOSM-MEFs (OSKM-0h) or after OSKM induction (OSKM-72h) infected with empty, H1.4-KD or H1.4-OE vectors. i, Quantification of iPS cells (NANOG+) generated from TNG-KOSM-MEFs that were infected with empty, H1.4-KD and H1.4-OE vectors. Statistical significance was determined using two-sided unpaired t-tests; ****P < 0.0001, **P = 0.005. Data are mean ± s.d. from biological replicates (n = 11).
Fig. 5
Fig. 5. GET target loop junctions enriched for linker histone.
a, Density heat maps showing the MNase–seq (purple), GET ChIP–seq (blue) and ATAC–seq (red) signal around GET nucleosome arrays during early reprogramming. The arrays were grouped by ATAC–seq in MEFs and ranked by size. The number of nucleosome arrays (n) is indicated. b, Motif density heat maps on DNA strands (red and blue) around the left and right borders of GET nucleosome arrays containing the TFAP2C motif on the left border. The arrays were rank-ordered by size and motifs were scored by colour gradient scale (bottom). c, Profile plots of GET motifs centred around the GET array left border (dashed line). The average array size is highlighted in yellow. df, The same as in c, but for GET ChIP–seq (d), ATAC–seq and H3K27ac ChIP–seq (e), and MNase–seq and H1 ChIP–seq (f). g, Profile plots of Micro-C density around GET nucleosome arrays in early (black) and final (blue) reprogramming, H1-KD MEFs (red) and H1-OE MEFs (green). h, Micro-C pileup heat maps of GET nucleosome arrays during early reprogramming (left) and in fully reprogrammed cells (right). The arrowheads indicate interactions within GET nucleosome arrays diminished after reprograming. i, Micro-C contact matrices highlighting stripe contacts (arrows) at topologically associated domain borders where GET binding is strongest, as indicated by the genome tracks above. j, Chromatin loops linking the actual GET nucleosome arrays to all regions (left) or enhancers (right) in iTS cells compared with randomized sequences, as shown in the inset. k, The number of iTS cell colonies (CDX2+) of H1.4-KD MEFs and H1.4-OE MEFs compared with MEFs infected with an empty vector. Statistical significance was determined using two-sided unpaired t-tests; *P = 0.02 and **P = 0.001. Data are mean ± s.d. from n = 6 (H1.4-KD) and n = 3 (H1.4-OE) biological replicates. l, Schematic of chromatin loop junctions targeted by GET in early (left) and final (right) reprogramming. GET binding is shown in blue, H1 enrichment is shown in yellow and H3K27 acetylation is indicated by green flags.
Extended Data Fig. 1
Extended Data Fig. 1. Pioneer TF off-targeting is a general feature in early reprogramming.
a, Experimental flowchart of reprogramming MEFs to iPSCs and iTSCs indicating timepoints of sample collection and experimental strategy carried out in this study. b, Immunofluorescence showing relatively homogenous ectopic expression of TFs in MEFs transduced with the corresponding lentivirus after doxycycline induction for 48 h. scale bar = 100 µm. c, Infection efficiency across the different TFs as measured by immunofluorescence shown in (b). Average biological replicates (n = 3) and error bars representing ± s.d. d, Western blot analysis showing the presence of the ectopic TFs running at the expected size in MEFs infected with the corresponding lentivirus only after doxycycline induction for 48 h. Raw blots are shown in Supplementary Fig. 1. e, Agarose gel electrophoresis showing equivalent chromatin fragmentation after sonication in all reprogramming contexts, which were used for ChIP-seq experiments. Each lane indicates an independent biological replicate. Unprocessed gels are shown in Supplementary Fig. 1. f, Overlap between TF binding sites at early and final stage reprogramming. Bars represent the percentage of the total number of sites identified between both conditions. g, Bar plots showing the extent of overlap between SOX2, MYC and ESRRB sites in iPSCs/ESCs and iTSCs/TSCs, indicating their cell-type-specific binding. Bars represent the percentage of the total number of sites identified in both conditions. h, Venn diagram showing the overlap between the binding of BRN2 in early reprograming (this study) and in NPCs. i, Pearson correlation heatmap of the top 500 most variable genes across all early and final reprogramming contexts as measured by RNA-seq. Correlation colour scale is indicated. j,k,n, Immunofluorescence of pluripotency (NANOG, SALL4, and OCT4) and trophoblast stem cell markers (CDX2, GATA3, and TFAP2C) in the fully reprogrammed iPSCs and iTSCs, respectively. The corresponding DAPI staining (blue), and brightfield images are also shown. Scale bar = 100 µm. l,m,o, Bar plots showing the silencing of exogenous reprogramming genes (indicated above) after the completion of reprogramming. Three biological replicates (exp.) of MEFs, 72 h after TF induction, and iPSC or iTSC clonal lines were used. Gene expression measured by qPCR and the mean values of technical replicates (n = 2) normalized against Gapdh. Error bars representing ± s.d.
Extended Data Fig. 2
Extended Data Fig. 2. Pioneer TFs target closed chromatin individually and together during early reprogramming.
a, Read density heatmaps of O,S,K,M ChIP-seq signal (blue) in OSKM-48h spanning ±1 kb around the summits of O,S,K,M peaks pooled together. Heatmaps of ATAC-seq signal (red) showing changes of chromatin accessibility around TF binding sites from MEFs to OSKM-72h. Open and closed sites separated according ATAC-seq in MEF and rank ordered by ATAC-seq in OSKM-72h. The number of sites (n) is indicated. b,c,d,g,h, As in (a) but for G,E,T,M in GETM-48h, G,E,T,M,R in GETMR-48h, B,S9,G4,M in BS9G4M-48h, O,S,K,R,M in iPSCs/ESCs and G,E,T,R,S,M in iTSCs/TSCs, respectively. e, Bar plots showing the percentage of TF binding to closed sites (blue) versus open sites (red) in early and final reprogramming. Total sites are shown on top and unique sites where each TF is bound individually are shown at the bottom. f, Same as in (e) for MYC sites. i, Violin plots of chromatin accessibility changes in early reprogramming as a function of the number of TFs co-bound within open chromatin (top) and closed chromatin (bottom) for each TF combination. Open and closed chromatin threshold is indicated by dotted line. The violin shapes indicate the maxima, minima and data distribution. The bottom, top, and middle line of boxes indicate the first quartile (25th percentile), third quartile (75th percentile), and median (50th percentile), respectively. Statistical significance measured by paired t-test and P values are indicated by (****) for p <= 0.0001, (***) p <= 0.001, (**) p <= 0.01, and (ns) for p > 0.05. j, Profile plots of TF enrichment around ±3 kb from TSS of upregulated (top panels) and downregulated genes (bottom panels) in early reprogramming (72 h). TF enrichment profiles are colour coded in each reprogramming system as shown above. The number (n) and percentage of up and downregulated genes are indicated.
Extended Data Fig. 3
Extended Data Fig. 3. TFs bind fragile or sub-nucleosomes in open chromatin and intact nucleosomes in closed chromatin.
a, Agarose gel electrophoresis showing gradual chromatin digestion with increasing amounts of MNase (1-64U). DNA fragments ranging from ~90–200 bp (dotted red box) were used in MNase-seq. Representative images from at least n = 3 biological replicates, which were pooled together for sequencing. Unprocessed gels are shown in Supplementary Fig. 1. b, profile plots showing fragment size distributions obtained from MNase-seq in iPSCs, iTSCs, and MEFs using 1, 4, 16, and 64 U/mL MNase. Arrow on 150 bp indicates the separation between regions containing mainly sub-nucleosomes (< 150 bp) from those containing mainly canonical mono-nucleosomes (>150 bp). MNase amounts are colour coded as indicated on top. c-e, MNase-seq 2D heatmaps showing nucleosome enrichment against DNA fragment size around TF peak summits (±1 kb) within open (left) versus closed chromatin (right). The 2D heatmaps were generated using 1U MNase digestion to show fragile and sub-nucleosome species, which are not detected at higher MNase concentrations. Fragment sizes around ~150–170 bp represent canonical nucleosome, and fragments <150 bp represent fragile or sub-nucleosomes. Heatmaps are auto- scaled according to closed chromatin signal on each set as indicated on the left. In (d) a 10 bp footprint pattern within open chromatin in iTSCs indicate well positioned fragile at low MNase concentrations.
Extended Data Fig. 4
Extended Data Fig. 4. TFs display distinct motif readout on mono-nucleosomes when bound individually and together.
a, Motif density heatmaps showing the distribution of de novo motifs (logos on top) around nucleosome dyads (±500 bp) targeted by OSK in fully reprogrammed cells within open (top) and closed (bottom) chromatin. Motifs are scored on both DNA strands (blue and red) following the colour gradient scale at the bottom. The number (n) of nucleosomes targeted by each TF are indicated. b–d, Same as in (a) for GET in final reprogramming, ESRRB in early and fully reprogrammed cells, and BS9G4 in early reprogramming, respectively. e, Flowchart of assigning nucleosomes to TF solo-binding and combo-binding followed by motif scanning around the dyads. f, Line plots showing motif scores on the top (red) and bottom (blue) DNA strands around nucleosome dyads (±200 bp) targeted by OSK when bound individually (solo-nucs, left panels) or in combination (combo-nucs, middle panels) in fully reprogrammed cells. Nucleosomes bound by OSK together and contain OCT4 motif on the top strand (right panels) within closed chromatin. g,h, Same as in (f) for GET in iTSCs and Brn2 and Gata4 in BS9G4M-48h cells, respectively. i, Bar plots showing the frequency of OSK motif occurrence alone and together (co-occur. freq.) in solo-nuc. and combo-nucs. Average motif frequencies with error bars representing ± s.d. Average motif co-occurrence frequency by chance is indicated by dotted line. j, Same as (i) for GET motifs.
Extended Data Fig. 5
Extended Data Fig. 5. OSK motif readout on nucleosome arrays decipher combinatorial binding in early reprogramming.
a, Histograms showing size distribution of OSK nucleosome arrays (grey) compared to arrays targeted by O,S,K individually (blue, red, magenta, respectively). b, Read density heatmaps showing OCT4 ChIP-seq around OSK nucleosome arrays (left) or OCT4 lone-bound sites (right) in OSKM-48h and O-48h, spanning ±5 kb around the array midpoints. The nucleosome arrays were ranked ordered based on size and grouped into open (top panels) and closed (bottom panels) according to ATAC-seq in MEFs (not shown). The number of nucleosome arrays (n) are indicated. c, OCT4 and SOX2 bind specifically together to Fgf4 enhancer containing OCT/SOX composite motif. Super-shift EMSA showing three retarded bands when OSKM-48h nuclear lysates were incubated with Cy5-labelled oligonucleotide from Fgf4 enhancer. The bands correspond to OCT4-DNA, SOX2-DNA and OCT4/SOX2-DNA complexes. All three bands were diminished when excessive amounts of the specific (Fgf4) but not the non-specific competitor (P19) were added. Specific bands were also diminished when the corresponding antibodies were added. Representative image from (n = 3) biological replicates. Uncropped gels are shown in Supplementary Fig. 1. d, EMSA showing OCT4/SOX2-DNA complexes were formed only when OSKM-48h nuclear lysates were incubated with Fgf4 enhancer but not O-48h lysates. Representative image from (n = 2) biological replicates. Uncropped gels are shown in Supplementary Fig. 1. e, Histograms showing OSK motif frequency distribution within OSK nucleosome arrays. f, Profile plots showing SOX2 motif distribution around OSK nucleosome array borders, ranging in motif density from ≥ 4-to-7 motif/kb. Motif enrichment is measured in both strands separately, showing motif unidirectional orientation. The number (n) of nucleosome arrays with the different SOX2 motif densities are indicated. g, Venn diagram showing the overlap between OSK nucleosome arrays containing SOX2 motifs on the top and bottom strands. Only arrays with motif density ≥ 7 motif/kb and 0.8-2.8 kb in size are shown here. h, Heatmaps showing the OSK motif distribution patterns (logos on top) around nucleosome array midpoint (±5 kb) bound by OSK in early reprogramming within closed chromatin and contain ≥ 7 SOX2 motif/kb on the top strand. Motifs are scored on the top (red) and bottom (blue) strands as indicated by the colour gradient scale at the bottom. MNase heatmaps (purple) within the same OSK nucleosome arrays are shown on the left. The arrays were rank ordered based on size and those within 0.8-2.8 kb are indicated by arrowheads and dashed lines. The number (n) of the OSK nucleosome arrays is indicated.
Extended Data Fig. 6
Extended Data Fig. 6. Combinatorial binding to signpost elements guides OSK to pluripotency enhancers during reprogramming.
a, Line plots showing O,S,K motifs enrichment on the top (red) and bottom (blue) DNA strands around the midpoints of OSK nucleosome arrays (±5 kb) in fully reprogrammed iPS cells. The average array size highlighted in yellow with dotted lines at the borders. b, Histograms showing size distribution of OSK nucleosome arrays bound in final reprogramming (purple) compared to early reprogramming (grey). c, The early reprogramming OSK nucleosome arrays are adjacent to enhancers in iPS cells. Bar plot showing the distance between OSK nucleosome arrays in early reprogramming and enhancers in iPSCs (represented by a schematic in the inset). The experimental distance (actual) was compared to random sequences. Two-sided Wilcoxon rank-sum test with continuity correction: w = 10,696,640,768 and P = 2.286 × 10⁻⁶. d, OSK nucleosome arrays in early reprogramming are silenced in iPS cells. Line plots showing that histone marks and co-factors associated with heterochromatin are enriched within the early OSK nucleosome arrays (highlighted in yellow) after the completion of reprogramming. The GEO access codes of the data used are indicated. e, Same as (d) for histone marks associated with active chromatin. f, The expression of eGFP and tdTomato were measured by flow cytometry during reprogramming, showing motif directionality in Nanog signpost element is important for gene reactivation. g, eGFP and tdTomato expression gradually increases in iPSCs after passaging. The expression of eGFP and tdTomato were measured by flow cytometry in iPSCs after different passages. h, Bar plot quantifying eGFP+ve and tdTomato+ve cells during reprogramming as measured in (g). Data are mean ± s.d. from biological replicates (n = 3). i, Fluorescence images of iPSC colony after passage four. Bright field (BF) and merged images are also shown. Representative image from n = 3 biological replicates. Scale bar = 100 µm.
Extended Data Fig. 7
Extended Data Fig. 7. Micro-C reveals distinct spatial organization of nucleosome arrays targeted by OSK.
a, Agarose gel electrophoresis showing gradual chromatin digestion with increasing amounts of MNase concentrations. 15 and 20 U of MNase (dotted red box) were used for Micro-C experiments. Representative image from n = 4 biological replicates, which were pooled together for sequencing. b, Profile plot showing mono- and di-nucleosome DNA fragment sizes before (top) and after (bottom) proximity ligation. c, Decaying curves of inter-nucleosomal Micro-C contacts zoomed within 200 bp and 2 kb distance. Micro-C contact density normalized by sequencing depth. Three curves showing distinct read pair orientations relative to one another are colour coded as shown in the schematics above. Contacts of up to six nucleosomes can be resolved (dashed line). Schematics illustrating the inter-nucleosomal contacts between n/n + x in different orientations are indicated on top. Insets show an example of n/n + 1 and n/n + 5 (painted blue) in 3’-to-5’ orientation. d, Micro-C pileup heatmaps of OSK nucleosome arrays in early reprogramming (top) and fully reprogrammed cells (bottom). Maps are plotted at 100 bp resolution for fine-scale inter-nucleosome contacts and centred around the upstream near-border. Yellow arrowheads indicate strong interactions between the near and far-border, which disintegrate in final reprogramming. e, OSK bind to more interactive enhancers after reprogramming. Pileup Micro-C analysis showing long-range interactions at 2 kb resolution around nucleosome arrays midpoints targeted by OSK in early (left) and final reprogramming (right). f, Circos plots showing long range interactions linking OSK binding (ChIP-seq) along with chromatin accessibility (ATAC-seq) and nucleosome positions (MNase-seq). More long-range interactions are observed after reprogramming. g, Reverse-phase HPLC analysis of chromatin histone extracts purified from MEFs (black), MEF-empty (grey), MEF-H1.4KD (red), and MEF-H1.4OE (green), showing the abundance of H1 variants. Absorbance at 214 nm in milli-absorbance-units (mAU) was plotted as function of elution time (min). h, Bar plots of relative H1 amounts quantified by HPLC in (g) showing the compensation effects of H1 variant expression after H1.4KD and H1,4OE in MEFs. i, LC-MS successfully deconvoluted the H1.3 (black) and H1.4 (grey) amounts in MEFs, MEF-empty, MEF-H1.4KD, and MEF-H1.4OE, which were not resolved by HPLC in (g). j, Western blot analysis showing the amounts of total H1 (using pan-H1 antibody) in MEF-H1.4KD and MEF-H1.4OE compared to MEF-empty. Protein ladder sizes in KDa are indicated. representative image from n = 5 biological replicates. Raw blots are shown in Supplementary Fig. 1. k, Average profile plots (top) and read density heatmaps (bottom) of ATAC-seq signal around nucleosome arrays bound by OSK in MEFs, MEF-empty, MEF-H1.4KD and MEF-H1.4OE. The nucleosome arrays were ranked ordered based on size and grouped into open and closed according to ATAC-seq in MEFs. The number of nucleosome arrays (n) are indicated. Four biological replicates (n = 4) were sequenced and merged for analysis. l, Experimental flow chart of ATAC-seq to measure the effects of H1.4KD (top) and H1.4OE (bottom) on chromatin accessibility as a proxy for OSKM binding during reprogramming early of TNG-KOSM-MEFs. Fully reprogrammed KOSM-MEFS were assessed by the expression of GFP, which has been knocked-in to one of the Nanog alleles (TNG).
Extended Data Fig. 8
Extended Data Fig. 8. GET recognize motif-dense and highly inter-connected nucleosome arrays enriched for H1.
a, Histograms showing size distribution of GET nucleosome arrays (grey bars) compared to arrays targeted by GET individually (blue, red, magenta, respectively). OSK nucleosome arrays are also shown for comparison (grey line). b, Profile plots showing GET motif distribution on top (red) and bottom (blue) DNA strands around the centre of GET nucleosome arrays (highlighted in yellow), with borders indicated in dotted lines. c, Histograms showing GET motif frequency distribution within GET nucleosome arrays in early reprogramming. d, Motif density heatmaps on both DNA strands (red and blue) around the left border (left panel) and right border (right panel) of GET nucleosome arrays containing TFAP2C motif on the right border. The arrays were rank-ordered based on size and motifs scored by the colour gradient scale at the bottom. Number of arrays (n) is indicated on the side. e, TFAP2C motifs are enriched in either the left or right border of the GET nucleosome arrays. Bar plot showing the count of TFAP2C motifs within each border of GET nucleosome arrays. f, profile plot showing the enrichment of H1 within GET nucleosome arrays in early reprogramming (red) in contrast to OSK nucleosome arrays (blue). Average GET nucleosome array size highlighted in yellow. GEO access codes of H1 ChIP-seq is indicated. g, Micro-C pile-up heatmaps of nucleosome arrays targeted by GET in early reprogramming (left) and in iTSCs (right) showing the increase of long-range interactions (indicated by arrow) after the completion of reprogramming. Bins = 2,000 bp and log enrichment scale is indicated at the bottom. h, Corner stripe stackup profiles (top) and heatmaps (bottom) showing the diffusion of borders around GET nucleosome arrays from early (left panels) to full reprogramming (right panels) at 2 kb resolution. Only GET nucleosome arrays with TFAP2C motif on the left border are shown (n = 11,501). i, GET translocate across interconnected nucleosome arrays during reprogramming. Arch representations of peak to peak (P2P) loops (magenta) showing interactions of exemplar nucleosome array bound by GET in early (blue) and final reprogramming (red). Genome browser tracks of ChIP-seq corresponding to GET nucleosome arrays highlighted in yellow. P2P loops are called by FitHiChIP with Q<0.01 threshold. j, GET nucleosome arrays in early reprogramming are not enriched for Cohesin and CTCF in MEFs. Line plots showing that histone marks and co-factors associated with open chromatin are depleted within GET nucleosome arrays in MEFs. The GEO access codes of the data used are indicated.
Extended Data Fig. 9
Extended Data Fig. 9. Non-pioneer MYC binding with OSK and GET to nucleosome arrays follow distinct mechanism.
a, MYC binding to closed chromatin is markedly different in the four TF combinations. Read density heatmaps showing TF ChIP-seq signal (blue) and ATAC-seq signal (red) spanning ±1 kb of MYC peak summits within closed chromatin in the indicated early reprogramming condition. The numbers (n) of MYC bound sites in each condition are indicated. Colour scale bars (RPGC) are indicated below. E-box motifs identified by de novo motif analysis from each group are indicated. b, Closed chromatin sites proximal to MYC display more opening in early reprogramming. Average chromatin accessibility (ATAC-seq) around ±1 kb of OSK, GET and GETR sites distal versus proximal to MYC sites before and after 72 h ectopic TF expression. The number of sites (n) is indicated. c, Profile plots (top panel) showing E-box motif enrichment on the top (red) and bottom (blue) DNA strands around the near-border (dotted line) of nucleosome arrays bound by OSK and MYC during early reprogramming. MYC ChIP-seq enrichment in early reprogramming is shown in the bottom panel. The average array size highlighted in yellow. d, Same as (c) for OSKM nucleosome arrays corrected for SOX2 motif orientation. e, Same as (c) for GET binding with MYC. f, Cartoon (top panel) and electrostatic surface (bottom panel) representations showing the interaction of MYC/MAX heterodimer with TFAP2C homodimer. The protein surface is coloured according to its electrostatic potential from red (−500 kT, negatively charged) to blue (+500 kT, positively charged). The complex structure was predicted by Alpha-Multimer only considering DBDs of MYC/MAX and TFAP2C. Cartoon representation of DNA (grey) containing TFAP2C site is shown. g, TFAP2C and MYC bind specifically together to Cdx2 enhancer site (TFAP2C target). Super-shift EMSA showing two retarded bands when GETM-48h nuclear lysates were incubated with Cy5-labelled oligonucleotide from Cdx2 enhancer containing TFAP2C site. The two bands correspond to TFAP2C-DNA and MYC/TFAP2C-DNA complexes. The MYC/TFAP2C-DNA band diminished after adding excessive amount of P19 (Cdkn2d promoter) oligonucleotide (MYC target) or MYC antibody as competitors. Both bands diminished after adding TFAP2C antibody, unlike GATA3 and EOMES antibodies. Representative image from n = 2 biological replicates. Uncropped gels are shown in Supplementary Fig. 1. h, Co- immunoprecipitation of TFAP2C and MYC indicating direct protein-protein interaction. Immunoprecipitation of TFAP2C, but not IgG, allows the detection of MYC by western blot in the presence of absence of DNase. Band representing MYC is indicated by an arrowhead. Molecular weight marker (KDa) is indicated. Representative image from n = 2 biological replicates. Raw blots are shown in Supplementary Fig. 1.
Extended Data Fig. 10
Extended Data Fig. 10. Competitive interaction between EOMES and ESRRB for TFAP2C/MYC on nucleosome arrays expands GETMR reprogramming.
a, Bar plot of GETM peaks identified by ChIP-seq in GETM-48h and GETMR-48h cells showing a significant loss of TFAP2C and MYC sites in the presence of ESRRB. b, ChIP-seq read density heatmaps (blue) of GETM in GETM-48h cells and GETMR in GETMR-48h cells spanning ±1 kb from TFAP2C summits of retained (top) versus lost sites (bottom) when comparing GETM-48h to GETMR-48h cells. Sites are sorted based on the central enrichment of TFAP2C in GETM-48h cells. The average enrichment of the corresponding TFs in retained (solid line) versus lost (dotted line) TFAP2C sites are shown above. The number (n) of sites are indicated in the left. Colour scale indicated indicate normalized ChIP-seq enrichment (RPGC). c, Genome browser tracks of representative loci containing a TFAP2C retained or lost site, showing GETM and GETMR enrichment (ChIP-seq) in GETM-48h and GETMR-48h cells, respectively, and chromatin accessibility (ATAC-seq) in MEFs, GETM-72h and GETMR-72h cells. d, Bar plots showing the percentage of TFAP2C sites bound individually or co-bound with other TFs. e, Profile plots of TFAP2C and ESRRB motif distribution around the dyad of nucleosomes bound by ESRRB overlapping with or away from TFAP2C retained sites (left and right panels, respectively) in GETMR-48h cells. f, Micro-C pile-up heatmaps around nucleosome arrays containing retained (left) or lost (right) TFAP2C sites after adding ESRRB to GETM during early reprogramming. Maps plotted at 100 bp resolution. Yellow arrowheads indicate local cross-interactions. Schematic on top showing the co-binding of ESRRB and TFAP2C mediated by inter-nucleosome interactions. g, Immunoprecipitation of EOMES or ESRRB and western blot for TFAP2C in the presence of constant EOMES and increasing ESRRB (left) or constant ESRRB and increasing EOMES (right). The amount of each transfected plasmid encoding the corresponding TF is shown below. The bands representing TFAP2C, and antibody heavy chain (IgG-HC) are indicated. Representative image from n = 2 biological replicates. Molecular weight marker (KDa) is indicated. Raw blots are shown in Supplementary Fig. 1. h, Bar plot showing the reprogramming efficiency of MEFs to iPS cells using OSKM and TMR. Mean values of biological replicates (n = 4) with error bars representing ± s.d. i, Immunofluorescence of the indicated pluripotency markers (green fluorescence) in stable TMR iPS clonal lines. Bright field images showing typical morphology of the corresponding TMR-iPS cells. Nuclear DAPI staining (Blue) images are also shown. Representative image from n = 6 independent iPS clones shown in (j). Scale-bar = 100 µm. j, Gene expression of pluripotency markers by q-PCR from six independent TMR-iPS clones (n = 6) as compared to MEFs (negative control) and ESCs (positive control). Mean values of technical replicates (n = 2) with error bars representing ± s.d. k, Two stable TMR-iPS clonal lines carrying a tdTomato reporter in Rosa26 locus were used for chimera assays. Both lines display significant chimeric contribution as measured by tdTomato fluorescence across the whole embryo, which was equivalent the ES cells counterparts. Non-chimeric embryos were used as negative control. l, Sketch illustrating guided search model of TF combinatorial binding to signpost elements. In a standard random sampling, TFs transiently interact with low-affinity sites (dotted arrows), searching for gene regulatory targets (red bullseye). In guided search model, chromatin loops displaying oriented OSKM motifs (blue arrows) or loop junctions condensing GET/R motifs act as signposts that direct TF binding to their target enhancers.

References

    1. Heinz, S., Romanoski, C. E., Benner, C. & Glass, C. K. The selection and function of cell type-specific enhancers. Nat. Rev. Mol. Cell Biol.16, 144–154 (2015). - PMC - PubMed
    1. Spitz, F. & Furlong, E. E. Transcription factors: from enhancer binding to developmental control. Nat. Rev. Genet.13, 613–626 (2012). - PubMed
    1. Xu, J., Du, Y. & Deng, H. Direct lineage reprogramming: strategies, mechanisms, and applications. Cell Stem Cell16, 119–134 (2015). - PubMed
    1. Takahashi, K. & Yamanaka, S. Induction of pluripotent stem cells from mouse embryonic and adult fibroblast cultures by defined factors. Cell126, 663–676 (2006). - PubMed
    1. Benchetrit, H. et al. Extensive nuclear reprogramming underlies lineage conversion into functional trophoblast stem-like cells. Cell Stem Cell17, 543–556 (2015). - PubMed