. 2025 Feb;638(8050):553-561.
doi: 10.1038/s41586-024-08360-6. Epub 2024 Dec 18.

Hierarchical design of pseudosymmetric protein nanocages

Affiliations

Hierarchical design of pseudosymmetric protein nanocages

Quinton M Dowling et al. Nature. 2025 Feb.

Abstract

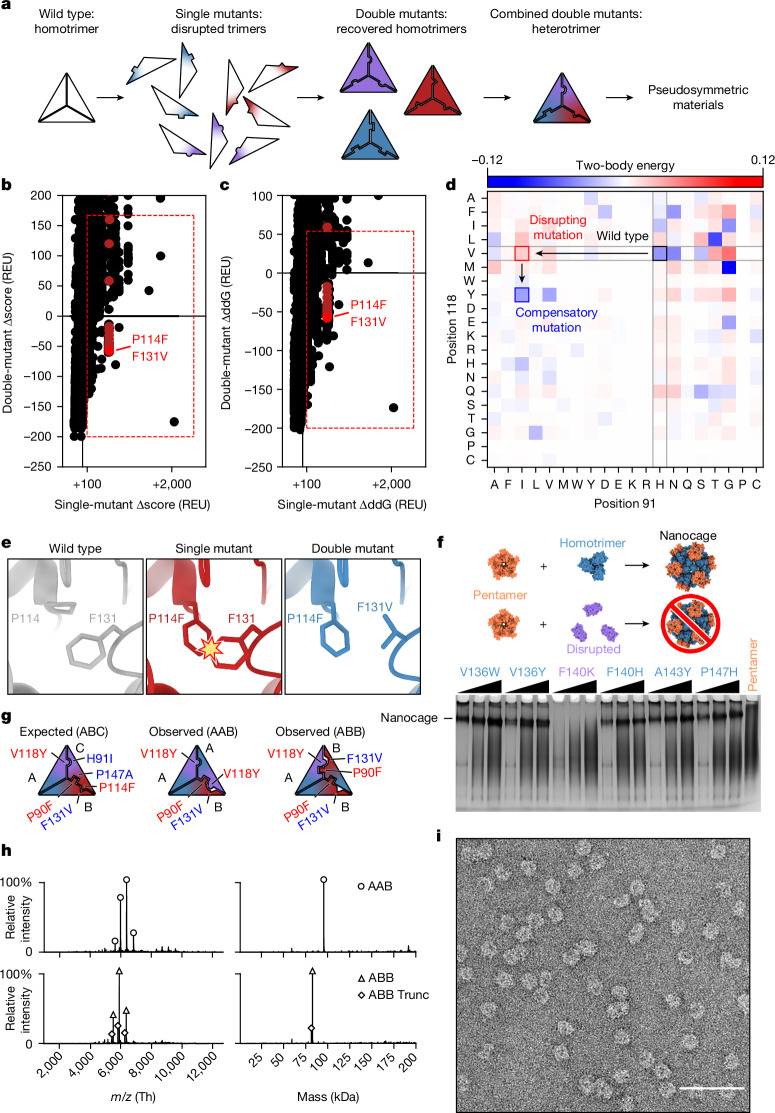
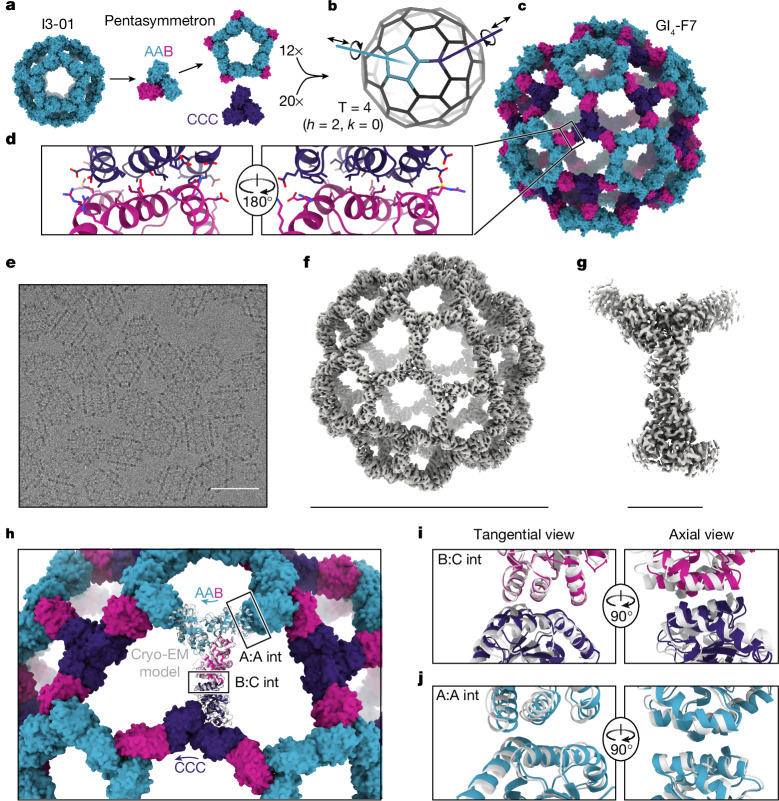
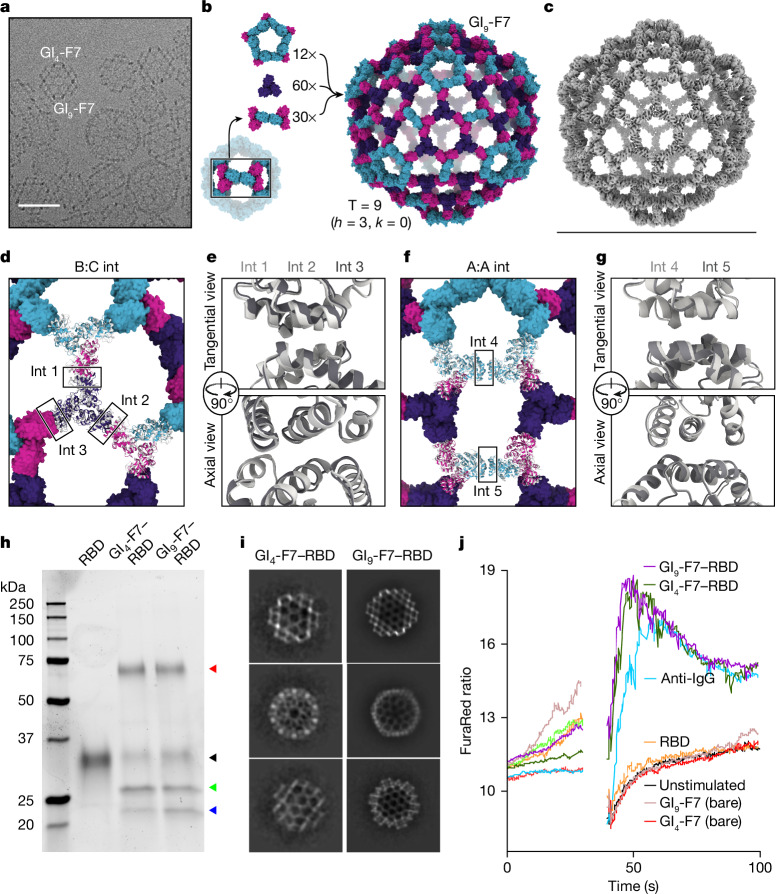
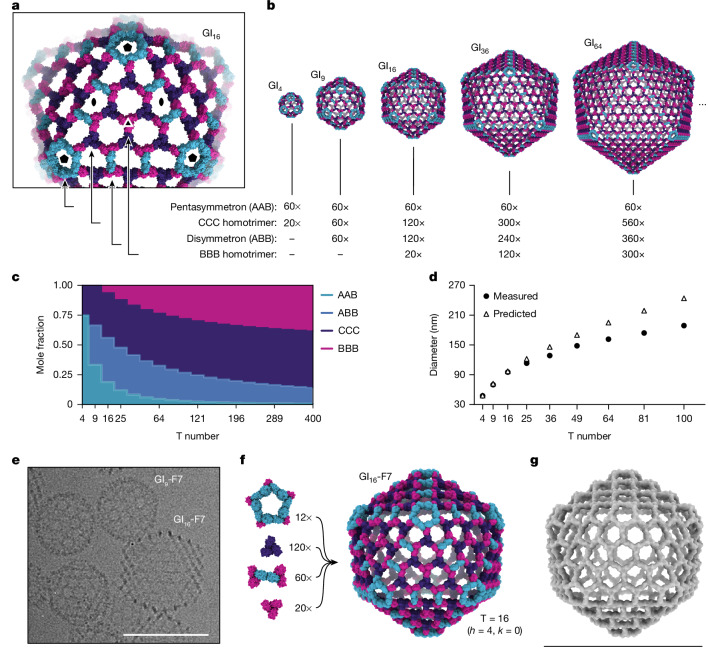
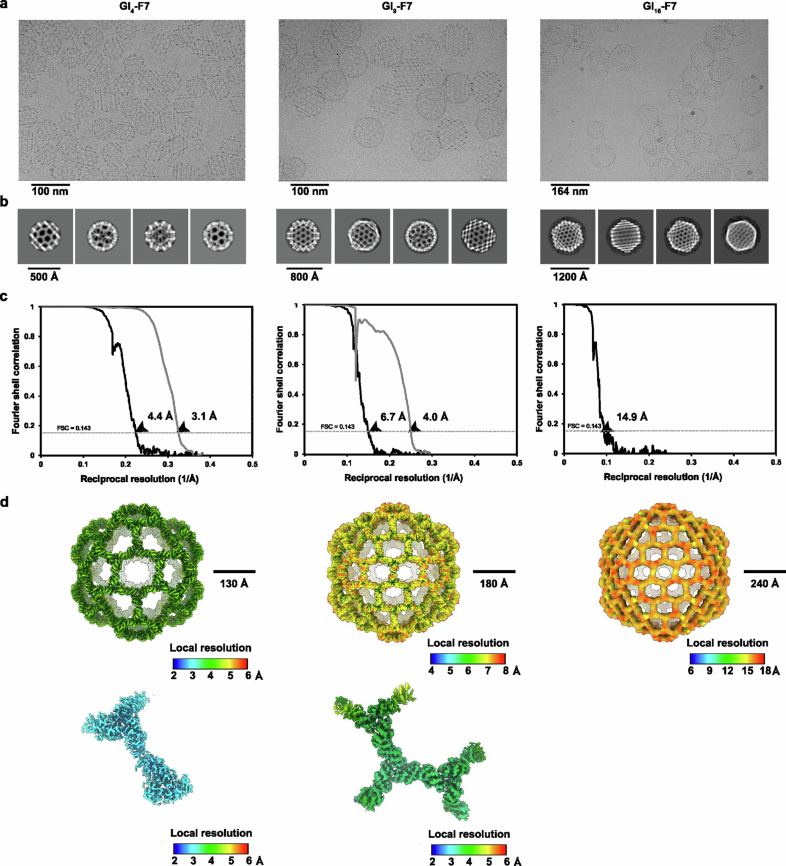
Discrete protein assemblies ranging from hundreds of kilodaltons to hundreds of megadaltons in size are a ubiquitous feature of biological systems and perform highly specialized functions1,2. Despite remarkable recent progress in accurately designing new self-assembling proteins, the size and complexity of these assemblies has been limited by a reliance on strict symmetry3. Here, inspired by the pseudosymmetry observed in bacterial microcompartments and viral capsids, we developed a hierarchical computational method for designing large pseudosymmetric self-assembling protein nanomaterials. We computationally designed pseudosymmetric heterooligomeric components and used them to create discrete, cage-like protein assemblies with icosahedral symmetry containing 240, 540 and 960 subunits. At 49, 71 and 96 nm diameter, these nanocages are the largest bounded computationally designed protein assemblies generated to date. More broadly, by moving beyond strict symmetry, our work substantially broadens the variety of self-assembling protein architectures that are accessible through design.


Conflict of interest statement

Competing interests: The authors declare no competing interests.

Figures

Fig. 1
Fig. 1. Design and characterization of a pseudosymmetric heterotrimer.
a, The design protocol starts with a homotrimer to which single trimer-disrupting mutations are introduced, followed by compensatory mutations that rescue trimer assembly. Sets of orthogonal mutations (depicted as red, purple and blue) are combined to generate a heterotrimer that can then be used as a component in pseudosymmetric materials. b,c, Calculated changes in Rosetta score (Δscore) (b) and predicted trimerization energy (ΔddG) (c) upon mutation were used to evaluate single mutants (horizontal axis) and double mutants (vertical axis). The red boxes enclose mutants that met selection criteria for further evaluation, and mutant pairs containing P114F, shown in e, are highlighted in red. REU, Rosetta energy units. d, Possible mutations were also evaluated by their co-evolution coupling matrix. Desirable mutations are those for which the single-mutant–wild-type pair is observed less frequently than expected (red; H91I/V118) and the double-mutant pair is observed more frequently than expected (blue; H91I/V118Y). e, An example of a productive mutant pair in which the wild-type residue F131 clashes with the mutant residue P114F and the second mutation F131V resolves the clash. f, Disruption of trimer geometry was assayed by assembling mutant I53-50A trimers in clarified E. coli lysates with purified I53-50B pentamer and evaluating the presence or absence of I53-50 nanocages by native PAGE. Here, F140K was identified as a disrupting single mutation. Black wedges indicate increasing pentamer concentration in the assembly reaction. Data are representative of three independent experiments. For gel source data, see Supplementary Fig. 1. g, Diagram of the expected ABC heterotrimer and the observed AAB and ABB heterotrimers. Disrupting mutations are labelled in red and compensatory mutations are in blue. h, Native mass spectrometry of AAB-enriched (top) and ABB-enriched (bottom) heterotrimer fractions purified by IMAC and SEC. ABB Trunc refers to a truncation product of the A chain in which the N-terminal ten residues of the protein were missing. i, Assembly of I53-50-like nanocages using an AAB/ABB mixture of I53-50A heterotrimer was verified by negative-stain electron microscopy. Scale bar, 100 nm.
Fig. 2
Fig. 2. Design and characterization of the 240-subunit GI4-F7 nanocage.
a, Schematic of pentasymmetron generation from I3-01 and the AAB heterotrimer. The A (cyan) subunits in the pentasymmetron retain the two-fold symmetric I3-01 nanocage interface, whereas the B (magenta) subunits are available for docking. b, Docking the pentasymmetron as a rigid body against CCC homotrimers (purple) yields 240-subunit, T = 4 assemblies. Translational and rotational degrees of freedom for the pentasymmetron and homotrimer components are indicated. c, A design model of GI4-F7. d, Detail of the computationally designed interface between the B and C subunits of GI4-F7 design model. e, Cryo-EM micrograph of assembled GI4-F7 nanocages embedded in vitreous ice. Scale bar, 50 nm f, The 4.4 Å resolution density map of the entire GI4-F7 nanocage. Scale bar, 49 nm. g, The 3.1 Å resolution density map from an asu obtained via symmetry-expansion and local refinement. Scale bar, 7.4 nm. h, Comparison of the cryo-EM structure derived from local refinement (grey ribbon) with the computational design model (coloured ribbons), aligned using a single copy of the asu. Arrows indicate rigid-body deviations of the pentasymmetron (cyan) and CCC homotrimer (purple). Int, interface. i,j, Detail of the rigid-body deviations from the design model at the B–C interface (i) and the A–A (I3-01) interface (j). In j, two neighbouring copies of the AAB heterotrimer from the full nanocage reconstruction and the design model were aligned.
Fig. 3
Fig. 3. Discovery and characterization of the 540-subunit GI9-F7 nanocage.
a, A cryo-electron micrograph showing GI4-F7 and GI9-F7 nanocages in the same preparation. Scale bar, 50 nm. b, Design model of GI9-F7, constructed from 12 pentasymmetrons, 60 CCC homotrimers and 30 disymmetrons. A subunits, cyan; B subunits, magenta; C subunits, purple. c, Cryo-EM map of GI9-F7 at 6.7 Å resolution. Scale bar, 71 nm. d, Comparison of a model derived from the cryo-EM map (grey) with the computational design model (other colours), aligned using a single asu (shown in cartoon). The three independent copies of the B:C interface in the asu are indicated. e, Alignment of int 1 (light grey), int 2 (medium grey) and int 3 (dark grey) from the cryo-EM model. f, Alignment of two neighbouring copies of AAB heterotrimers from the cryo-EM model to the design model. The two independent copies of the A:A (I3-01) interface, located in the pentasymmetron (int 4) and the disymmetron (int 5), are indicated. g, Alignment of the two A:A (I3-01) interfaces from the cryo-EM model, int 4 (light grey) and int 5 (medium grey). h, SDS–PAGE of antigen-bearing GI4-F7 and GI9-F7 nanocages. RBD–SpyTag (left lane) was conjugated to CCC–SpyCatcher in either GI4-F7 or GI9-F7 nanocages. Red arrowhead, conjugated CCC–RBD; black arrowhead, residual RBD–SpyTag; green arrowhead, A subunit from AAB and ABB and B subunit from BBB; blue arrowhead, B subunit from AAB and ABB. For gel source data, see Supplementary Fig. 5. i, Representative 2D class averages from negative-stain electron microscopy of RBD-conjugated GI4-F7 or GI9-F7 nanocages. j, Representative plot of Ca2+ flux induced by BCR signalling in RAMOS cells that stably express the SARS-CoV-2 spike-specific antibody COVA2-15 as an IgG BCR. Cell lines were stimulated with various antigens with 4 µg ml−1 RBD after reading a 30 s baseline. Data are representative of two independent experiments.
Fig. 4
Fig. 4. Generation of pseudosymmetric nanocages with extensible hexagonal lattice facets.
a, The four types of trimers required to generate pseudosymmetric nanocages with T numbers ≥16, viewed in the context of the GI16-F7 design model. Icosahedral five-fold, two-fold and three-fold symmetry axes are indicated. b, Design models and corresponding building block stoichiometries of GI4-F7, GI9-F7, GI16-F7, GI36-F7 and GI64-F7 nanocages. The stoichiometries listed indicate the number of each kind of trimeric component. c, Graphical depiction of trimer stoichiometry as a function of T number. d, Theoretical nanocage diameters and Z-average hydrodynamic diameters measured by DLS as a function of trimer stoichiometry used during in vitro assembly (indicated by T number). Data are representative of two independent experiments. e, Cryo-electron micrograph of a sample containing GI9-F7 and GI16-F7 nanocages. Scale bar, 100 nm. f, Composition and design model of the GI16-F7 nanocage. g, The 14.9 Å resolution cryo-EM map of GI16-F7. Scale bar, 96 nm.
Extended Data Fig. 1
Extended Data Fig. 1. “ABC” design and purification and characterization of “ABC” tricistronic and “AB” bicistronic constructs.
a, ΔddG filter metric. b, ΔScore metric. Dark red points correspond to the single mutation P114F. The bright red point corresponds to the double mutant P114F/F131V. The red dotted boxes represent cutoffs used to select mutants for testing. c, Recovery of trimer geometry was assayed by assembling double mutant I53-50A trimers in clarified E. coli lysates with purified I53-50B pentamer and evaluating the presence or absence of I53-50 nanocages by native PAGE. Black wedges indicate increasing pentamer concentration in each series of assembly reactions. For gel source data, see Supplementary Fig. 2. d, The ABC heterotrimer was purified by IMAC with a step elution followed by e, StrepTrap purification. The A chain contained a hexa-histidine and SUMO tag, the B chain contained a Strep tag, and the C chain contained sfGFP and avi tags. The eluate of this two-step purification method should therefore only contain trimers that include both the A and B chains. An optimal result would be equimolar amounts of the A, B, and C chains. f, SDS-PAGE of the StrepTrap purification revealed that the eluate contained an excess of the A and B chains and less of the C chain. For gel source data, see Supplementary Fig. 3. To test the ability of the A and B chains only to assemble into heterotrimers, we expressed an AB bicistronic gene and g, purified the resulting proteins by IMAC with a gradient elution. Two broad and overlapping peaks were observed. The leading half of the first peak and trailing half of the second peak were collected and h, further purified by SEC. Peak 2 has a lower retention volume than peak 1, suggesting a difference in molecular weight. These results are consistent with assembly of an ABB heterotrimer (earlier IMAC elution, later SEC elution) and an AAB heterotrimer (later IMAC elution, earlier SEC elution). We confirmed this interpretation by native mass spectrometry (Fig. 1g).
Extended Data Fig. 2
Extended Data Fig. 2. Screening of GI4 designs and in vitro assembly of GI4-F7 from purified components.
Expression and screening by SDS-PAGE for GI4 designs a, GI4-F2, b, GI4-F6 and c, GI4-F7. Bands for chains A (green arrow), B (blue arrow), and C (red) arrow are indicated. The presence of all three bands in the Ni2+ Elute lanes of GI4-F6 and GI4-F7 indicates interactions between the A, B, and C chains. For gel source data, see Supplementary Fig. 4. d, HisTrap elution chromatogram of AB bicistronic expression. Blue, absorbance at 280 nm; red, gradient elution. Peak 1 (P1) is predominantly ABB, P2 is predominantly AAB, and P3 is predominantly the A chain, which assembles into 60-subunit I3-01-like nanocages. e, Superdex 200 Increase 10/300 chromatogram of P1 from the HisTrap elution. The first peak following the void volume (1) is predominantly I3-01-like nanocages and (2) is predominantly ABB heterotrimer. f, Superdex 200 Increase 10/300 chromatogram of P2 from the HisTrap elution. (1) is predominantly I3-01-like nanocages and (2) is predominantly AAB heterotrimer. g, Superdex 200 Increase 10/300 chromatogram of P3 from the HisTrap elution. (1) is predominantly I3-01-like nanocages and (2) is predominantly AAB heterotrimer. h, SEC purification of GI4-F7 on a Sephacryl S-500 HR 10/300 GL column. Peak 1 contains the assembly while peak 2 is residual homotrimer component.
Extended Data Fig. 3
Extended Data Fig. 3. CryoEM data processing.
(a-b) Representative electron micrographs a, and 2D class averages b, of GI4-F7 (left), GI9-F7, (middle) and GI16-F7 (right). c, Gold-standard Fourier shell correlation curves for the 3D reconstructions of GI4-F7 (left), GI9-F7 (middle) and GI16-F7 (right) (black line) and locally refined asus (gray lines). The 0.143 cutoff is indicated by a horizontal dashed line. (d-e) Local resolution maps calculated using cryoSPARC for d, the 3D reconstructions of GI4-F7 (left) and locally refined asu (left, bottom), GI9-F7 (middle) and locally refined asu (middle, bottom), and GI16-F7 (right).
Extended Data Fig. 4
Extended Data Fig. 4. Structural details of GI4-F7.
a, Alignment of the complete cryoEM model to the design model. Major rigid-body DoF deviations are indicated with arrows. Two views of the asu are shown. Approximate locations of each inset (B, C, and D) are indicated. b, Comparison between the cryoEM model (left) and design model (right) of the newly designed nanocage (B-C) interface. Top row, M57 on the CCC-homotrimer changes rotamer to occupy a void in the interface in the design model. Bottom row, F57 on the B chain of the AAB heterotrimer packs against S187 of the CCC homotrimer in the cryoEM model, instead of A190 in the CCC homotrimer as in the design model. c, Comparison of the I3-01 (A-A) interface observed in the cryoEM model to a previously published structure (PDB ID 8ED3; ref. 78). Top row, slight rigid-body deviations from perfect two-fold symmetry in one copy of the A chain. Bottom row, very little deviation from perfect two-fold symmetry. d, Details of the density maps in the regions of the pseudosymmetry-generating mutations within the AAB heterotrimer interface. e, Pseudosymmetric heterotrimer colored by Cα-RMSD to the design model. The positions of the pseudosymmetry-generating mutations are indicated. f, Alignment of the AAB heterotrimer cryoEM model to the design model is viewed from the top, towards the center of the nanocage along the three-fold symmetry axis; g, from the side, tangential to the nanocage surface; and h, from the other side, tangential to the nanocage surface. The position of the A:A and newly designed B:C interfaces are indicated. i, Detail of the B side of the B:C interface, highlighting the most significant deviations from the design model. j, Deviations observed in the cryoEM reconstruction of GI4-F7 compared to the design model.
Extended Data Fig. 5
Extended Data Fig. 5. Discovery and structural details of GI9-F7.
a, CryoEM field view micrograph of samples enriched for GI9-F7 by SEC purification. Both GI9-F7 (large particles) and GI4-F7 (e.g., bottom-left corner) are clearly visible. b, Table of deviations observed in the cryoEM reconstruction of GI9-F7 compared to the design model. (c-e) Alignment of the GI9-F7 design model chain B (magenta) and chain C (purple) protein-protein interface to the corresponding chains of the cryoEM model (gray). Each of the three interfaces between B and C chains in the asu are shown. f, The protein-protein interface between chain B and C from the cryoEM model of GI4-F7 (light colors) aligned to the same interface from the cryoEM model of GI9-F7 (dark colors). g, Alignment of design model to the cryoEM model for the I3-01 interface in the pentasymmetron and g, disymmetron. h, Alignment of the I3-01 interface from the cryoEM models of GI4-F7 (light blue) and GI9-F7 (dark blue).
Extended Data Fig. 6
Extended Data Fig. 6. Hexagonal 2D array characterization by negative stain EM.
a, An example of the regular hexagonal array formed by mixing BBB and CCC homotrimers by negative stain EM. b, Power spectrum of the micrograph shown in panel A, confirming the periodic arrangement of the array. c, The edge of the array is jagged, with free trimeric components visible. d, Measurement of the array dimensions are consistent with e, the design model.

Update of

Similar articles

Cited by

References

    1. Alberts, B. The cell as a collection of protein machines: preparing the next generation of molecular biologists. Cell92, 291–294 (1998). - PubMed
    1. Goodsell, D. S. & Olson, A. J. Structural symmetry and protein function. Annu. Rev. Biophys. Biomol. Struct.29, 105–153 (2000). - PubMed
    1. King, N. P. & Lai, Y.-T. Practical approaches to designing novel protein assemblies. Curr. Opin. Struct. Biol.23, 632–638 (2013). - PubMed
    1. Douglas, T. & Young, M. Viruses: making friends with old foes. Science312, 873–875 (2006). - PubMed
    1. Howorka, S. Rationally engineering natural protein assemblies in nanobiotechnology. Curr. Opin. Biotechnol.22, 485–491 (2011). - PubMed

MeSH terms

LinkOut - more resources