. 2025 Jul;643(8070):201-209.
doi: 10.1038/s41586-024-08348-2. Epub 2024 Dec 18.

Lithocholic acid binds TULP3 to activate sirtuins and AMPK to slow down ageing

Affiliations

Lithocholic acid binds TULP3 to activate sirtuins and AMPK to slow down ageing

Qi Qu et al. Nature. 2025 Jul.

Abstract

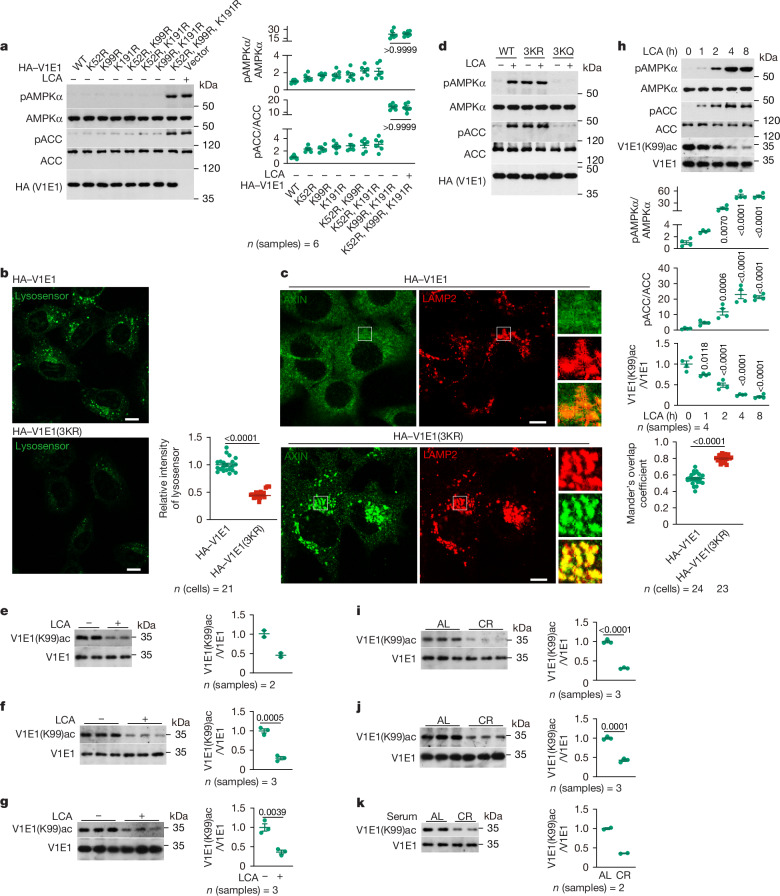
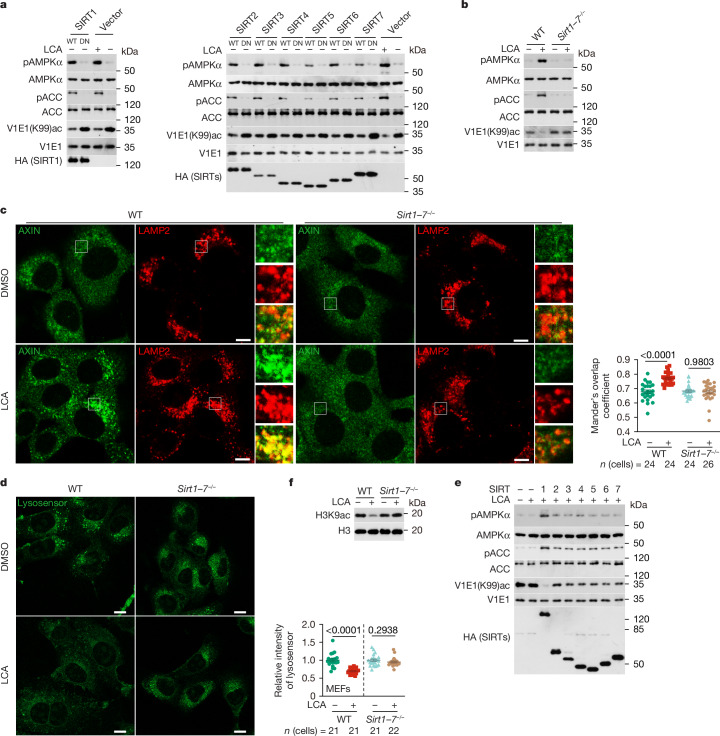
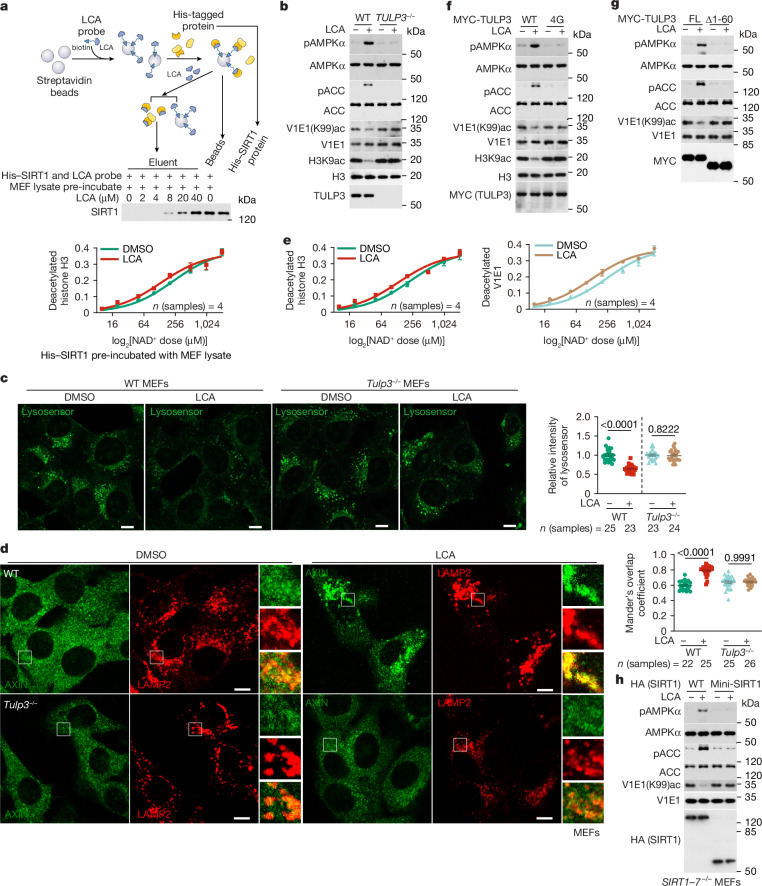
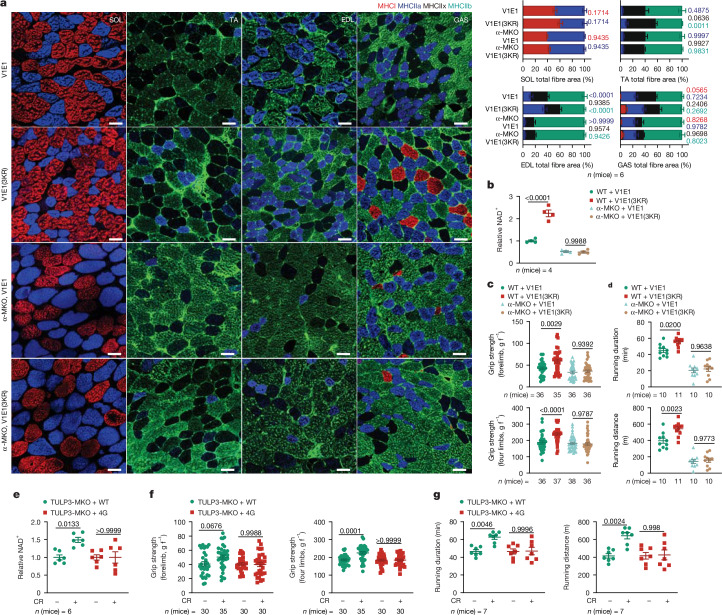
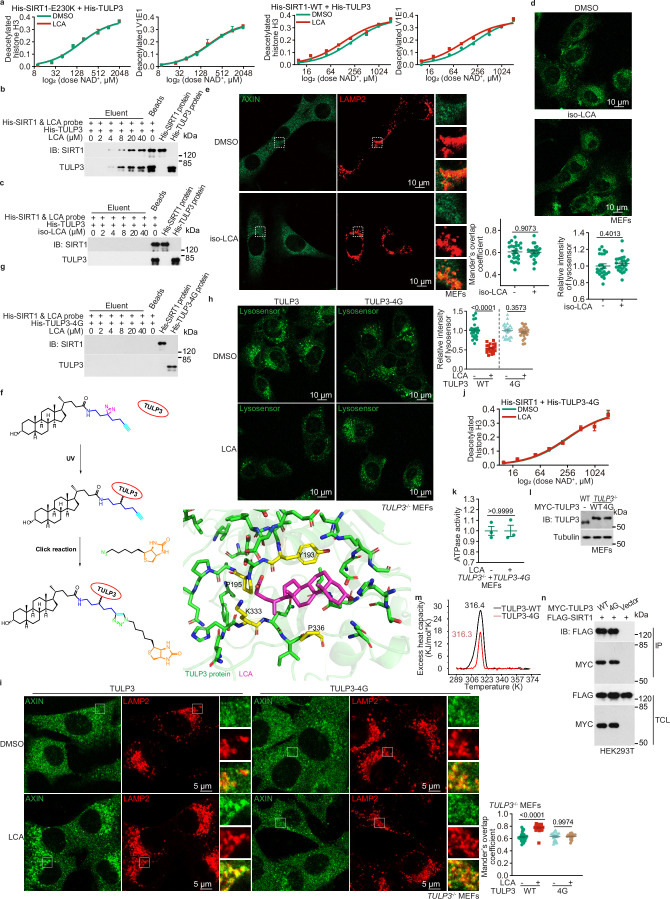
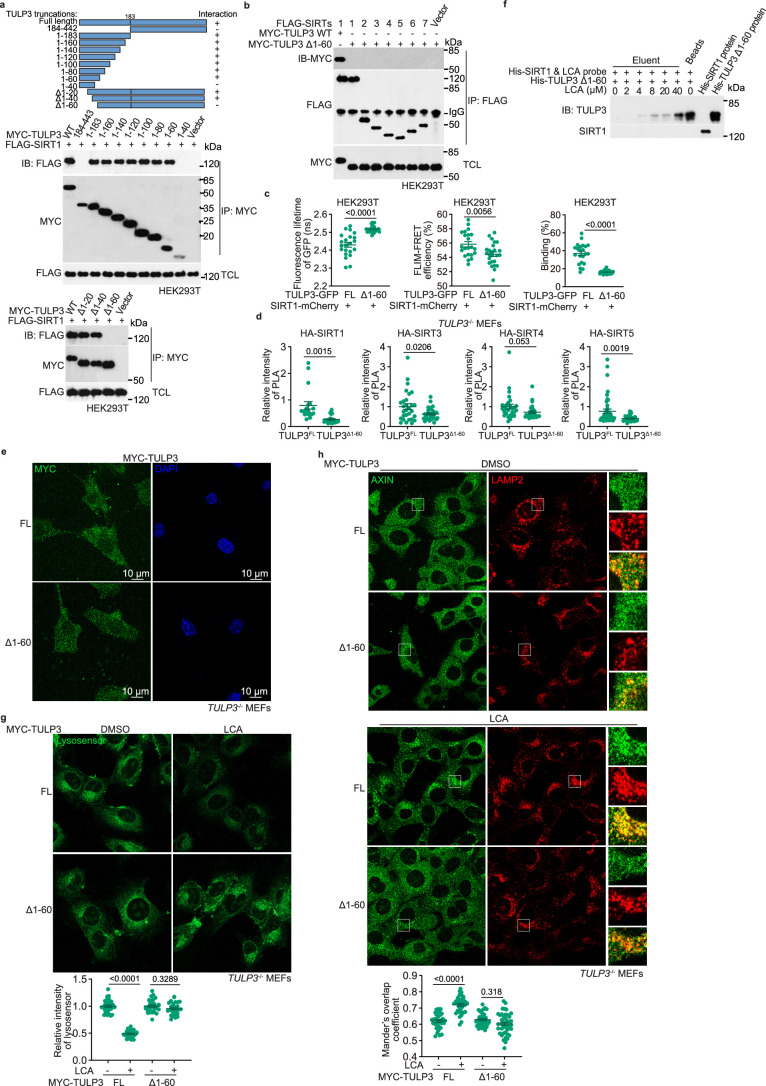
Lithocholic acid (LCA) is accumulated in mammals during calorie restriction and it can activate AMP-activated protein kinase (AMPK) to slow down ageing1. However, the molecular details of how LCA activates AMPK and induces these biological effects are unclear. Here we show that LCA enhances the activity of sirtuins to deacetylate and subsequently inhibit vacuolar H+-ATPase (v-ATPase), which leads to AMPK activation through the lysosomal glucose-sensing pathway. Proteomics analyses of proteins that co-immunoprecipitated with sirtuin 1 (SIRT1) identified TUB-like protein 3 (TULP3), a sirtuin-interacting protein2, as a LCA receptor. In detail, LCA-bound TULP3 allosterically activates sirtuins, which then deacetylate the V1E1 subunit of v-ATPase on residues K52, K99 and K191. Muscle-specific expression of a V1E1 mutant (3KR), which mimics the deacetylated state, strongly activates AMPK and rejuvenates muscles in aged mice. In nematodes and flies, LCA depends on the TULP3 homologues tub-1 and ktub, respectively, to activate AMPK and extend lifespan and healthspan. Our study demonstrates that activation of the TULP3-sirtuin-v-ATPase-AMPK pathway by LCA reproduces the benefits of calorie restriction.


Conflict of interest statement

Competing interests: The authors declare no competing interests.

Figures

Fig. 1
Fig. 1. LCA causes v-ATPase deacetylation to activate AMPK.
ac, Deacetylation of the V1E1 subunit on K52, K99 and K191 leads to AMPK activation. MEFs were infected with lentivirus carrying HA-tagged V1E1 or various V1E1 mutants, including V1E1(3KR) (mimicking the deacetylated state of V1E1). a, Image (left) and quantification (right) of AMPK activation by different V1E1 mutants determined by immunoblotting (IB; blots hereafter are from IB). b,c, Images (left) and quantification (right) of v-ATPase inhibition (b) and lysosomal localization of AXIN (c). Scale bars, 10 µm. d, The acetylation state of V1E1 controls AMPK activation. MEFs stably expressing V1E1(3KR) or V1E1(3KQ) (mimicking the constitutively acetylated state) were treated with 1 μM LCA for 4 h, followed by determination of AMPK activation. eg,i–k, Images (left) and quantification (right) showing that CR or LCA treatment causes V1E1 deacetylation. MEFs were treated with 1 μM LCA for 4 h (e) or cultured in DMEM with FBS supplemented in the medium replaced with an equal volume of serum from mice subjected to CR for 4months (k). Mice were subjected to CR for 4 months (i,j) and fed with 1 g l–1 (2-hydroxypropyl)-β-cyclodextrin-coated LCA in drinking water for 1 month (f,g). V1E1(K99)ac levels were measured in MEFs (e,k), muscles (f,i) and livers (g,j). h, Image (top) and quantification (bottom) showing that V1E1(K99)ac is inversely correlated with AMPK activation during LCA treatment. MEFs were treated with 1 μM LCA for the indicated times followed by determination of AMPK activation (top and middle) and V1E1(K99)ac (bottom). Statistical results are shown as the mean ± s.e.m. Specific numbers of samples or cells used are labelled on each panel. P values (shown on the charts) were calculated using one-way analysis of variance (ANOVA) followed by Kruskal–Wallis test (a), two-way ANOVA followed by Tukey’s test (h), two-sided Mann–Whitney test (b), two-sided Student’s t-test with Welch’s correction (c) or two-sided Student’s t-test (dg,ik). Experiments were performed three (bk) or five (a) times. Source Data
Fig. 2
Fig. 2. Sirtuins are required for the deacetylation of v-ATPase.
a, Sirtuins are responsible for V1E1 deacetylation and AMPK activation. HEK293T cells were infected with lentiviruses carrying individual wild-type (WT) sirtuins (HA-tagged SIRT1–SIRT7) or their dominant negative (DN) forms, followed by determination of V1E1 acetylation and AMPK activity. bd, Sirtuins are required for LCA-induced V1E1 deacetylation. Sirt17–/– MEFs were treated with 1 μM LCA for 4 h, followed by determination of AMPK activation (b), v-ATPase activity (d; assessed by imaging (left) and quantifying (right) intensities of the lysosensor), and lysosomal localization of AXIN (c; assessed by imaging (left) and quantifying (right) the co-localization of AXIN with the lysosomal marker LAMP2). Scale bars, 6 µm (c) or 10 µm (d). e, Sirtuin members have complementary roles in mediating LCA-induced V1E1 deacetylation and AMPK activation. Sirt1–7–/– MEFs were individually infected with lentivirus carrying seven members of the sirtuin family, followed by treatment with 1 μM LCA for 4 h. AMPK activity and V1E1 acetylation were then determined. f, LCA stimulates the activity of sirtuins. WT and Sirt17–/– MEFs were treated with 1 μM LCA for 4 h, followed by determination of H3K9 acetylation (H3K9ac). Statistical results are shown as the mean ± s.e.m. Specific numbers of cells used are labelled on each panel. P values (shown on the charts) were calculated using two-sided Student’s t-test with Welch’s correction (WT, d), two-sided Mann–Whitney test (Sirt1–7–/–, d), or two-way ANOVA followed by Tukey’s text (c). Experiments were performed three (a,cf) or four (b) times. Source Data
Fig. 3
Fig. 3. TULP3 is the binding protein of LCA for activation of sirtuins.
a, Purified bacterially expressed SIRT1 requires a cytosolic partner for binding to LCA. Top, schematic of the experiment. His-tagged SIRT1, pre-incubated with cellular lysates from MEFs, was incubated with 5 μM LCA. Bottom, the deacetylase activities of such pre-incubated SIRT1 towards histone H3 and the affinity of SIRT1 towards LCA were determined. bd, TULP3 is required for SIRT1-mediated AMPK activation by LCA. MEFs with Tulp3 knocked out (clone 1 of Tulp3/– MEFs, and the same hereafter for all Tulp3 knockout experiments) were treated with 1 μM LCA for 4 h. b, Determination of AMPK activation and of V1E1 and histone H3 acetylation. c, Images (left) and quantification (right) of v-ATPase activity. d, Images (left) and quantification (right) of lysosomal localization of AXIN. Scale bars, 10 µm (c,d). e, TULP3 binds LCA and mediates SIRT1 activation. Experiments were performed as in a, except that the bacterially expressed His-tagged SIRT1 was co-eluted with bacterially expressed His-tagged TULP3 on a Superdex column before the experiment. f, TULP3(4G) is unable to bind LCA and blocks LCA-induced activation of AMPK. Tulp3–/– MEFs were infected with lentivirus carrying the TULP3(4G) mutant, followed by treatment with LCA as in b. The activities of AMPK were then determined by IB. g,h, Interaction between TULP3 and sirtuins is required for AMPK activation by LCA. Tulp3−/− (g) or SIRT1-7−/− (h) MEFs were infected with lentivirus carrying MYC-tagged TULP3(Δ1–60) (g) or HA-tagged mini-SIRT1 (h), both of which are mutants that disrupt the interaction between TULP3 and SIRT1. Cells were then treated with LCA as in b, followed by determination of AMPK activation. Statistical results are shown as the mean ± s.e.m. Specific numbers of samples used are labelled on each panel. P  values (shown on the charts) were calculated using two-sided Student’s t-test (Tulp3/–, c), two-sided Student’s t-test with Welch’s correction (WT, c) or two-way ANOVA followed by Tukey’s test (d). Experiments were performed three (a,ch) or four (b) times. The schematic in a was created using elements from Servier Medical Art under a Creative Commons Attribution 3.0 unported licence. Source Data
Fig. 4
Fig. 4. The LCA–TULP3–sirtuin–v-ATPase axis exerts rejuvenating effects.
a, V1E1(3KR) induces oxidative fibre conversion in the muscles of aged mice. Images (left) and quantification (right) of muscle fibre types from WT mice and muscle-specific Ampka knockout (α-MKO) mice with muscle-specific expression of V1E1(3KR) (induced by tamoxifen at 16 months old; see the section ‘Mouse strains’ in the Methods for the procedures for constructing this strain). GAS, gastrocnemius; EDL, extensor digitorum longus; SOL, soleus; TA, tibialis anterior. Scale bars, 50 µm. b, V1E1(3KR) induces increases in muscle NAD+ levels in aged mice. Mice were treated as in a, followed by determination of NAD+ levels in the gastrocnemius muscle. c,d, V1E1(3KR) promotes muscle strength and running duration in aged mice. Mice were treated as in a, followed by determination of the grip strength (c) and running duration (d). eg, TULP3(4G) blocks improvement of muscle function by CR in aged mice. Muscle-specific Tulp3 knockout (TULP3-MKO) mice with muscle TULP3(4G) (or WT TULP3 expression (induced by tamoxifen at 16 months old, see validation data in Extended Data Fig. 12i) were subjected to CR for 3.5 months, followed by determination of NAD+ levels (e), grip strength (f) and running duration and distance (g). Statistical results are shown as the mean ± s.e.m. Specific numbers of mice used are labelled on each panel. P values (shown on the charts) were calculated using two-way ANOVA followed by Tukey’s test. Experiments were performed three times. Source Data
Extended Data Fig. 1
Extended Data Fig. 1. LCA activates AMPK through the lysosomal AMPK pathway.
a, LCA triggers lysosomal translocation of AXIN. MEFs were incubated with 1 μM LCA for 4 h, followed by immunostaining to determine the lysosomal localization of AXIN (accessed by the co-localization, i.e., the Mander’s overlap coefficients, with the lysosomal marker LAMP2). Results are shown as mean ± s.e.m.; n = 29 (DMSO) or 20 (LCA) cells, and P value by two-sided Student’s t-test with Welch’s correction. b, LCA triggers lysosomal translocation of LKB1. Wildtype and AXIN knockout (AXIN−/−) MEFs were incubated with 1 μM LCA for 4 h, followed by immunostaining to determine the lysosomal translocation of LKB1. Mander’s overlap coefficients are shown as mean ± s.e.m.; n = 26 (DMSO, WT) 32 (LCA, WT), 24 (DMSO, AXIN−/−) or 28 (LCA, AXIN−/−) cells, and P value by two-way ANOVA, followed by Tukey. c, LCA induces the formation of the lysosomal AMPK-activating complex. MEFs were treated with 1 μM LCA for 4 h, and the cell lysates were immunoprecipitated (IP) with an antibody against AXIN. Immunoblotting (IB) reveals that AXIN co-immunoprecipitates with v-ATPase, Ragulator, AXIN and LKB1. TCL, total cell lysate. d, e, LCA inhibits v-ATPase. MEFs were incubated with 1 μM LCA for 4 h, followed by determination of the activity of v-ATPase (d, accessed by the decreased intensities of the Lysosensor that monitors acidification of lysosomes; representative images are shown on the left panel, and the statistical analysis data on the right as mean ± s.e.m., normalized to the DMSO group; n = 21 (DMSO) or 23 (LCA) cells, and P value by two-sided Mann-Whitney test) and the proton transport rates of v-ATPase in vitro (e, data are shown as mean ± s.e.m., normalized to the DMSO group; n = 3 replicates, and P value by two-sided Student’s t-test). f-n, The lysosomal AMPK pathway is required for the LCA-induced AMPK activation. HEK293T cells with ATP6v0c (v0c) knockdown (shATP6v0c; f), MEFs with AXIN knockout (g), LAMTOR1 knockout (LAMTOR1−/−; h-j), mice with liver- or muscle-specific LAMTOR1 knockout (LAMTOR1-LKO, in k; LAMTOR1-MKO, in l), or mice with liver- or muscle-specific AXIN knockout (AXIN1-LKO, in m; or AXIN1/2-MKO, in n), were treated with LCA at 1 μM for 4 h (f-j; for cells) or at 1 g/l with LCA coated with (2-hydroxypropyl)-β-cyclodextrin in drinking water for 1 month (k-n; for mice), followed by determination for AMPK activation (f-h, k-n; the levels of p-AMPKα and p-ACC) by immunoblotting, the v-ATPase inhibition (i, see representative images on the left panel, and the statistical analysis data on the right panel), and the lysosomal translocation of AXIN evidenced by co-localization with LAMP2 (j, see representative images on the left panel, and the statistical analysis data on the right panel). Results in i, j are shown as mean ± s.e.m. (in i, data are normalized to the DMSO group); n = 22 (DMSO group of i), 25 (LCA group of i), 29 (DMSO group of j) or 23 (LCA group of j) cells, and P value by two-sided Student’s t-test. Experiments in this figure were performed three times, except a and d four times. Source Data
Extended Data Fig. 2
Extended Data Fig. 2. LCA activates the lysosomal AMPK pathway downstream of the low glucose sensor aldolase-TRPV axis.
a, Glucose decline in CR mice does not suffice to cause AMPK activation. Levels of blood glucose (upper panel), muscle FBP (lower panel), and the activity of muscle AMPK (middle panel) were determined in mice subjected to starvation for 4 h, 8 h, 12 h, 16 h, and 20 h, or CR, at indicated times of the day. Results are shown as mean ± s.e.m.; n = 5 (blood glucose of CR and starvation groups) or 4 (others) mice for each time point, and P value by two-way ANOVA followed by Tukey’s test. b, CR leads to a constant activation of AMPK in muscle. Mice were subjected to CR for 4 months, followed by determination of the muscular AMPK activation at different times of the day. c-h, LCA triggers the lysosomal AMPK pathway downstream of aldolase and TRPVs. MEFs with knockdown of aldolase A-C (ALDO-KD) and re-introduced with ALDOA-D34S that mimics high glucose/FBP condition (c-e), or MEFs with TRPV1-4 knockout (f-h; TRPV-QKO, blocking signalling from low glucose to AMPK activation), were incubated in normal (c, f-h) or glucose-free (c-e) medium (Glc starvation) containing 1 μM LCA for 4 h, followed by determination for AMPK activation (c, f), v-ATPase inhibition (d, g), and lysosomal localization of AXIN (e, h). Statistical analysis data are shown as mean ± s.e.m., where d and g were normalized to the DMSO group; n = 25 (ALDOA-WT + DMSO and ALDOA-D34S + DMSO of d), 21 (TRPV-QKO + LCA of g and TRPV-QKO + LCA of h), 23 (ALDOA-WT + LCA of e and TRPV-QKO + DMSO of h), 24 (ALDOA-WT + DMSO of e), or 20 (others) cells; and P value by two-sided Student’s t-test (d, ALDOA-WT), two-sided Student’s t-test with Welch’s correction (d, ALDOA-D34S; and g), or two-way ANOVA followed by Tukey’s test (e). Experiments in this figure were performed three times. Source Data
Extended Data Fig. 3
Extended Data Fig. 3. LCA triggers the lysosomal AMPK pathway through deacetylation of v-ATPase.
a, Deacetylation is required for LCA-induced activation of AMPK. MEFs were pre-treated with 2 μM TSA and 8 mM NAM for 12 h, followed by incubating with 1 μM LCA for 4 h. Cells were then lysed, and the AMPK activities were determined by immunoblotting. b-e, V1E1-3KR renders the lysosomal AMPK pathway constitutively active. HEK293T with ectopic expression of V1E1, V1E1-3KR (d; triple mutation of K52, K99 and K191 of V1E1 to arginine; mimicking the deacetylated state of V1E1), or other single K to R mutations (b) of V1E1, or MEFs with stable expression of single, double, or triple mutation of K52, K99 and K191 residues (c) were lysed, followed by determination of the activity of AMPK (b, in which the statistical analysis results are shown as mean ± s.e.m.; n = 4 replicates for each treatment, and P value by two-sided Student’s t-test; and d) or the expression levels of V1E1 (c, e). f, V1E1-3KQ impairs the LCA-induced lysosomal translocation of AXIN and v-ATPase inhibition. MEFs with stable expression of V1E1-3KQ, mimicking the constitutively acetylated states of V1E1, were treated with 1 μM LCA for 4 h, followed by determination of the activity of v-ATPase (upper panel), and the lysosomal localization of AXIN (lower panel). Statistical analysis data are shown as mean ± s.e.m.; n = 23 (right panel, LCA group) or 22 (others) cells for each treatment, and P value by two-sided Student’s t-test. g-j, V1E1-3KR activates AMPK through the lysosomal pathway. LAMTOR1−/− (g-i) and AXIN−/− (j) MEFs, and control MEFs, were infected with lentivirus carrying HA-tagged V1E1-3KR, followed by determination for AMPK activation (g, j), activity of v-ATPase (h), and the lysosomal localization of AXIN (i). Statistical analysis data in h, i are shown as mean ± s.e.m.; n = 20 (h), 22 (V1E1 of i) or 23 (V1E1-3KR of i) cells, and P value by two-sided Student’s t-test. k, Acetylation does not affect ubiquitination of V1E1. HEK293T cells were transfected with HA-tagged V1E1 or V1E1-3KR, along with FLAG-tagged Ub. At 12 h post-transfection, cells were treated with 20 nM MG-132 for another 12 h, and the ubiquitination levels of V1E1 were determined by immunoprecipitation of HA-tag, followed by immunoblotting (left panel). See also the right panel for the AMPK activation in MEFs after treatment of 20 nM MG-132 for 12 h and 1 μM LCA for 4 h. l, Validation of the antibody against K99-acetylated V1E1. HEK293T cells were transfected with V1E1-K99R, or V1E1-K52R, V1E1-K191R and the wildtype V1E1 as controls, followed by determination of the reaction specificity of the Ac-K99-V1E1 antibody by immunoblotting. Experiments in this figure were performed three times, except b four times. Source Data
Extended Data Fig. 4
Extended Data Fig. 4. LCA promotes sirtuins to deacetylase v-ATPase.
a, Sirtuins, but not HDACs, deacetylate V1E1 and activate AMPK. HEK293T cells were infected with lentiviruses carrying HA-tagged HDAC1 to HDAC11, followed by determination of the acetylation of V1E1 and the activation of AMPK. The effects of sirtuins on AMPK activation are shown in Fig. 2a. b, Sirtuins inhibit v-ATPase. HEK293T cells infected with lentiviruses carrying each sirtuin (HA-tagged SIRT1 to SIRT7), or its dominant negative (DN) form, were subjected to determine the activity of v-ATPase by immunostaining. Representative images are shown, and the statistical analysis data are mean ± s.e.m., normalised to the WT group of each sirtuin; n = 21 (SIRT2-DN and SIRT4-DN), 26 (SIRT3-DN), 23 (SIRT5-DN), 22 (SIRT6-DN) or 20 (others), and P value by two-sided Student’s t-test (SIRT4, SIRT5 and SIRT7) or two-sided Student’s t-test with Welch’s correction (others). c-j, Sirtuins redundantly mediate the activation of AMPK by LCA. MEFs with SIRT1 (c), SIRT2 (e), SIRT3 (f), SIRT4 (g), SIRT5 (h), SIRT6 (i), or SIRT7 (j) knockout, or pre-treated with 10 μM EX-527 for 12 h to inhibit SIRT1 (d), were treated with 1 μM LCA for 4 h, followed by determination of AMPK activation and the V1E1 acetylation by immunoblotting. k, SIRTs are not required for regulating the basal acetylation levels of V1E1. MEFs with single knockout of SIRTs 1-7, hepta-knockout of SIRTs 1-7, knockout of SIRTs 2-7, or knockout of SIRT1/2/6/7, were lysed, and the acetylation of V1E1-K99 was determined by immunoblotting. l, m, Sirtuins are required for LCA-mediated inhibition of v-ATPase. MEFs with hepta-knockout of SIRT1 to SIRT7 (SIRT1-7−/−; validation data are shown in l, see also knockout strategy in Supplementary Table 2) were treated with 1 μM LCA for 4 h, followed by determination of the activity of v-ATPase (m, assessed by the proton transport rates). Data are mean ± s.e.m.; n = 3 replicates, and P value by two-sided Student’s t-test. n, The SIRT1-7−/− MEFs grow much slower than wildtype MEFs. The SIRT1-7−/− MEFs and wildtype MEFs were regularly cultured, followed by determination of the proliferation rates by CCK8 assays. Results are shown as mean ± s.e.m.; n = 6 biological replicates, and P value by two-way ANOVA followed by Tukey’s test. Experiments in this figure were performed three times, except a four times. Source Data
Extended Data Fig. 5
Extended Data Fig. 5. Sirtuins redundantly mediate the regulation of v-ATPase by LCA.
a, c-e, Inhibition of SIRT1 in SIRT2-7−/− MEFs blocks the activation of AMPK by LCA. MEFs with sirtuins depletion by hexa-knockout of SIRT2 to SIRT7 (SIRT2-7−/−, validated in a) are treated with 10 μM EX-527 for 12 h to inhibit SIRT1 (c-e). Cells were then treated with 1 μM LCA for another 4 h, followed by determination for AMPK activation (c), the activity of v-ATPase (d, assessed by the intensities of Lysosensor; statistical analysis data are mean ± s.e.m., normalized to the DMSO group of each genotype; n = 22 (WT, DMSO and SIRT2-7−/− + EX-527, DMSO), 25 (SIRT2-7−/− + EX-527, LCA), or 21 (WT, LCA), and P value by two-sided Student’s t-test; see also proton transport rates on the right panel of Fig. 2d), and lysosomal localization of AXIN (e; data are mean ± s.e.m.; n = 26 (SIRT2-7−/− + EX-527, DMSO), 25 (WT, LCA), 30 (WT, DMSO), or 21 (SIRT2-7−/− + EX-527, LCA), and P value by two-way ANOVA followed by Tukey’s test). b, SIRT2-7−/− MEFs grow at a similar rate to wildtype MEFs. Growth curves of SIRT2-7−/− MEFs, wildtype MEFs, and SIRT1-7−/− MEFs as a control, are shown. Results are mean ± s.e.m.; n = 7 (60 h of SIRT2-7−/−) or 8 (others) replicates for each time point/cell line, and P value by two-way ANOVA followed by Tukey’s test. f, Validation of the antibody able to recognise endogenous SIRT1. Wildtype MEFs or SIRT1−/− MEFs were immunostained with the antibody against SIRT1. The nuclei were stained with the DAPI dye. g, Sirtuins interact with V1E1. MEFs stably expressing HA-tagged V1E1 and FLAG-tagged SIRT1 were treated with 1 μM LCA (left panel), or incubated in DMEM with an equal volume of serum from CR or ad libitum fed mice as a control (right panel) instead of FBS, for 4 h. Cells were then lysed, followed by determination of V1E and SIRT1 interaction by immunoprecipitation of FLAG-tag. h, Portions of SIRTs 3, 4 and 5 are localized outside mitochondria. MEFs were subjected to subcellular fractionation, followed by determination of SIRT3, SIRT4 and SIRT5 in mitochondrial and cytosolic fractions by immunoblotting. i, j, SIRTs 3-5 are partially localized outside the mitochondria. MEFs with 3× HA-tagged SIRT3, SIRT4 or SIRT5 knocked in (located in front of the first exon of SIRTs 3-5; see validation data in j for the protein levels of SIRTs 3-5 after the HA-tag knocking in, and the sequence of the knocked-in HA-tag in Supplementary Table 2) were stained with antibodies against HA-tag and the mitochondrial marker TOMM20 (i). Representative images are shown, and the Mander’s overlap coefficients between SIRTs 3-5 and TOMM20 are shown as mean ± s.e.m.; n = 20 (SIRT3), 24 (others) cells. k, LCA can activate AMPK in MEFs expressing SIRTs 3-5. MEFs with quadruple knockout of other SIRTs 1, 2, 6, and 7 (SIRT1/2/6/7-QKO) were treated with 1 μM LCA for 4 h, followed by determination of AMPK activation and V1E1 acetylation by immunoblotting. l, m, LCA can inhibit the activity of v-ATPase and promote the lysosomal translocation of AXIN in MEFs expressing SIRTs 3-5. The SIRT1/2/6/7-QKO MEFs were treated with 1 μM LCA for 4 h, followed by determination of v-ATPase activity (l; statistical analysis data are shown as mean ± s.e.m.; n = 30 (DMSO), 27 (LCA) cells for each treatment, and P value by two-sided Student’s t-test), and the lysosomal localization of AXIN (m; statistical analysis data are shown as mean ± s.e.m.; n = 31 (DMSO), 28 (LCA) cells for each treatment, and P value by two-sided Student’s t-test). Experiments in this figure were performed three times. Source Data
Extended Data Fig. 6
Extended Data Fig. 6. LCA activates sirtuins before the increase of NAD+.
a, b, LCA stimulates the activity of sirtuins before the elevation of NAD+. Wildtype and AMPKα1/2−/− MEFs were treated with 1 μM LCA for indicated periods of time, followed by determination of the acetylation of histone H3 (on K9 residue, or Ac-H3-K9; b), the acetylation of V1E1 (b), activity of AMPK (b), and the levels of NAD+ (a; results are shown as mean ± s.e.m.; n = 4 samples, and P value by two-way ANOVA followed by Tukey’s test). c, Mutant SIRT1-E230K, unable to be activated by allosteric activators such as resveratrol, blocks LCA-mediated AMPK activation. SIRT1-7−/− MEFs were re-introduced with SIRT1-E230K, or wildtype SIRT1 as a control, and were treated with 1 μM LCA for 4 h. Cells were then lysed, followed by determination of AMPK activity and acetylated V1E1 by immunoblotting. d-f, SIRT1-E230K blocks LCA-mediated v-ATPase inhibition and AXIN translocation. SIRT1-7−/− MEFs were re-introduced with SIRT1-E230K or wildtype SIRT1 as a control, followed by treatment with 1 μM LCA for 4 h. The activity of v-ATPase, accessed by the intensities of the Lysosensor (d; data are mean ± s.e.m., normalised to the DMSO group; n = 29 (DMSO, WT) or 30 (others) cells) and by the proton transport rates of v-ATPase (f; data are mean ± s.e.m., normalised to the DMSO group; n = 3 replicates), and the lysosomal localization of AXIN (e; data are mean ± s.e.m.; n = 30 (DMSO, WT), 33 (LCA, WT), 34 (DMSO, E230K), or 32 (LCA, E230K) cells) were then determined. P value are determined by two-way ANOVA followed by Tukey’s test (d, e), or by two-sided Student’s t-test (f). Experiments in this figure were performed three times. Source Data
Extended Data Fig. 7
Extended Data Fig. 7. TULP3 mediates LCA to activate sirtuins.
a-c, Purified bacterially expressed SIRT1 is unable to bind to or be activated by LCA. His-tagged SIRT1 was incubated with close-to-intracellular concentrations of LCA (5 μM). The deacetylase activities of SIRT1 towards histone H3 and V1E1 (a) were determined through a cell-free assay (see Methods section for details; results are shown as mean ± s.e.m., n = 4 samples), and the affinity of SIRT1 towards LCA through an affinity pull-down assay using LCA probe as a bait, followed by competitive elution with LCA (c; the procedure of this assay was depicted in the upper panel, and the LCA probe was synthesized and purified as described in Supplementary Fig. 3). See also validation for the SIRT1 activity assay in b, in which the representative spectrograms of acetylated histone H3 (left panel) and acetylated V1E1 (right panel) peptides before (−SIRT1) and after (+SIRT1) incubating with SIRT1 are shown. The presence of deacetylated histone H3 (m/z 453.2403 and 905.4805) and V1E1 (m/z 529.8019 and 1058.5959) peaks indicate that SIRT1 effectively catalysed the deacetylation reaction. d, Schematic diagram depicting the steps and reaction principles for the formation of the complex between the LCA probe and TULP3-SIRT1. The LCA probe was first biotinylated by mixing with Cu(II) salt, which catalyses a [3 + 2] azide-alkyne cycloaddition with a biotin-azide linker, followed by incubating with Streptavidin beads for 2 h, and then the TULP3 and SIRT1 proteins. e, LCA probe is able to activate AMPK. MEFs were treated with 10 μM LCA probe for 4 h, followed by determination of AMPK activation by immunoblotting. f, TULP3 is required for the LCA-mediated activation of SIRT1 and AMPK. MEFs with TULP3 knocked down by three distinct siRNAs (#1, #2 or #3, see knockdown efficiency of each siRNA on the lower right panel) were treated with 1 μM LCA for 4 h, followed by determination of the activity of AMPK and the acetylation of V1E1 by immunoblotting. Results are mean ± s.e.m.; n = 4 for each condition, and P value by two-way ANOVA followed by Tukey’s test. g, TULP3 is required for LCA-mediated inhibition of v-ATPase. MEFs with TULP3 knocked down (by siRNA #1, and the same hereafter for all TULP3 knocked down experiments) were treated with 1 μM LCA for 4 h, followed by determination of the activity of v-ATPase. Statistical analysis data are shown as mean ± s.e.m., normalized to the DMSO group; n = 21 (DMSO) or 24 (LCA) cells, and P value by two-sided Student’s t-test. h, Knockout of TULP3 abrogates LCA-induced activation of SIRT1 and AMPK. The clone #2 of TULP3−/− MEFs were treated with 1 μM LCA for 4 h, followed by determination of the activity of AMPK by immunoblotting. See also the data for clone #1 of TULP3−/− MEFs in Fig. 3b. i, TULP3 interacts with all 7 members of the sirtuin family independently of LCA. HEK293T cells were transfected with Myc-tagged TULP3 and each HA-tagged sirtuin (SIRT1 to SIRT7). Cells were then lysed, and a concentration of 5 μM LCA was added to the lysate. After incubation for 1 h, each SIRT was immunoprecipitated, and the co-immunoprecipitated TULP3, followed by immunoblotting. j, TULP3 is constitutively associated with SIRT1, independently of LCA. Bacterially expressed and purified TULP3 and SIRT1 were co-incubated, followed by size exclusion chromatography. The elution chromatograms of SIRT1 alone (red), TULP3 alone (green), or SIRT1 together with TULP3 (cyan) were shown (upper panel). The presence of SIRT1-TULP3 complex was confirmed by the shift of the peak retention volume of TULP3 from 16 ml to 11 ml after incubating with SIRT1 (upper panel), and the presence of both SIRT1 and TULP3 in the fractions with a shifted peak (lower panel; analysed by SDS-PAGE and immunoblotting). CBB, Coomassie brilliant blue staining. Experiments in this figure were performed three times. The schematic in c was created using elements from Servier Medical Art under a Creative Commons Attribution 3.0 unported licence. Source Data
Extended Data Fig. 8
Extended Data Fig. 8. TULP3 binds LCA for activation of sirtuins.
a, b, TULP3 binds LCA and mediates activation of SIRT1. His-tagged SIRT1 (b) or SIRT1-E230K (a) mutant was co-eluted with bacterially expressed His-tagged TULP3 on a Superdex column, followed by incubation with LCA at 5 μM (a) or indicated concentrations (b). The deacetylase activities of TULP3-SIRT1 complex towards histone H3 and V1E1 were determined through a cell-free assay (a, results are shown as mean ± s.e.m., n = 4 samples), and the affinity of TULP3-SIRT1 complex towards LCA through an affinity pull-down assay using LCA probe as a bait, followed by competitive elution with LCA (b). c, TULP3 does not bind to iso-LCA. Experiments were performed as in b, except that iso-LCA was used to elute the TULP3-SIRT1 complex pre-bound to LCA-probe-conjugated beads. d, e, Iso-LCA does not inhibit v-ATPase or trigger the lysosomal translocation of AXIN. MEFs were treated with 1 μM iso-LCA for 4 h, followed by determination of the activity of v-ATPase (d; data are shown as mean ± s.e.m., normalized to the DMSO group; n = 23 (DMSO) or 25 (iso-LCA) cells) and the lysosomal localisation of AXIN (e; data are shown as mean ± s.e.m.; n = 25 (DMSO) or 24 (iso-LCA) cells). P value in this panel was determined by two-sided Student’s t-test. f, In silico modelling of LCA bound to TULP3. The His-tagged TULP3 protein was incubated with the LCA probe, followed by exposure to UV light. The LCA probe-protein conjugates were then mixed with Cu(II) salt and the biotin-azide linker, thus biotinylating probe-target complexes, allowing for the pull-down of such complexes for MS analysis with Streptavidin beads (left panel; see details in “Determination of the binding affinity of LCA to TULP3” of Methods section). Modelling was then performed according to the results of MS on purified TULP3 conjugated to the LCA-probe, and the AlphaFold-predicted TULP3 structure. The Y193, P195, K333 and P336 residues (coloured in yellow) that comprise a hydrophobic pocket for LCA (coloured in red) binding as indicated were mutated to glycine (TULP3-4G) to create a TULP3 mutant that is defective in binding to LCA. g-j, TULP3-4G unable to bind LCA blocks LCA-induced activation of SIRT1 and AMPK. The LCA-binding affinity (g) was determined as in b, except that the His-tagged TULP3-4G was used. The LCA-mediated AMPK activation was determined as in h and i, in which the TULP3−/− MEFs were infected with lentivirus carrying TULP3-4G mutant or its wildtype control, followed by treatment with 1 μM LCA for 4 h. The activity of v-ATPase (h) and the lysosomal localisation of AXIN (i) were then determined. The effects of LCA on SIRT1 activity were determined in j (as in Fig. 3e, except that the TULP3-4G was co-eluted with SIRT1 before the experiment). The results are shown as mean ± s.e.m. n = 4 (j), 21 (WT, LCA of h), 26 (WT, LCA of i), 28 (WT, DMSO of i), 23 (4G, DMSO of i), 30 (4 G, LCA of i) or 25 (others) samples; and P value by two-sided Student’s t-test (h, 4G), two-sided Student’s t-test with Welch’s correction (h, WT), or two-way ANOVA followed by Tukey’s test (i). k, TULP3-4G blocked LCA-mediated inhibition of the proton transport rate of v-ATPase. TULP3−/− MEFs were infected with lentivirus carrying TULP3-4G, followed by treatment with 1 μM LCA for 4 h. The proton transport rate of v-ATPase was then determined. The results are shown as mean ± s.e.m. n = 3 replicates for each treatment; and P value by two-sided Student’s t-test. l, Validation for the close-to-endogenous protein levels of wildtype TULP3 and TULP3-4G when re-introduced into the TULP3−/− MEFs. m, TULP3-4G has a thermal transition midpoint (Tm) similar to that of the wildtype TULP3. Some 10 μM His-tagged TULP3 or TULP3-4G was incubated in the His-elution Buffer (see contents in Methods section), followed by determination of the Tm on a differential scanning calorimetre. Enthalpy changes of TULP3 at indicated temperatures are shown. n, TULP3-4G exhibits a comparable affinity for SIRT1 to wildtype TULP3. HEK293T cells were transfected with different combinations of Myc-tagged TULP3, TULP3-4G, and FLAG-tagged SIRT1 for 24 h. The interaction between TULP3 and SIRT1 was determined by immunoprecipitating Myc-tag, followed by immunoblotting. Experiments in this figure were performed three times. Source Data
Extended Data Fig. 9
Extended Data Fig. 9. Other known binding partners of LCA are not required for the activation of AMPK.
a-r, MEFs with knockout of known binding partner/targets of LCA or derivatives, including FXR (a, clone #1 on the left panel, and clone #2 right, and the same hereafter in this figure), FXRb (b), PXR, (c), VDR (d), CAR, (e), LXRa (f), LXRb (g), S1PR2 (ref. ; h), CHRM2 (ref. ; i), CHRM3 (ref. ; j), PKCζ (k), FAS (l), FPR1 (ref. ; m), or YES1 (ref. ; n), or with double knockout of LXRa and LXRb (o), FXR and FXRb (p), PXR and CAR (q), or CHRM2 and CHRM3 (r), were treated with 1 μM LCA for 4 h, followed by determination of the activity of AMPK. See validation data for each knockout cell line by immunoblotting (d, n) or parallel reaction monitoring (PRM)-based, quantitative mass spectrometry (others; in which the MS/MS spectrum of the quantotypic peptides selected for each protein, and the peak area of the quantotypic peptide detected in each cell line, are shown in Supplementary Table 4). See also data for TGR5 (ref. ) in extended data figure 1q of ref. . Experiments in this figure were performed three times.
Extended Data Fig. 10
Extended Data Fig. 10. Interaction between TULP3 and sirtuin is required for AMPK activation by LCA.
a, b, The segment of aa 1-60 of TULP3 is required for interaction with SIRT1. HEK293T cells were co-transfected with Myc-tagged full-length TULP3, or its deletion mutants, and FLAG-tagged SIRT1 (a) or other sirtuins (b). After 12 h of transfection, cells were lysed, followed by immunoprecipitation of Myc- (a) or FLAG-tag (b). The co-immunoprecipitated SIRT1 (a) or TULP3 (b) was determined by immunoblotting. c, d, TULP3Δ1-60 does not interact with sirtuins. TULP3−/− MEFs with HA-tagged SIRT1, SIRT3, SIRT4 or SIRT5 knocked in (d), or wildtype HEK293T cells (c), were infected with lentivirus carrying the GFP-tagged (c) or Myc-tagged (d) TULP3Δ1-60, and the mCherry-tagged SIRT1 (c). The interaction between TULP3 and SIRTs was determined through the FRET-FLIM (c, the fluorescence lifetime of GFP-TULP3 donor, the FRET-FLIM efficiency, and the percentage of SIRTs-associated TULP3 calculated accordingly, are shown as mean ± s.e.m.; n = 22 (full-length TULP3) or 25 (TULP3Δ1-60) cells for each treatment, and P value by two-sided Student’s t-test) and the Duolink (d, the relative intensities of PLA signals – after normalizing to DAPI - are shown as mean ± s.e.m.; n = 19 (TULP3-SIRT1), 23 (TULP3Δ1-60-SIRT1), 29 (TULP3-SIRT3), 27 (TULP3Δ1-60-SIRT3), 28 (SIRT4), 44 (TULP3-SIRT5), 31 (TULP3Δ1-60-SIRT5) cells for each treatment, and P value by two-sided Student’s t-test (middle panel of c) or two-sided Student’s t-test with Welch’s correction (others)) assays. e, TULP3 and TULP3Δ1-60 show similar subcellular localization. TULP3−/− MEFs with stable expression of Myc-tagged TULP3 or TULP3Δ1-60 were stained with antibody against Myc-tag. Representative images are shown. f, TULP3Δ1-60 retains the ability to bind LCA. Experiments were performed as in Extended Data Fig. 8b, except that His-tagged TULP3Δ1-60 was used. g, h, TULP3Δ1-60 blocks LCA-induced activation of AMPK. TULP3−/− MEFs were infected with lentivirus carrying the Myc-tagged TULP3Δ1-60, or full-length TULP3 as a control, followed by treatment with 1 μM LCA for 4 h. The activity of v-ATPase (g, data are mean ± s.e.m.; n = 30 (TULP3 and TULP3Δ1-60), 28 (TULP3 + LCA), or 27 (TULP3Δ1-60 + LCA)), and the lysosomal localization of AXIN (h, data are mean ± s.e.m.; n = 31 (TULP3), 34 (TULP3 + LCA), 38 (TULP3Δ1-60) or 42 (TULP3Δ1-60 + LCA)) were then determined. P value were determined by two-way ANOVA followed by Tukey’s test. Experiments in this figure were performed three times. Source Data
Extended Data Fig. 11
Extended Data Fig. 11. The mini-SIRT1 mutant unable to interact with TULP3 blocks LCA-induced activation of AMPK.
a, The mini-SIRT1 mutant is unable to interact with TULP3. HEK293T cells were transfected with various combinations of Myc-tagged TULP3 with HA-tagged SIRT1 deletion mutants: three different versions of mini-SIRT1 (according to different references: version #1 described in ref. , and #2 and #3 according to ref. ; unless stated otherwise, only mini-SIRT1-#1 is used afterwards in this study) and other SIRT1 deletion mutants. At 12 h after transfection, the cells were lysed, followed by the immunoprecipitation of the HA-tag. Co-immunoprecipitated TULP3 was determined by immunoblotting. NTD: N-terminal domain; CD: catalytic domain; and ESA: essential for SIRT1 activity sequence; defined as in ref. . SBD: sirtuins-activating compound-binding domain; and CTR: C-terminal regulatory segment; defined as in ref. . b, c, The mini-SIRT1 mutant blocks LCA-induced activation of AMPK. SIRT1-7−/− MEFs were infected with lentivirus carrying the HA-tagged mini-SIRT1, or the full-length SIRT1 as a control, followed by treatment with 1 μM LCA for 4 h. The lysosomal localization of AXIN (c, statistical analysis data are shown as mean ± s.e.m.; n = 27 (SIRT1), 24 (SIRT1 + LCA), 36 (mini-SIRT1), or 35 (mini-SIRT1 + LCA)) and the activity of v-ATPase (b, statistical analysis data are shown as mean ± s.e.m.; n = 26 (SIRT1), 27 (LCA) or 25 (mini-SIRT1)) were then determined. P value were determined by two-way ANOVA followed by Tukey’s test. Experiments in this figure were performed three times. Source Data
Extended Data Fig. 12
Extended Data Fig. 12. The LCA-TULP3-sirtuins-v-ATPase axis enhances muscle functions in aged mice.
a-d, V1E1-3KR improves muscle function in aged mice. WT or muscle-specific AMPKα knockout (α-MKO) mice with muscle-specific expression (induced by tamoxifen at 16 months old; see “mouse strains” section of the Methods section for the procedures for constructing this strain) of V1E1-3KR or wildtype V1E1 were subjected to analysis for AMPK activation (a), the ratios of mtDNA:nDNA (b), the mRNA and protein levels of the OXPHOS complex (c), and the OCR (d) in the gastrocnemius muscle. Results are shown as mean ± s.e.m.; n = 4 (b, c) or 5 (d) mice for each genotype/treatment, and P value by two-way ANOVA followed by Tukey’s test. e-g, V1E1-3KR elevates energy expenditure (EE) and respiratory quotient (RQ) in aged mice. Mice were treated as in a, followed by determination of EE (e). Data are shown as mean (left panel; at 5-min intervals during a 24-h course after normalization to the body weight (kg0.75)), or as box-and-whisker plots (right panel, in which the lower and upper bounds of the box represent the first and the third quartile scores, the centre line represents the median, and the lower and upper limits denote minimum and maximum scores, respectively; and the same hereafter for all box-and-whisker plots; n = 4 mice for each genotype/treatment, and P value by two-way ANOVA followed by Tukey’s test). See also respiratory quotient (RQ) and the ambulatory activity data generated in this experiment in f (data are shown as mean (at 5-min intervals during a 24-h course; n = 4 mice for each genotype), or box-and-whisker plots (n = 4 mice for each genotype, and P value by two-way ANOVA followed by Tukey’s test)), and the body composition data in g (mean ± s.e.m., n = 5 mice for each genotype, and P value by two-way ANOVA followed by Tukey’s test). h, i, j, TULP3-4G blocks CR-elevated mitochondrial content in muscle. The muscle-specific TULP3 knockout (TULP3-MKO) mice with re-introduced muscular expression of TULP3-4G or wildtype TULP3 (induced by tamoxifen at 16 months old; see validation data in i, and the procedures for constructing this strain in “mouse strains” section of the Methods section) were subjected to CR for 3.5 months, followed by determination of mtDNA:nDNA ratios (h). Results in h are shown as mean ± s.e.m., n = 6 mice for each genotype/treatment, and P value by two-way ANOVA followed by Tukey’s test. See also AMPK activation in the muscle of TULP3-4G-re-introduction mice after 3.5 months of CR (left panel), or 1 month of (2-hydroxypropyl)-β-cyclodextrin-coated LCA treatment (1 g/l in the drinking water; right panel) in j. Experiments in this figure were performed three times. Source Data
Extended Data Fig. 13
Extended Data Fig. 13. The LCA-TULP3-sirtuins-v-ATPase axis extends lifespan in nematodes and flies.
a, Tub-1-3G blocks LCA-induced extension of lifespan in nematodes. Nematodes with Tub-1-3G re-introduced in the tub-1-knockout background were treated with 100 μM LCA, followed by determination of lifespan (shown as Kaplan-Meier curves). b, e, f, i, TULP3, sirtuins and v-ATPase are required for lifespan extension by LCA. The tub-1-knockout nematodes re-introduced with TULP3-4G (b, left panel), sirtuins-depleted nematodes (e, left panel; sir-2.1/sir-2.2-double knockout nematodes with sir-2.3 and sir-2.4 knockdown (KD)), nematodes expressing V1E1-3KR (f, left panel) or vha-8-2KR (i), along with control nematodes, were cultured in the medium containing LCA at 100 μM. Lifespan data are shown as Kaplan-Meier curves. Shown are also data obtained from experiments using flies with TULP3 knockout (ktub-KO) re-introduced with TULP3-4G (UAS-TULP3-4G) (b, middle and right panels), flies with sirtuin knockout (sir2-KO) (e, middle and right panels), and flies expressing V1E1-3KR (Act5C-GAL4 > UAS-V1E1-3KR) (f, middle and right panels). The flies were cultured in the medium containing 100 μM LCA. c, g, TULP3 and V1E1 regulate LCA-mediated activation of AMPK in nematodes and flies. The tub-1-KO nematodes (upper panel of c) or ktub-KO flies (lower panel of c), both with TULP3-4G reintroduction (c), or wildtype nematodes and flies with V1E1-3KR expression (g), were cultured in the medium containing LCA at 100 μM, followed by determination of the activation of AMPK. d, Sirtuins in nematodes and flies are required for LCA-induced AMPK activation. Nematodes (upper panel) or flies (lower panel) with sirtuin depletion were cultured in the medium containing LCA at 100 μM, followed by determination of AMPK activation. h, j, Mutant of vha-8 subunit (equivalent to mouse V1E2), vha-8-2KR, is a deacetylated state-mimetic and activates AMPK in nematodes. Nematodes with expression of vha-8 or vha-8-K60R/K117R (vha-8-2KR) mutant (see structural alignment results in h, in which the AlphaFold-predicted vha-8 structure is coloured in green, and V1E2 in blue) were cultured in the regular NGM plate, followed by determination of the activation of AMPK (j). Experiments in this figure were performed three times.
Extended Data Fig. 14
Extended Data Fig. 14. The LCA-TULP3-sirtuins-v-ATPase axis extends healthspan in nematodes and flies.
a-d, TULP3 and sirtuins are required for LCA-enhanced resistance to oxidative stress and starvation. Nematodes and flies with TULP3-4G re-introduction in the tub-1- or ktub-knockout background (a, c, d), or with sirtuins depletion (b-d) were treated with 100 μM LCA for 2 days (left panels of a, b) or 30 days (right panels of a, b, and c, d), followed by transferring to media containing 15 mM FeSO4 (left panels of a, b), 20 mM paraquat (right panels of a, b) or 5% H2O2 (c) that elicited oxidative stress, or deprived of food (d). Lifespan data are shown as Kaplan-Meier curves. e, f, TULP3 and sirtuins are required for elevation of mtDNA:nDNA ratios in nematodes and flies. The tub-1-KO nematodes (upper panel of e) or ktub-KO flies (upper panel of f), both with TULP3-4G reintroduction, or sirtuins-depleted nematodes (lower panel of e) and flies (lower panel of f) were treated with 100 μM LCA, either for 2 days (e, for nematodes) or for 30 days (f, for flies), followed by determination of the ratios of mtDNA:nDNA. Results are mean ± s.e.m.; n = 5 (lower panels of f) or 4 (others) samples for each genotype/condition, and P value by two-way ANOVA followed by Tukey’s test (upper panels) or two-sided Student’s t-test (lower panels). g-j, TULP3 and sirtuins are required for elevation of mitochondrial contents and respiratory functions in nematodes and flies. The tub-1-KO nematodes (upper panel of g, and h) or ktub-KO flies (lower panel of g), both re-introduced with TULP3-4G, or sirtuins-depleted nematodes (upper panel of i, and j) and flies (lower panel of i) were treated with LCA, either for 2 days (for nematodes) or 30 days (for flies), followed by determination of the mRNA levels of OXPHOS complex (g, i; results are mean ± s.e.m.; n = 4 samples for each genotype/treatment, and P value by two-way ANOVA followed by Tukey’s test, except those of flies in i two-sided Student’s t-test), and OCR (h, j; results are mean ± s.e.m.; n = 4 samples for each genotype/treatment, and P value by two-way ANOVA followed by Tukey’s test, except j two-sided Student’s t-test). k, l, TULP3 and sirtuins are required for the elevation of NAD+ levels in nematodes and flies. Nematodes and flies with TULP3-4G re-introduction in the tub-1- or ktub-knockout background (left panels), or with sirtuins depletion (right panels), were treated with 100 μM LCA for 2 days (k) or 30 days (l), followed by determination of the levels of NAD+. Results are mean ± s.e.m.; n = 5 (l) or 4 (k) samples for each genotype/condition, and P value by two-way ANOVA followed by Tukey’s test (left panels) or two-sided Student’s t-test (right panels). Experiments in this figure were performed three times. Source Data
Extended Data Fig. 15
Extended Data Fig. 15. V1E1-3KR dominantly exerts anti-ageing effects in nematodes and flies.
a, b, V1E1-3KR improves oxidative stress and starvation resistance. Nematodes and flies with V1E1-3KR expressing were treated with 100 μM LCA for 2 days (left panel of a) or 30 days (others), followed by transferring to media containing 15 mM FeSO4 (left panels of a), 20 mM paraquat (right panels of a) or 5% H2O2 (left panels of b) that elicited oxidative stress, or deprived of food (right panels of b). Lifespan data are shown as Kaplan-Meier curves. c, V1E1-3KR elevates the ratios of mtDNA:nDNA. Nematodes and flies with V1E1-3KR expressing were treated with 100 μM LCA for 2 days (left panel) or 30 days (right panel), followed by determination of the ratios of mtDNA:nDNA. Results are mean ± s.e.m.; n = 5 (right panel) or 4 (left panel) samples for each genotype/condition, and P value by two-way ANOVA followed by Tukey’s test (left panel) or two-sided Student’s t-test (right panel). d, e, V1E1-3KR elevates mitochondrial contents and respiratory functions in nematodes and flies. Nematodes and flies with V1E1-3KR expression were treated with LCA, followed by determination of the mRNA levels of OXPHOS complex (e; results are mean ± s.e.m.; n = 4 samples for each genotype/treatment, and P value by two-way ANOVA followed by Tukey’s test, except those of flies in e two-sided Student’s t-test), and OCR (d; results are mean ± s.e.m.; n = 4 samples for each genotype/treatment, and P value by two-way ANOVA followed by Tukey’s test). f, V1E1-3KR elevates NAD+ levels in nematodes and flies. Nematodes and flies with expression of V1E1-3KR were treated with 100 μM LCA for 2 days (left panel) or 30 days (right panel), followed by determination of the levels of NAD+. Results are mean ± s.e.m.; n = 5 (right panel) or 4 (left panel) samples for each genotype/condition, and P value by two-way ANOVA followed by Tukey’s test (left panel) or two-sided Student’s t-test (right panel). g, Schematic diagram showing that the v-ATPase serves as a common entry into the lysosomal AMPK pathway: i) LCA, elevated by CR, binds to TULP3 and activates sirtuins, which in turn deacetylate the V1E1 subunit of v-ATPase (on K52, K99 and K191 residues) and inhibits v-ATPase, which along with conformationally changed Ragulator allows for AXIN/LKB1 to translocate to the surface of the lysosome, where LKB1 phosphorylates and activates AMPK; ii) in response to low glucose, the FBP-unoccupied aldolase interacts and inhibits the cation channel TRPV, which in turn interacts and reconfigures v-ATPase, allowing for AXIN/LKB1 to translocate to the lysosome to activate AMPK; and iii) metformin binds to its target PEN2, and the metformin-bound PEN2 is recruited to v-ATPase via interacting with ATP6AP1, thereby inhibiting v-ATPase. The v-ATPase complex hence acts as a common node for the signalling of low glucose, metformin and LCA to intersect, all leading to AMPK activation and manifestation of anti-ageing effects. Experiments in this figure were performed three times. Source Data

References

    1. Qu, Q. et al. Lithocholic acid phenocopies anti-ageing effects of calorie restriction. Nature10.1038/s41586-024-08329-5 (2024). - PMC - PubMed
    1. Armour, S. M. et al. A high-confidence interaction map identifies SIRT1 as a mediator of acetylation of USP22 and the SAGA coactivator complex. Mol. Cell. Biol.33, 1487–1502 (2013). - PMC - PubMed
    1. Green, C. L., Lamming, D. W. & Fontana, L. Molecular mechanisms of dietary restriction promoting health and longevity. Nat. Rev. Mol. Cell Biol.23, 56–73 (2022). - PMC - PubMed
    1. Speakman, J. R. & Mitchell, S. E. Caloric restriction. Mol. Aspects Med.32, 159–221 (2011). - PubMed
    1. Burkewitz, K., Zhang, Y. & Mair, W. B. AMPK at the nexus of energetics and aging. Cell Metab.20, 10–25 (2014). - PMC - PubMed

MeSH terms

LinkOut - more resources