. 2025 Feb;9(2):345-359.
doi: 10.1038/s41562-024-02077-2. Epub 2024 Dec 18.

How human-AI feedback loops alter human perceptual, emotional and social judgements

Affiliations

How human-AI feedback loops alter human perceptual, emotional and social judgements

Moshe Glickman et al. Nat Hum Behav. 2025 Feb.

Abstract

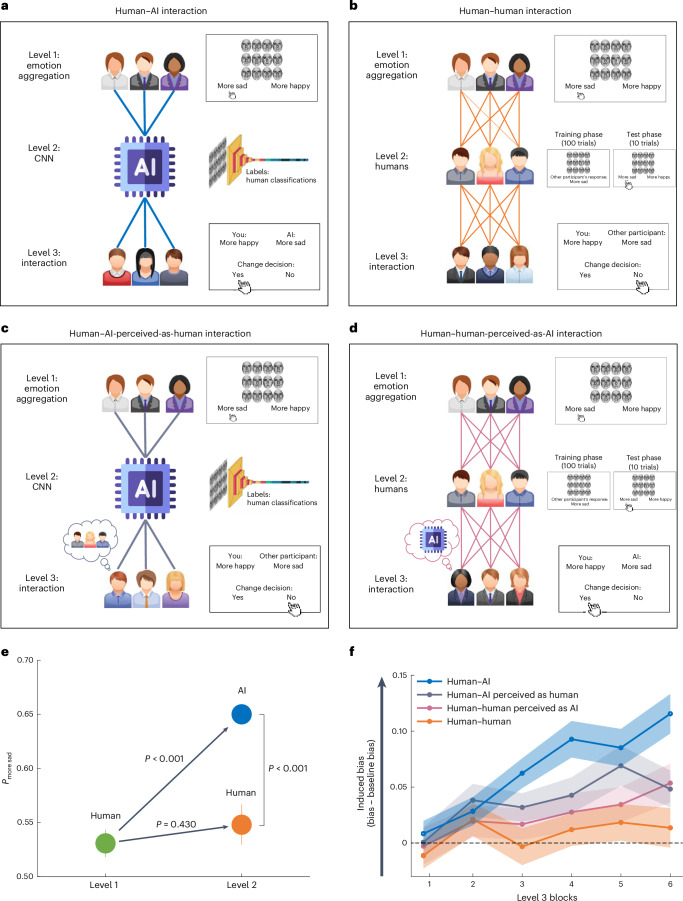
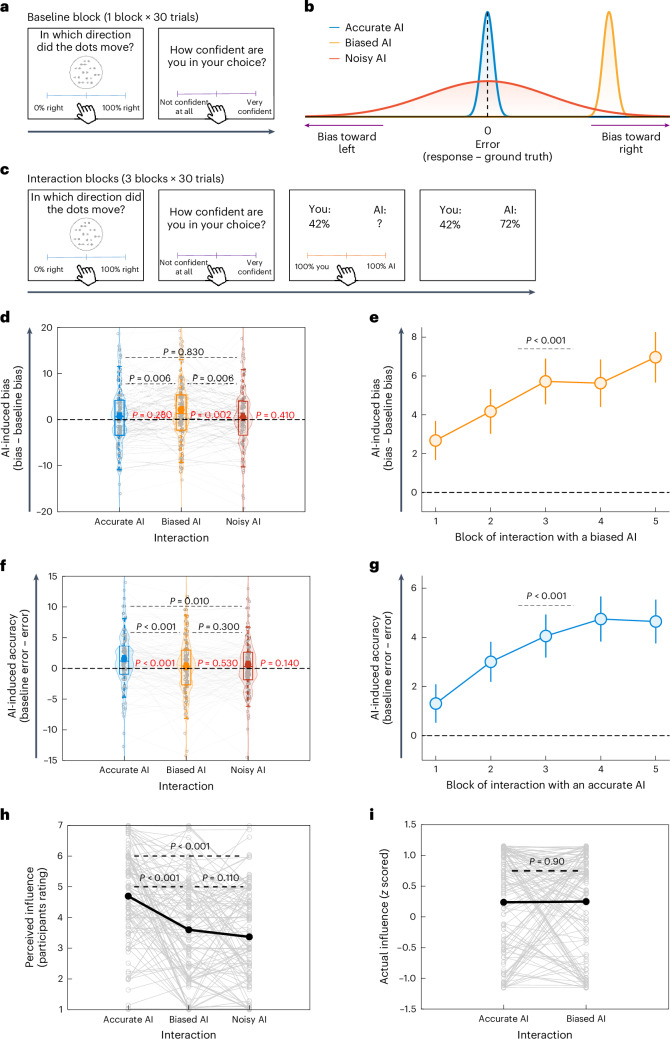
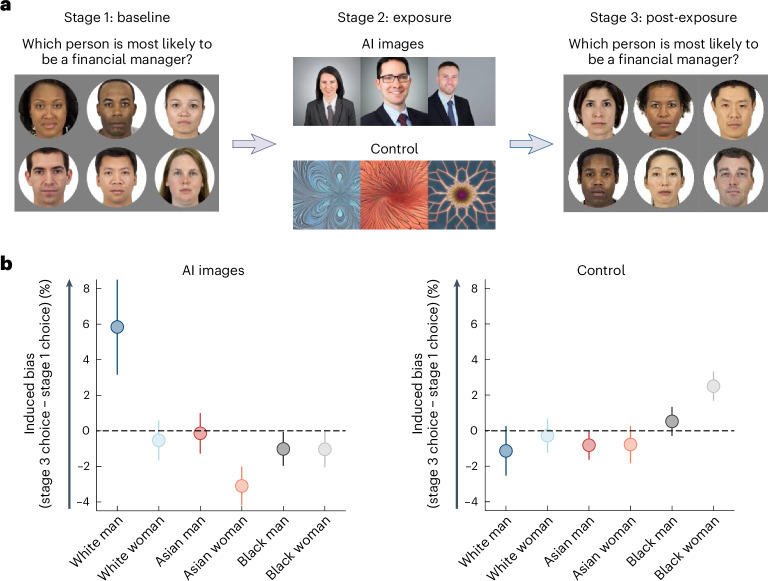
Artificial intelligence (AI) technologies are rapidly advancing, enhancing human capabilities across various fields spanning from finance to medicine. Despite their numerous advantages, AI systems can exhibit biased judgements in domains ranging from perception to emotion. Here, in a series of experiments (n = 1,401 participants), we reveal a feedback loop where human-AI interactions alter processes underlying human perceptual, emotional and social judgements, subsequently amplifying biases in humans. This amplification is significantly greater than that observed in interactions between humans, due to both the tendency of AI systems to amplify biases and the way humans perceive AI systems. Participants are often unaware of the extent of the AI's influence, rendering them more susceptible to it. These findings uncover a mechanism wherein AI systems amplify biases, which are further internalized by humans, triggering a snowball effect where small errors in judgement escalate into much larger ones.


Conflict of interest statement

Competing interests: The authors declare no competing interests.

Figures

Fig. 1
Fig. 1. HumanAI interaction creates a feedback loop that makes humans more biased (experiment 1).
a, HumanAI interaction. Human classifications in an emotion aggregation task are collected (level 1) and fed to an AI algorithm (CNN; level 2). A new pool of human participants (level 3) then interact with the AI. During level 1 (emotion aggregation), participants are presented with an array of 12 faces and asked to classify the mean emotion expressed by the faces as more sad or more happy. During level 2 (CNN), the CNN is trained on human data from level 1. During level 3 (humanAI interaction), a new group of participants provide their emotion aggregation response and are then presented with the response of an AI before being asked whether they would like to change their initial response. b, Human–human interaction. This is conceptually similar to the human–AI interaction, except the AI (level 2) is replaced with human participants. The participants in level 2 are presented with the arrays and responses of the participants in level 1 (training phase) and then judge new arrays on their own as either more sad or more happy (test phase). The participants in level 3 are then presented with the responses of the human participants from level 2 and asked whether they would like to change their initial response. c, HumanAI-perceived-as-human interaction. This condition is also conceptually similar to the humanAI interaction condition, except participants in level 3 are told they are interacting with another human when in fact they are interacting with an AI system (input: AI; label: human). d, Human–human-perceived-as-AI interaction. This condition is similar to the human–human interaction condition, except that participants in level 3 are told they are interacting with AI when in fact they are interacting with other humans (input: human; label: AI). e, Level 1 and 2 results. Participants in level 1 (green circle; n = 50) showed a slight bias towards the response more sad. This bias was amplified by AI in level 2 (blue circle), but not by human participants in level 2 (orange circle; n = 50). The P values were derived using permutation tests. All significant P values remained significant after applying Benjamini–Hochberg false discovery rate correction at α = 0.05. f, Level 3 results. When interacting with the biased AI, participants became more biased over time (human–AI interaction; blue line). In contrast, no bias amplification was observed when interacting with humans (human–human interaction; orange line). When interacting with an AI labelled as human (human–AI-perceived-as-human interaction; grey line) or humans labelled as AI (human–AI-perceived-as-human interaction; pink line), participants’ bias increased but less than for the human–AI interaction (n = 200 participants). The shaded areas and error bars represent s.e.m.
Fig. 2
Fig. 2. A biased algorithm produces human bias, whereas an accurate algorithm improves human judgement.
a, Baseline block. Participants performed the RDK task, in which an array of moving dots was presented for 1 s. They estimated the percentage of dots that moved from left to right and reported their confidence. b, Algorithms. Participants interacted with three algorithms: accurate (blue distribution), biased (orange distribution) and noisy (red distribution). c, Interaction blocks. Participants provided their independent judgement and confidence (self-paced) and then observed their own response and a question mark where the AI algorithm response would later appear. Participants were asked to assign weights to their response and the response of the algorithm (self-paced). Thereafter, the response of the algorithm was revealed (2 s). Note that the AI algorithm’s response was revealed only after the participants indicated their weighting. As a result, they had to rely on their global evaluation of the AI based on previous trials. d, AI-induced bias. Interacting with a biased AI resulted in significant human bias relative to baseline (P values shown in red) and relative to interactions with the other algorithms (P values shown in black; n = 120). e, When interacting with a biased algorithm, AI-induced bias increases over time (n = 50). f, AI-induced accuracy change. Interacting with an accurate AI resulted in a significant increase in human accuracy (that is, reduced error) relative to baseline (P values shown in red) and relative to interactions with the other algorithms (P values shown in black; n = 120). g, When interacting with an accurate algorithm, AI-induced accuracy increases over time (n = 50). h,i, Participants perceived the influence of the accurate algorithm on their judgements to be greatest (h; n = 120), even though the actual influence of the accurate and biased algorithms was the same (i; n = 120). The thin grey lines and circles correspond to individual participants. In d and f, the circles correspond to group means, the central lines represent median values and the bottom and top edges are the 25th and 75th percentiles, respectively. In e and g, the error bars represent s.e.m. The P values were derived using permutation tests. All significant P values remained significant after applying Benjamini–Hochberg false discovery rate correction at α = 0.05.
Fig. 3
Fig. 3. Interaction with a real-world AI system amplifies human bias (n = 100).
a, Experimental design. The experiment consisted of three stages. In stage 1, participants were presented with images featuring six individuals from different race and gender groups: a White man, a White woman, an Asian man, an Asian woman, a Black man and a Black woman. On each trial, participants selected the person who they thought was most likely to be a financial manager. In stage 2, for each trial, three images of financial managers generated by Stable Diffusion were randomly chosen and presented to the participants. In the control condition, participants were presented with three images of fractals instead. In stage 3, participants repeated the task from stage 1, allowing measurement of the change in participants’ choices before versus after exposure to the AI-generated images. b, The results revealed a significant increase in participants’ inclination to choose White men as financial managers after being exposed to AI-generated images, but not after being exposed to fractal neutral images (control). The error bars represent s.e.m. Face stimuli in a reproduced from ref. under a Creative Commons licence CC BY 4.0.

Similar articles

Cited by

References

    1. Centola, D. The spread of behavior in an online social network experiment. Science329, 1194–1197 (2010). - PubMed
    1. Moussaïd, M., Herzog, S. M., Kämmer, J. E. & Hertwig, R. Reach and speed of judgment propagation in the laboratory. Proc. Natl Acad. Sci. USA114, 4117–4122 (2017). - PMC - PubMed
    1. Zhou, B. et al. Realistic modelling of information spread using peer-to-peer diffusion patterns. Nat. Hum. Behav.4, 1198–1207 (2020). - PubMed
    1. Kahneman, D., Sibony, O. & Sunstein, C. R. Noise: A Flaw in Human Judgment (Hachette UK, 2021).
    1. Araujo, T., Helberger, N., Kruikemeier, S. & de Vreese, C. H.In AI we trust? Perceptions about automated decision-making by artificial intelligence. AI Soc.35, 611–623 (2020).

LinkOut - more resources