. 2024 Dec 18;11(1):1374.
doi: 10.1038/s41597-024-04205-z.

GARD-LENS: A downscaled large ensemble dataset for understanding future climate and its uncertainties

Affiliations

GARD-LENS: A downscaled large ensemble dataset for understanding future climate and its uncertainties

Samantha H Hartke et al. Sci Data. .

Abstract

This article introduces the Generalized Analog Regression Downscaling method Large Ensemble (GARD-LENS) dataset, comprised of daily precipitation, mean temperature, and temperature range over the Contiguous U.S., Alaska, and Hawaii at 12-km, 4-km, and 1-km resolutions, respectively. GARD-LENS statistically downscales three CMIP6 global climate model large ensembles, CESM2, CanESM5, and EC-Earth3, totaling 200 ensemble members. GARD-LENS is the first downscaled SMILE (single model initial-condition large ensemble), providing information about the role of internal climate variability at high resolutions. The 150-year record of this large ensemble dataset provides ample data for assessing trends and extremes and allows users to robustly assess internal variability, forced climate signals, and time of emergence at high resolutions. As the need for high resolution, robust climate datasets continues to grow, GARD-LENS will be a valuable tool for scientists and practitioners who wish to account for internal variability in their future climate analyses and adaptation plans.


Conflict of interest statement

Competing interests: The authors declare no competing interests.

Figures

Fig. 1
Fig. 1
(a) Historical and future trends in annual max daily temperature calculated for the state of Louisiana using the observation dataset GMET, 5 randomly selected GARD-LENS ensemble members which downscale CESM2 (3 sets), 20 randomly selected GARD-LENS members which downscale CESM2 (3 sets), and the full GARD-LENS ensemble for CESM2. (b) The same as in (a) but for mean daily precipitation. (c) The historical trend in annual precipitation for one observation product (GMET) and 13 members of the GARD-LENS ensemble, which demonstrate a range of differences in the direction and magnitude of the historical trend.
Fig. 2
Fig. 2
GARD-LENS methodology schematic. The GARD model is trained on daily GMET & ERA5 data using the analog regression configuration. The resulting output combines mean daily prediction fields with randomly perturbed daily error fields to predict daily precipitation, mean temperature, and temperature range.
Fig. 3
Fig. 3
Historical mean bias for (left to right) mean daily precipitation, temperature, and temperature range for each GCM downscaled by GARD-LENS. Bias has been averaged across all GCM ensemble members in GARD-LENS. The Containing Ratio (CR), describing the proportion of CONUS grid cells where the GARD-LENS ensemble brackets observations (GMET), is provided in lower left.
Fig. 4
Fig. 4
The Wasserstein Distance (WD) calculated between the historical (1980–2014) distribution of GMET daily precipitation (left column), mean temperature (middle column), and temperature range (right column) and the corresponding historical distribution of (top row) Livneh (regridded to GMET’s 1/8°), (second row) 10 randomly selected members of GARD-LENS CESM2, (third row) 10 randomly selected members of GARD-LENS EC-Earth3, and (bottom row) 10 randomly selected members of GARD-LENS CanESM5.
Fig. 5
Fig. 5
Annual total precipitation trends at four U.S. cities in the (left) historical period and (right) future. These trends were calculated as the slope of a linear regression fit to annual precipitation data for each period at each city.
Fig. 6
Fig. 6
Hawaii mean daily (top) temperature, (middle) precipitation, and (bottom) temperature range. The discontinuities in DeepSD and NASA-NEX around 2015 in panels a, d, and g portray the switch from the historical simulation to the SSP370 simulation of each dataset.
Fig. 7
Fig. 7
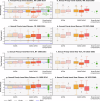
Alaska mean daily (top) temperature, (middle) precipitation, and (bottom) temperature range.
Fig. 8
Fig. 8
Using GARD-LENS to calculate the time of emergence for two climate signals: annual maximum (AMAX) daily temperature and precipitation. (a,b) Calculating the time of emergence from the signal (derived from entire ensemble) and historical standard deviation (calculated for each ensemble member) to obtain a time of emergence estimate for each ensemble member in two cities, Denver and Seattle. (c) The mean time of emergence for AMAX daily temperature across ensemble members for CONUS based on the CESM2 ensemble (d) The mean time of emergence for AMAX daily temperature using the GARD-LENS downscaled version of CESM2. (eh) The same as (ad) except for annual maximum daily precipitation.
Fig. 9
Fig. 9
(ac) Original signal for annual maximum daily temperature by three GCM large ensembles, describing the estimated increase in annual maximum daily temperature by the end of the century, (df) the change in signal that occurs after these GCMs are downscaled for GARD-LENS, (gi) Original signal for annual total precipitation by three GCMs, describing the estimated change in annual precipitation by end of century, and (jl) the signal for annual total precipitation in the GARD-LENS ensemble.

References

    1. Eyring, V. et al. Overview of the Coupled Model Intercomparison Project Phase 6 (CMIP6) experimental design and organization. Geosci Model Dev9(5), 1937–1958, 10.5194/gmd-9-1937-2016 (2016).
    1. Edwards, P. N. History of climate modeling. Wiley Interdiscip Rev Clim Change2(1), 128–139, 10.1002/wcc.95 (2011).
    1. McGuffie, K. & Henderson-Sellers, A. Forty years of numerical climate modelling. International Journal of Climatology21(9), 1067–1109, 10.1002/joc.632 (2001).
    1. Hawkins, E. & Sutton, R. The potential to narrow uncertainty in regional climate predictions. Bull Am Meteorol Soc90, 1095–1107, 10.1175/2009BAMS2607.1 (2009).
    1. Deser, C., Phillips, A., Bourdette, V. & Teng, H. Uncertainty in climate change projections: The role of internal variability. Clim Dyn38(3–4), 527–546, 10.1007/s00382-010-0977-x (2012).

LinkOut - more resources