. 2025 Feb;26(3):656-689.
doi: 10.1038/s44319-024-00328-x. Epub 2024 Dec 18.

Salmonella Typhimurium effector SseI regulates host peroxisomal dynamics to acquire lysosomal cholesterol

Affiliations

Salmonella Typhimurium effector SseI regulates host peroxisomal dynamics to acquire lysosomal cholesterol

Desh Raj et al. EMBO Rep. 2025 Feb.

Abstract

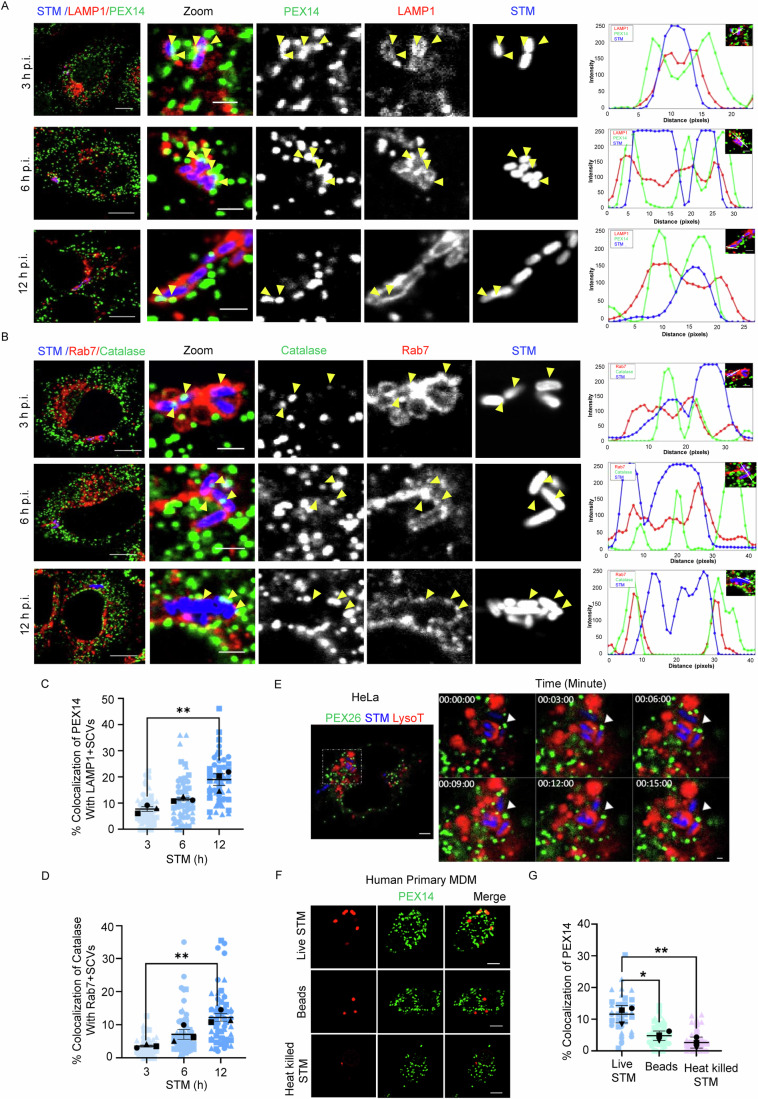
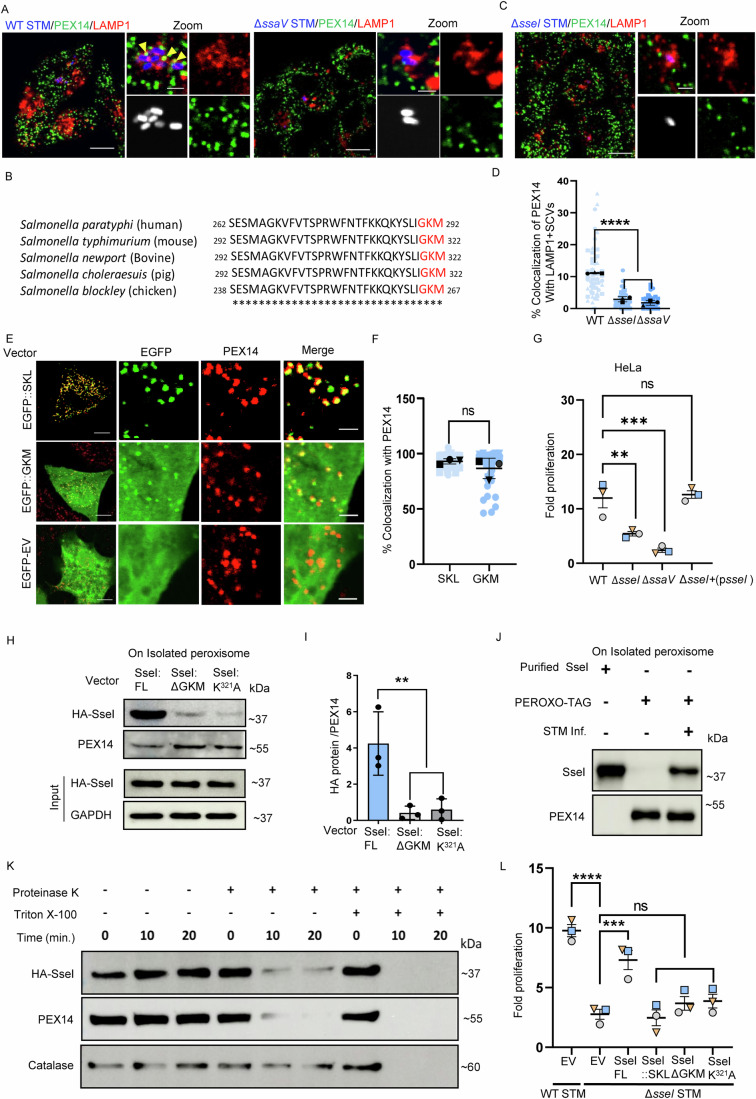
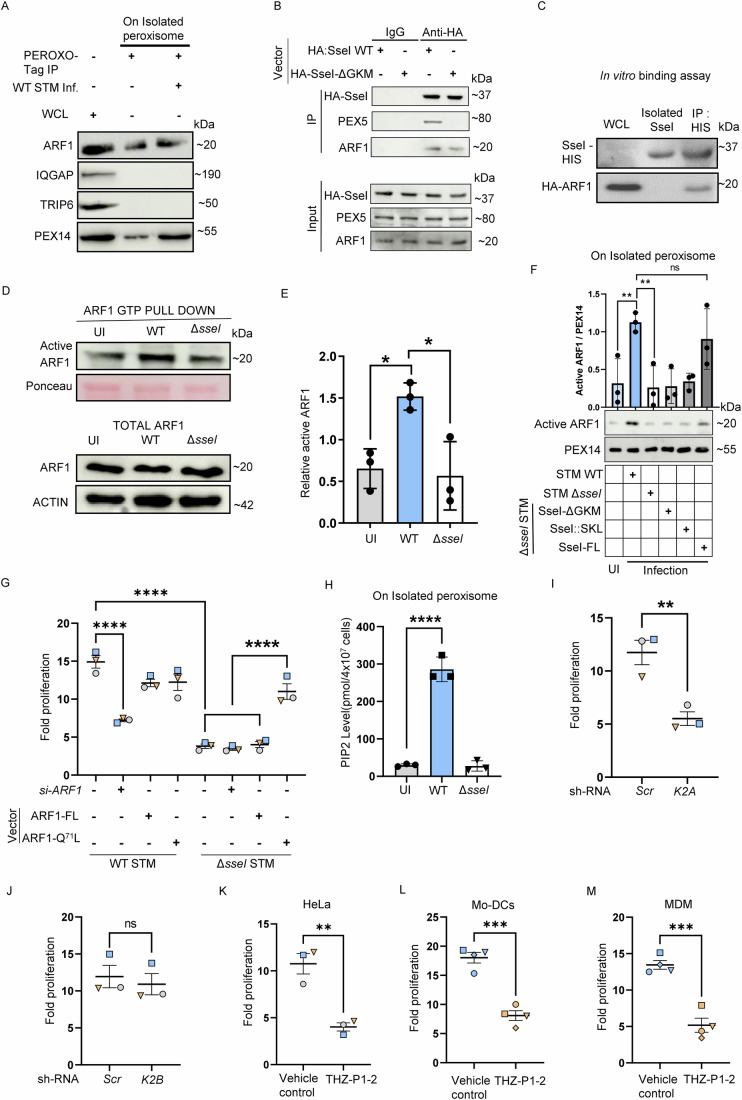
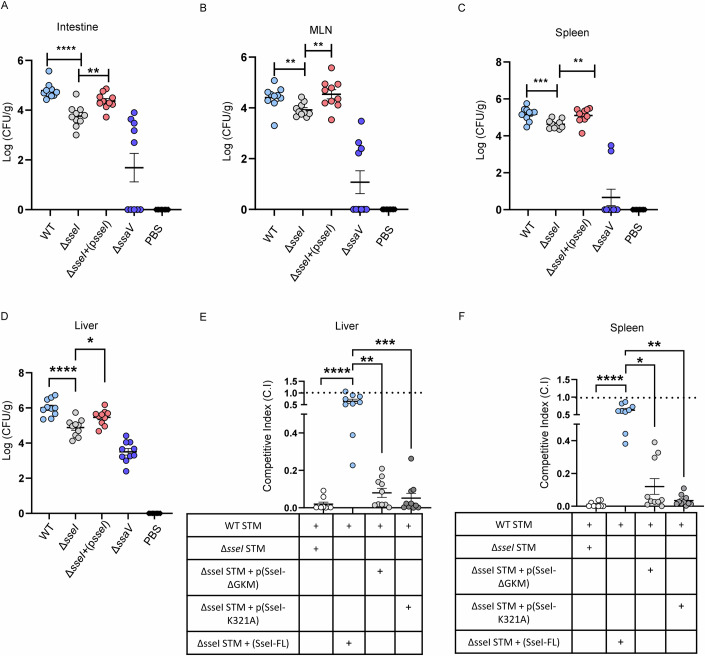
Salmonella enterica serotype Typhimurium (Salmonella) resides and multiplies intracellularly in cholesterol-rich compartments called Salmonella-containing vacuoles (SCVs) with actin-rich tubular extensions known as Salmonella-induced filaments (SIFs). SCV maturation depends on host-derived cholesterol, but the transport mechanism of low-density lipoprotein (LDL)-derived cholesterol to SCVs remains unclear. Here we find that peroxisomes are recruited to SCVs and function as pro-bacterial organelle. The Salmonella effector protein SseI is required for the interaction between peroxisomes and the SCV. SseI contains a variant of the PTS1 peroxisome-targeting sequence, GKM, localizes to the peroxisomes and activates the host Ras GTPase, ADP-ribosylation factor-1 (ARF-1). Activation of ARF-1 leads to the recruitment of phosphatidylinsolitol-5-phosphate-4 kinase and the generation of phosphatidylinsolitol-4-5-bisphosphate on peroxisomes. This enhances the interaction of peroxisomes with lysosomes and allows for the transfer of lysosomal cholesterol to SCVs using peroxisomes as a bridge. Salmonella infection of peroxisome-depleted cells leads to the depletion of cholesterol on the SCVs, resulting in reduced SIF formation and bacterial proliferation. Taken together, our work identified peroxisomes as a target of Salmonella secretory effectors, and as conveyance of host cholesterol to enhance SCV stability, SIF integrity, and intracellular bacterial growth.

Keywords: Salmonella Typhimurium; ARF1 Activation; Cholesterol; Peroxisome-targeting Sequence; Peroxisomes.


Conflict of interest statement

Disclosure and competing interests statement. The authors declare no competing interests.

Figures

Figure 1
Figure 1. Live STM temporally interacts with peroxisomes.
(A) HeLa cells were infected with GFP-expressing STM (blue) and immunostained for LAMP1 (red) and PEX14 (green). Representative confocal images of single Z-planes are shown at 3, 6, and 12 h post-infection. Yellow arrowheads indicate colocalization of PEX14 with SCVs. Scale bars: 10 µm (main panel), 2 µm (zoom). The intensity profile shows the overlap of green and red fluorescence signals. (B) HeLa cells were infected with GFP-expressing STM (blue) and immunostained for Rab7 (red) and catalase (green). Representative confocal images of single Z-planes are shown at 3, 6, and 12 h post-infection. Yellow arrowheads indicate colocalization of catalase with SCVs. Scale bars: 10 µm (main panel), 2 µm (zoom). The intensity profile shows the overlap of green and red fluorescence signals. (C) Graph showing the percentage of PEX14 colocalization with SCVs over time. Data for three independent experiments containing more than 180 cells are shown. (D) Graph indicating the percentage colocalization of catalase with SCVs is shown. Data for three independent experiments containing more than 180 cells are shown. (E) and EV-1. Live cell imaging of HeLa cells stably expressing PEROXO-tag (3xMyc-EGFP-PEX26) infected with mCherry-STM (MOI = 50). Cells were also treated with 100 nM of LysoTracker (blue) for 15 min before imaging to label acidic vacuoles. Time-lapse imaging was performed 5 h post-infection. Images were captured approximately every minute (80 s) till 15 min. White arrowheads indicate regions of interaction. Images shown are single Z slices for the indicated time points. Scale bars: 10 µm. (F) Microscopy images of MDM infected with live or heat-killed STM or latex beads (red) for 6 h. The cells were stained with anti-PEX14 antibody (green). Representative confocal images of single Z-planes are shown. Scale bar: 5 µm. (G) Graph indicating the percentage colocalization of PEX14 with STM is shown. Data for three independent experiments containing more than 180 cells are shown. Data information: Data were analyzed using one-way ANOVA (Sidak’s multiple comparisons test), (C) (**p = 0.0028), (D) (**p = 0.0028), and (G) (*p = 0.0134 and **p = 0.0035). Source data are available online for this figure.
Figure 2
Figure 2. Peroxisomes are required for efficient intracellular replication of STM.
(A) Mass spectrometry-based quantification of peroxisome-related proteins after 6 and 12 h of STM infection in HeLa cells. Among the 3412 proteins measured, 31 proteins associated with peroxisome and their changes in comparison with uninfected cells are shown in the heat map. (BD) Fold change in mRNA levels of indicated peroxisomal genes (PEX14 (B), PEX5 (C), and PEX11B (D)) in HeLa cells post 6 and 12 h of STM infection compared with uninfected (UI). Statistics were performed on the mean of three independent experiments (black dots). (E) Catalase activity in HeLa cells was measured at indicated time points post-STM infection. Data represent the mean of catalase activity from three independent experiments. (F) Graph indicating the number of peroxisomes per HeLa cell infected with STM (MOI = 50) after 3, 6, and 12 h of infection. Data for three independent experiments containing more than 200 cells are shown. (G) Change in fold proliferation of STM (MOI = 10) in MDM cells after silencing PEX14. Each dot represents one donor, and the data for 9 donors (n = 9) is shown here. (H) Change in fold proliferation of STM (MOI = 10) in HeLa cells after silencing PEX14. Three independent experiments were performed. Each dot represents the mean of an independent experiment. (I) Change in fold proliferation of STM (MOI = 10) in WT and PEX5 KO HeLa cells. Three independent experiments were performed. Each dot represents the mean of an independent experiment. (J) Change in fold proliferation of STM (MOI = 10) after treatment with 4-PBA (2 mM) in HeLa cells. Three independent experiments were performed. Each dot represents the mean of an independent experiment. (K) Representative confocal micrographs of HeLa cells infected with GFP-STM (Blue) at MOI of 50 for 12 h. Cells were fixed and stained using an anti-LAMP1 antibody (red) and an anti-PEX14 antibody (green). Scale bars: 10 µm. (L) Graph for the area occupied by SCVs and Sif/Area of the cell. Data for three independent experiments containing more than 80 cells are shown. Data information: (BF) Statistical significance was determined using one-way ANOVA; ‘ns’ indicates non-significant difference. (GL) Statistical significance was determined using student’s t-test, (G) (****p < 0.0001), (H) (*p = 0.0387), (I) (**p = 0.0012), (J) (**p = 0.0049), and (L) (**p = 0.0024). Source data are available online for this figure.
Figure 3
Figure 3. Salmonella effector protein, SseI, contains a putative PTS1 motif and interacts with peroxisomes.
(A) Confocal microscopy of HeLa cells infected with the wild-type (WT) or ΔssaV Salmonella Typhimurium (STM) (MOI = 50) (blue) for 6 h. Cells were immunostained for LAMP1 (red) and PEX14 (green). Structures co-stained for LAMP1 and STM were defined as Salmonella-containing vacuoles (SCVs). Yellow arrowheads indicate PEX14 colocalization with SCVs. Scale bars: 10 µm (main panel), 2 µm (inset). (B) Sequence alignment of conserved PTS1-like variant (GKM, red) in the C-terminus of multiple Salmonella species infecting different hosts. (C) Confocal microscopy of HeLa cells infected with ΔsseI GFP-STM (blue) (MOI = 50) for 6 h. Staining and image acquisition were performed as in (A). (D) Quantification of percentage PEX14 colocalization with SCVs. Data represent the mean ± SEM of three independent experiments. (E) Confocal microscopy of HeLa cells transfected with pEGFP::SKL, pEGFP::GKM, or empty vector (EV) pEGFP-EV plasmids. Cells were immunostained for PEX14 (red). Zoom panel indicate colocalization of GFP and PEX14 puncta. Scale bars: 10 µm (main panel), 2 µm (inset). (F) Quantification of percentage PEX14 colocalization EGFP::SKL and EGFP::GKM. Data are represented from three independent experiments. (G) Fold proliferation of WT STM, ΔssaV STM, ΔsseI STM, and ΔsseI STM (MOI = 10) complemented with pQE60-SseI in HeLa cells. Data represent the mean ± SEM of three independent experiments. (H) HeLa cells were transfected with N-terminally HA-tagged SseI constructs (full-length, ΔGKM, K321A) and a PEROXO-Tag plasmid. Peroxisomes were subsequently pulled down, and eluted samples were subjected to immunoblot analysis. SseI protein levels were determined using anti-HA antibodies, while protein loading was controlled by immunoblotting for PEX14. (I) Quantification of HA-SseI after peroxisome pulldown. Band intensity was normalized to PEX14. Data are represented from three independent experiments. (J) HeLa cells transfected with PEROXO-tag were infected with STM (MOI = 10) for 6 h. Peroxisomes were isolated from both infected and uninfected HeLa cells. Purified SseI protein was used as a positive control. Immunoblot analysis was performed on these samples using anti-SseI antibodies. (K) Immunoblot analysis of HA-SseI protein after protease protection assay on isolated peroxisomes. Catalase and PEX14 were used as controls for the matrix and membrane. (L) Fold proliferation of WT STM, ΔsseI STM, and ΔsseI STM complemented (MOI = 10) with pQE60-SseI clones (full length (FL), SKL, ΔGKM, K321A) in HeLa cells. Data represent the mean ± SEM of three independent experiments. Data analysis: Data were analyzed using one-way ANOVA (Sidak’s multiple comparisons test), (D) (****p < 0.0001), (G) (**p = 0.0053, ***p = 0.0004), (I) (**p = 0.0083), and (L) (****p < 0.0001, ***p = 0.0009). (F) Data were analyzed using student’s t-test in with ‘ns’ denotes no significant difference. Source data are available online for this figure.
Figure 4
Figure 4. SseI binds to host GTPase ARF1 and regulates its activity to induce PIP2 synthesis on peroxisome membrane.
(A) Immunoblot analysis of SseI-interacting proteins (IQGAP, TRIP6, and ARF1) on isolated peroxisomes from STM-infected (MOI = 10) and uninfected HeLa cells, with whole cell lysate (WCL). The representative blot was probed with anti-IQGAP, anti-TRIP6, and anti-ARF1 antibodies. (B) Immunoblot analysis of proteins after SseI pulldown from HeLa cells expressing HA-tagged SseI WT and SseI ΔGKM. Cell lysates (input) were used for SseI pulldown with anti-HA antibody. IgG was used as a control. The representative blot was probed with anti-HA, anti-ARF1, and anti-PEX5 antibodies. (C). Immunoblot analysis of in vitro binding between purified His-tagged SseI and HA-tagged ARF1 in HeLa whole cell lysates (WCL). The representative blot was probed with anti-His and anti-HA antibodies. (D) Immunoblot analysis of Active ARF1 was pulled down from WT, ΔsseI STM-infected (MOI = 10), and uninfected HeLa cells. Immunoblot analysis was performed to detect active ARF1. Ponceau staining was used as a loading control for the pulldown samples. Total ARF1 levels in whole cell lysates were assessed by immunoblotting, with actin as a loading control. (E) Densitometry analysis of ARF1 activation in WT and ΔsseI STM (MOI = 10) infected HeLa cells relative to uninfected controls. Data represent the mean ± SEM of three independent experiments. (F) Immunoblot and densitometry analysis of Active ARF1 protein levels after ARF1-GTP pulldown from isolated peroxisomes, cells infected with WT or ΔsseI STM, or ΔsseI STM complemented with pQE60-SseI clones (ΔGKM, SKL, full length (FL) (MOI = 10). Densitometry analysis represents three independent experiments. (G) Fold proliferation of WT or ΔsseI STM (MOI = 10) in HeLa cells transfected with full-length or constitutively active (Q71L) ARF1 or silenced ARF1. Data represent the mean ± SEM of three independent experiments. (H) ELISA analysis of PI (4,5) P2 (PIP2) levels on isolated peroxisomes from PEROXO-tag expressing HeLa cells infected with WT or ΔsseI STM. Data from three independent experiments are shown. (I, J) Fold proliferation of STM in HeLa cells after silencing PIP4K2A (I) or PIP4K2B (J). Data represent the mean ± SEM of three independent experiments. (K) Fold proliferation of WT STM (MOI = 10) in HeLa cells treated with PIP4K inhibitor THZ-P1-2 (1 µM). Data represent the mean ± SEM of three independent experiments. (L, M) Fold proliferation of WT STM (MOI = 10) in human monocyte-derived dendritic cells (Mo-DCs) (L) and human monocyte-derived macrophages (MDMs) (M) treated with PIP4K inhibitor THZ-P1-2 (1 µM). Data are from four healthy human donors. Data information: Data were analyzed using one-way ANOVA (Sidak’s multiple comparisons test), (E) (*p = 0.0211, *p = 0.0138), (F) (**p = 0.0092, **p = 0.0058), (G) (****p < 0.0001), and (H) (****p < 0.0001), ‘ns’ denotes no significant difference. (IM) Data were analyzed using student’s t-test, (I) (**p = 0.0091), (J, K) (**p = 0.0046), (L) (***p = 0.0002), (M) ((***p = 0.0003). ‘ns’ denotes no significant difference. Source data are available online for this figure.
Figure 5
Figure 5. Syt7 on SCV tethers PIP2 on peroxisome to facilitate cholesterol transfer.
(A) Graph representing the percentage of peroxisome-lysosome colocalization in HeLa cells after infection with WT STM with MOI = 10. Interaction of PEX14 and LAMP1 was monitored at 3, 6, and 12-h post-infection. Data for three independent experiments containing more than 200 cells are shown. (B) Cholesterol levels on isolated peroxisomes from HeLa cells infected with indicated bacterial strains (MOI = 10) for 6 h. Data represent the mean ± SEM of three independent experiments. (C) Representative confocal micrographs of HeLa and PEX5 knockout (KO) HeLa cells infected with either GFP-tagged WT STM or GFP-tagged ΔsseI STM (MOI = 50) for 6 h. Cells were immunostained with anti-LAMP1 antibody to label SCVs (red); cholesterol was stained using filipin (blue) and STM (green). Scale bars: 10 µm (main panel), 2 µm (inset). (D) Graph representing the change in fluorescence intensity of filipin, indicating cholesterol on SCVs. Data represent the mean ± SEM from three independent experiments with more than 180 cells analyzed. (E) Graph representing the changes in fold proliferation of STM (MOI = 10) after silencing NPC1 in HeLa cells. Data represent the mean ± SEM of three independent experiments. (F) Graph representing the changes in fold proliferation of STM (MOI = 10) after silencing ABCD1 in HeLa cells. Data represent the mean ± SEM of three independent experiments. (G) Change in fold proliferation of WT STM with LDL/U18666A in the media containing 1% FBS in HeLa cells. Data represent the mean ± SEM of three independent experiments. (H) Graph representing the changes in fold proliferation of STM (MOI = 10) after treatment with Atorvastatin (1 µM), the media containing 1% FBS in HeLa cells. Data represent the mean ± SEM of three independent experiments. (I) Representative confocal micrographs of HeLa cells infected with either GFP-tagged WT STM with Syt-7 Flag overexpressing plasmid. In Zoom, the yellow arrowhead represents the colocalization between Syt-7 (red), LAMP1 (green), and STM (blue). Scale bars: 10 µm (main panel), 2 µm (inset). (J) Representative confocal micrographs of uninfected HeLa cells with Syt-7 flag overexpressing plasmid. In Zoom, the yellow arrowheads represent the colocalization between Syt-7 (red) and PEX14 (green). Scale bars: 10 µm (main panel), 2 µm (inset). (K) Representative confocal micrographs of Syt-7 flag overexpressing HeLa cells infected with GFP-tagged WT STM (blue). In Zoom, the yellow arrowheads represent the colocalization between Syt-7 (red), PEX14 (green), and STM (blue). Scale bars: 10 µm (main panel), 2 µm (inset). (L) Graph representing the percentage colocalization of peroxisome and Syt-7 in HeLa cells after infection with WT STM and uninfected cells. Data of three independent experiments containing more than 80 cells are shown. (M, N) Change in fold proliferation of WT STM (MOI = 10) after silencing Syt-7 (M) or E-Syt1 (N) in HeLa cells. Data represent the mean ± SEM of three independent experiments. (O) Cholesterol levels on isolated peroxisomes from HeLa cells silenced for NPC1, SYT7, ARF1, and PIP4K2A and infected with WT STM (MOI = 10) for 6 h. Data represent the mean ± SEM of three independent experiments. Data analysis: Data were analyzed using one-way ANOVA (Sidak’s multiple comparisons test), (A) (*p = 0.0452), (B) (***p = 0.0007, **p = 0.0023) (D) (**p = 0.0018), (G) (**p = 0.0019), and (O) (*p = 0.0144). Data were analyzed using student’s t-test, (E) (***p = 0.0004), (F) (***p = 0.0006), (H) (**p = 0.0039), (L) (*p = 0.0313), (M) (**p = 0.0041). ‘ns’ denotes non-significant difference. Source data are available online for this figure.
Figure 6
Figure 6. SseI mutant strain is attenuated in the animal model of infection.
(AD) Intracellular STM burden in various organs. C57BL/6 mice (n = 10 per group) were orally infected with 107 CFU of WT or ΔsseI STM, ΔsseI STM complemented with pQE60-SseI, or ΔssaV STM. PBS served as a vehicle control. Mice were sacrificed after 7 days, and STM burden was enumerated by plating. CFU/g of intestine (A), MLN (B), spleen (C), and liver (D) were determined. (E, F) The competitive index of SseI complements strains in the liver (E) and spleen (F). C57BL/6 mice (n = 9 per group) were orally infected with a mixed inoculum containing WT STM, ΔsseI STM, and ΔsseI STM complemented with pQE60-SseI clones (PTS1 deletion – ΔGKM, point mutation on PTS1 K321A, and full length (FL)). Competitive index values were determined after 5 days post-infection by calculating the ratio of mutant to WT strains. Statistical analysis: Data were analyzed using student’s t-test, (A) (**p = 0.0026, ****p < 0.0001), (B) (**p = 0.0098, **p = 0.0061), (C) (***p = 0.0009, **p = 0.0053), (D) (****p < 0.0001, *p = 0.0111). (E, F) Data were analyzed using one-way ANOVA (non-parametric Kruskal–Wallis test), (E) (**p = 0.0097, ***p = 0.0004, ****p < 0.0001), (F) (**p = 0.0013, *p = 0.0199, ****p < 0.0001). Figure 6 (AD) was repeated with similar results in n = 6 mice per group. Source data are available online for this figure.
Figure EV1
Figure EV1. Peroxisomes are required for efficient intracellular replication of STM.
(A) Immunoblot and densitometry analysis of PEX14 protein levels in whole cell lysates of HeLa cells after STM infection for 3, 6, and 12 h. Actin served as a loading control. Densitometry analysis quantified PEX14 levels in STM-infected cells relative to uninfected controls with loading control actin. Graph represent the mean ± SEM of six independent experiments. (B) Immunoblot and densitometry analysis of PEX3 protein levels in whole cell lysates of HeLa cells after STM infection for 6 and 12 h. Actin served as a loading control. Densitometry analysis quantified PEX3 levels in STM-infected cells relative to uninfected controls. Graph represent the mean ± SEM of three independent experiments. (C, D) Fold change in mRNA levels of peroxisomal genes FAR1 (C) and HSD17B4 (D) in HeLa cells post 6 and 12 h of STM infection compared to uninfected controls. Graph represent the mean ± SEM of three independent experiments. (E) Immunoblot and densitometry analysis of PEX14 protein levels after knockdown (KD) in HeLa cells. The membrane was probed with an anti-PEX14 antibody to compare protein levels in WT and PEX14 KD HeLa cells with loading control GAPDH. Graph represent the mean ± SEM of three biological replicates. (F) Immunoblot confirming the generation of PEX5 knockout (KO) HeLa cells by the CRISPR/Cas9 system. The membrane was probed with anti-PEX5 AND anti-GAPDH antibodies to compare protein levels in WT and PEX5 KO HeLa cells. (G) Fluorescence microscopy images of peroxisomes in WT and PEX5 KO HeLa cells stained with anti-LAMP1 (red) and anti-PEX14 (green) antibodies. Scale bar: 10 µm. (H) Fluorescence microscopy images of peroxisomes in WT and PEX5 KO HeLa transfected with EGFP::SKL construct and stained with anti-ABCD1 (red) antibodies. Scale bar: 10 µm. (I) Graph representing cytoplasmic fluorescence intensity of EGFP::SKL in WT HeLa cell and PEX5 KO Cells. Data represent the ± SEM of three independent experiments. (J) Fold change in PEX14 mRNA expression after treatment with 4-PBA (2 mM) in HeLa cells. Graph represent the ± SEM of four biological replicates. (K) Change in fluorescence intensity was used to monitor the replication of mCherry-labeled STM or E. coli HT115 in the intestine of control, and Prx-5 silenced C. elegans worms. Imaging of the nematode digestive tract was performed on Day 8 of adulthood. Fluorescence intensity measurements were obtained from approximately 30 worms per experimental group. (LN) Graphs representing changes in cell viability after silencing PEX14 (L), in PEX5 KO HeLa cells (M), and after treatment with 4-PBA (2 mM) (N) in HeLa cells, as determined by MTT assay. Graph represent the ± SEM of three biological replicates. Data information: Data were analyzed using one-way ANOVA, Figures (AC) (**p = 0.0015), (D) (*p = 0.0363) and (K). ‘ns’ denotes no significant difference. Data were analyzed using the students’ t-tests, Figures (E) (*p = 0.0252), (I) (****p = 0.0001), (J) (*p = 0.0173), (LN), ‘ns’ denotes non-significant.
Figure EV2
Figure EV2. Validation of PEROXO-tagged stable cell line expressing 3X myc-EGFP-PEX26.
(A) Table listing key STM SPI2 effector proteins whose C-terminal amino acids (12 residues) were analyzed using in silico “PTS1 predictor” software to identify STM effector proteins containing the putative PTS1 motif. SseI is highlighted in green. (B) Fold proliferation of WT STM, ΔssaV STM, ΔsseI STM, and ΔsseI STM complemented with pQE60-SseI in MDM cells. Each dot represents one donor; data are shown for five donors. (C) Fluorescence microscopy images validating the generation of a PEROXO-tagged stable cell line obtained by transfecting HeLa cells with lentivirus overexpressing 3xMyc-EGFP-PEX26 (a). Cells were stained with anti-PEX14 antibody to confirm the peroxisomal localization of the PEROXO tag green (3xMyc-EGFP-PEX26) (b). Scale bars: 25 µm (a), 10 µm (b). (D) Immunoblot analysis showing the purity of isolated peroxisomes using different organelle markers. PEX14, catalase, VDAC, calnexin, and GAPDH were used as markers for peroxisomes, mitochondria, ER, and cytosol, respectively. (E) Graph representing changes in fold proliferation of STM in PEROXO-tag (3xMyc-EGFP-PEX26) expressing stable HeLa cells. Data represent the mean ± SEM of three independent experiments. (F) Graph representing the percentage invasion of STM in PEROXO-tag (3xMyc-EGFP-PEX26) expressing stable HeLa cells. Data represent the mean ± SEM of three independent experiments. (G) Immunoblot analysis of HA-SseI::SKL protein after protease protection assay on isolated peroxisomes. Catalase and PEX14 were used as controls for matrix and membrane proteins, respectively. (H) Immunoblot analysis of HeLa cells were either transfected with SseI-HA or left untransfected. Whole cell lysate (WCL) and isolated peroxisome protein samples were subjected to immunoblot analysis using antibodies against HA, catalase, PEX14, and GAPDH. (I) Light microscopy images of HeLa cells during wound healing assay. HeLa cells were transfected with either full-length or K321A mutant SseI constructs. Scale bar: 10 µm. (J) Graph representing the percentage migration of HeLa cells after transfected with either full-length (FL) or K321A mutant of SseI constructs. Data information: Data were analyzed using one-way ANOVA, (B) (***p = 0.0009, ****p = 0.0001) and (J) ‘ns’ denotes no significant difference. (E, F) Data were analyzed using student’s t-test, ‘ns’ denote non-significant.
Figure EV3
Figure EV3. SseI interacts with ARF1 to regulate its activity on the peroxisome membrane.
(A) Interactome of SseI with host proteins. Data retrieved from published literature. (B) Protein gel stained with Coomassie brilliant blue indicating purified His-tag SseI (~37 kDa) isolated from BL21 strain of E. coli. (C) Graph representing the silencing efficiency of ARF1 in HeLa cells was validated using qPCR. Graph represent the ± SEM of three biological replicates. (D) Graph representing percentage cell viability of HeLa cells after silencing ARF1 measured by MTT assay. Graph represent the ± SEM of four biological replicates. (E) PIP assay strip indicating protein-lipid overlay to identify the interaction of SseI with various indicated membrane lipids. Purified SseI protein was incubated on a lipid-coated membrane. A scheme of the PIP-strip membrane is presented. The red line highlights the phospholipid species tested. (F) Immunoblot and densitometry analysis of PIP4K2A protein levels after wild type (WT) or ΔsseI STM infection (MOI = 10) for 3, 6, and 12 h. ‘UI’ denotes uninfected cells. Densitometry analysis is from three biological replicates. (G) Immunoblot and densitometry analysis of PIP4K2B protein levels after wild type (WT) or ΔsseI STM infection (MOI = 10) for 3, 6, and 12 h. ‘UI’ denotes uninfected cells. Densitometry analysis is from three biological replicates. (H) Immunoblot analysis of PIP4K2A protein levels after silencing PIP4K2A in HeLa cells. GAPDH is used as the loading control. Graph represent the ±SEM of three biological replicates. (I) Immunoblot analysis of PIP4K2B protein levels after silencing PIP4K2B in HeLa cells. GAPDH is used as the loading control. Graph represent the ± SEM of three biological replicates. (J, K) Graph representing percentage cell viability of HeLa cells after silencing PIP4K2A (J) and PIP4K2B (K) in HeLa cells measured by MTT assay. Graph represent the ± SEM of three biological replicates. (L) Graph representing percentage cell viability of HeLa cells after treatment with THZ-P1-2 (1 µM) measured by MTT assay. Graph represent the ± SEM of three biological replicates. Data information: Data were analyzed using one-way ANOVA, (F) (*p = 0.0274), and (G) ‘ns’ denotes no significant difference. Data were analyzed using student’s t-test, (C) (**p = 0.0065), (D, H) (***p = 0.0001), (I) (*P = 0.0184), (JL), ‘ns’ denotes non-significant.
Figure EV4
Figure EV4. Syt7 on SCV tethers PIP2 on peroxisome to facilitate cholesterol transfer.
(A) Fold change in mRNA levels of NPC1 after its silencing in HeLa cells. Graph represent the ± SEM of three biological replicates. (B) Fold change in mRNA levels of ABCD1 after its silencing in HeLa cells. Graph represent the ± SEM of three biological replicates. (C) Graph representing the changes in fold proliferation of STM (MOI = 10) after silencing LDLR in HeLa cells. Three independent experiments were performed. Each dot represents the mean of an independent experiment. (D) Fold change in mRNA levels of LDLR after its silencing in HeLa cells. Graph represent the ± SEM of three biological replicates. (E) Fold proliferation of STM (MOI = 10) in HeLa cells under LDL-free FBS conditions following Atorvastatin (1 µM). HeLa cells were treated with Atorvastatin and DMSO as Vehicle control. Three independent experiments were performed. Each dot represents the mean of an independent experiment. (F) Fold proliferation of STM (MOI = 10) in HeLa cells under 1% FBS conditions following HMGCR silencing. HeLa cells were transfected with siRNA targeting HMGCR or scrambled siRNA (Scr) control. Three independent experiments were performed. Each dot represents the mean of an independent experiment. (G) Graph representing the changes in fold proliferation of STM (MOI = 10) after silencing DHCR24 in HeLa cells at 1% FBS condition. Three independent experiments were performed. Each dot represents the mean of an independent experiment. (H) Fold change in mRNA levels of HMGCR after its silencing in HeLa cells. Graph represent the ± SEM of three biological replicates. (I) Fold change in mRNA levels of DHCR24 after its silencing in HeLa cells. Graph represent the ± SEM of three biological replicates. (J) Graph representing the changes in intracellular fold proliferation of STM (MOI = 10) in HeLa cells at 10% and 1% FBS condition. Three independent experiments were performed. Each dot represents the mean of an independent experiment. (K) Fold change in mRNA levels of SYT7 after its silencing in HeLa cells. Graph represent the ± SEM of three biological replicates. (L) Fold change in mRNA levels of ESYT1 after its silencing in HeLa cells. Graph represent the ± SEM of three biological replicates. (M) Representative microscopy images of HeLa cells infected with GFP-tagged STM (blue) (MOI = 50) and immunostained for endogenous Syt-7/E-syt1 (green) and LAMP1 (red) antibody. The intensity profile indicating the overlap of signals of Syt-7-LAMP1 and E-syt1-LAMP1 is shown on the right. Scale bars: 10 µm, 2 µm. (N) Immunoblot Analysis of Syt-7 Localization on Peroxisomes in HeLa cells. Cells were either infected with STM or left uninfected. Whole-cell lysates (WCL) and isolated peroxisome protein samples (both washed and unwashed) were subjected to immunoblot analysis using antibodies against Syt-7, the peroxisomal marker PEX14, and GAPDH as a loading control. Data information: (AF) Data were analyzed using student’s t-test; (A) (****p = 0.0001), (B) (**p = 0.0043), (C) (*p = 0.0297), (D) (*p = 0.0156), (E) (**p = 0.0053), (F) (*p = 0.0160), (G, H) (**p = 0.0043), (I) (***p = 0.0002), (J) (*p = 0.0253), and (K) (****p = 0.0001), (L) (*p = 0.0182), ‘ns’ denotes non-significant.

References

    1. Alvarez MI, Glover LC, Luo P, Wang L, Theusch E, Oehlers SH, Walton EM, Tram TTB, Kuang YL et al (2017) Human genetic variation in VAC14 regulates Salmonella invasion and typhoid fever through modulation of cholesterol. Proc Natl Acad Sci USA 114(37):E7746–E7755 - PMC - PubMed
    1. Arand M, Knehr M, Thomas H, Zeller HD, Oesch F (1991) An impaired peroxisomal targeting sequence leading to an unusual bicompartmental distribution of cytosolic epoxide hydrolase. FEBS Lett 294(1-2):19–22 - PubMed
    1. Ast J, Stiebler AC, Freitag J, Bolker M (2013) Dual targeting of peroxisomal proteins. Front Physiol 4:297 - PMC - PubMed
    1. Beetham JK, Tian T, Hammock BD (1993) cDNA cloning and expression of a soluble epoxide hydrolase from human liver. Arch Biochem Biophys 305(1):197–201 - PubMed
    1. Behera A, Jain P, Ganguli G, Biswas M, Padhi A, Pattanaik KP, Nayak B, Ergun S, Hagens K et al (2022) Mycobacterium tuberculosis acetyltransferase suppresses oxidative stress by inducing peroxisome formation in macrophages. Int J Mol Sci 23(5):2584 - PMC - PubMed

LinkOut - more resources