. 2024 Dec 18;24(1):900.
doi: 10.1186/s12888-024-06400-z.

Differential late-stage face processing in autism: a magnetoencephalographic study of fusiform gyrus activation

Affiliations

Differential late-stage face processing in autism: a magnetoencephalographic study of fusiform gyrus activation

Darko Sarovic et al. BMC Psychiatry. .

Abstract

Background: Autism is associated with alterations of social communication, such as during face-to-face interactions. This study aimed to probe face processing in autistics with normal IQ utilizing magnetoencephalography to examine event-related fields within the fusiform gyrus during face perception.

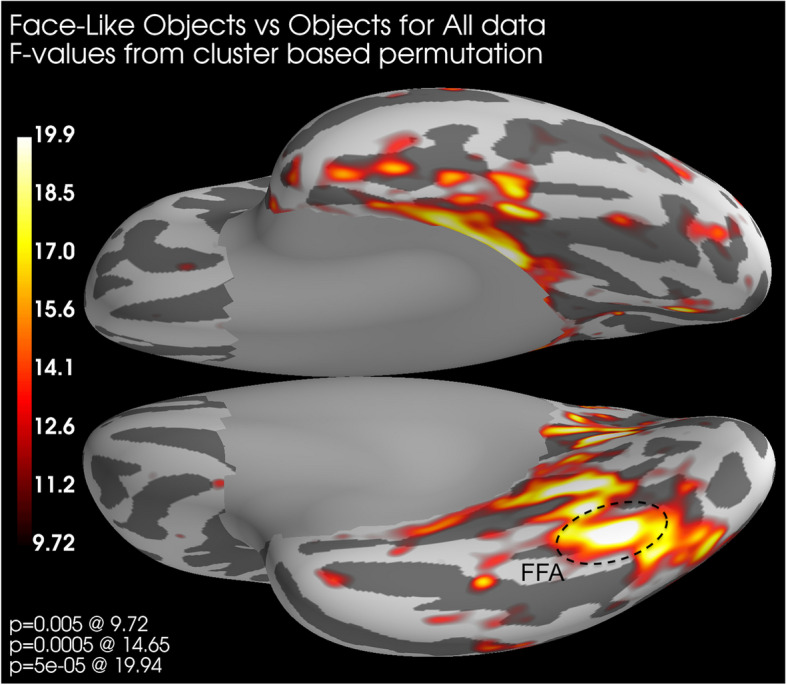
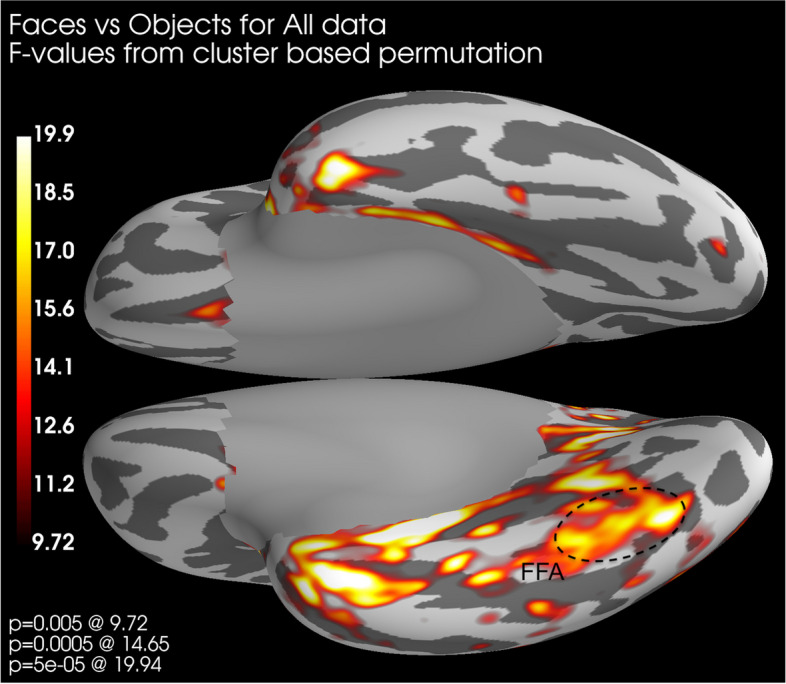
Methods: A case-control cohort of 22 individuals diagnosed with autism and 20 age-matched controls (all male, age 29.3 ± 6.9 years) underwent magnetoencephalographic scanning during an active task while observing neutral faces, face-like pareidolic objects, and non-face objects. The fusiform face area was identified using a face localizer for each participant, and the cortical activation pattern was normalized onto an average brain for subsequent analysis.

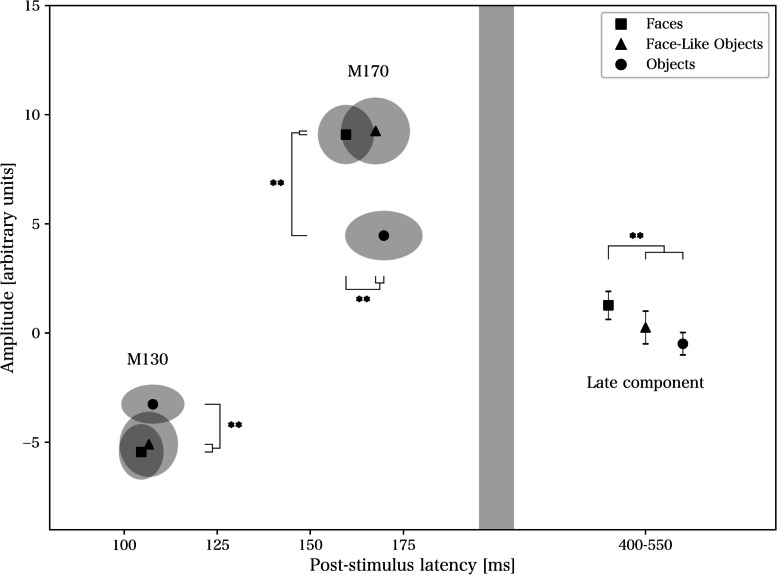
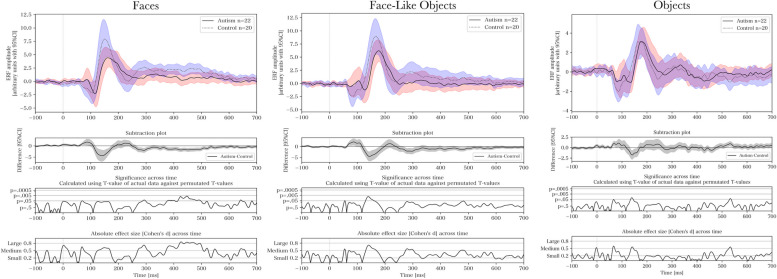
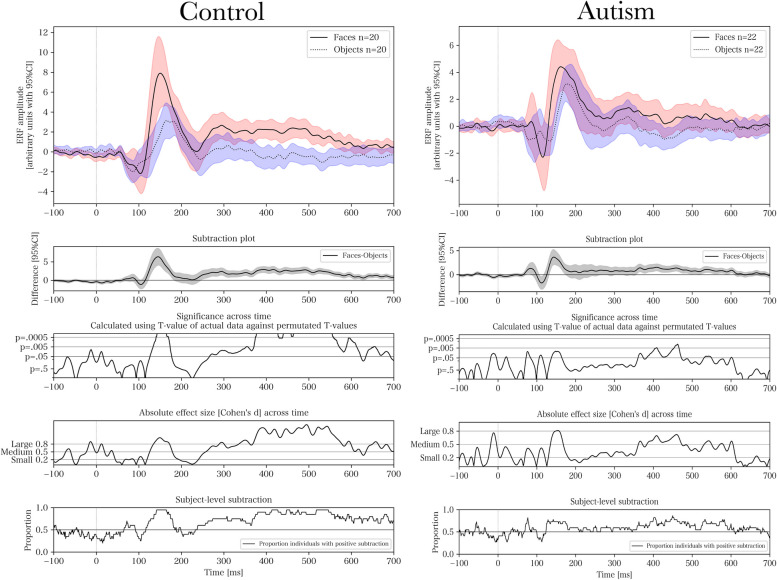
Results: Early post-stimulus activation amplitudes (before 100-200 ms) indicated differentiation between stimuli containing fundamental facial features and non-face objects in both groups. In contrast, later activation (400-550 ms) differentiated real faces from both pareidolic and non-face objects across both groups and faces from objects in controls but not in autistics. There was no effect of autistic-like traits.

Conclusions: The absence of group differences in early activation suggest intact face detection in autistics possessing a normal IQ. Later activation captures a greater degree of the complexity and social information from actual faces. Although both groups distinguished faces from pareidolic and non-face objects, the control group exhibited a slightly heightened differentiation at this latency, indicating a potential disadvantage for autistics in real face processing. The subtle difference in late-stage face processing observed in autistic individuals may reflect specific cognitive mechanisms related to face perception in autism.

Keywords: Autism; Biomarker; Face processing; Fusiform face area; Magnetoencephalography; Pareidolia.


Conflict of interest statement

Declarations. Ethics approval and consent to participate: The study was approved by the Regional Ethical Board in Gothenburg, Sweden (DNR: 552–14) and informed consent was gathered from all participants. Consent for publication: The face stimuli used in the study are part of the openly available NimStim dataset of faces (Tottenham et al. 2009). We have received authorization by the authors to use the right-hand images in Fig. 1 (identity #28 in the dataset) for publication. Competing interests: The authors declare no competing interests.

Figures

Fig. 1
Fig. 1
Examples of stimuli presented for OBJECTS paradigm. From left to right: pareidolic face-like object, non-face object, real face and inverted face
Fig. 2
Fig. 2
Across-group results of event-related fields within the right fusiform area. * and ** denote significant and Holm-Bonferroni-corrected significant differences for main effects from mixed analyses of variance
Fig. 3
Fig. 3
Within-group results of event-related fields within the right fusiform area. * and ** denote significant (p < .05) and Holm-Bonferroni-corrected significant differences (see Table 2 for p-value thresholds) for main effects from one-way analyses of variance
Fig. 4
Fig. 4
Source space activations within the right fusiform face area averaged for each group and stimulus
Fig. 5
Fig. 5
Between-group pairwise group comparison for each stimulus type. Cluster-based permutation test for event-related fields with 5000 permutations when comparing autism and control for faces (p = .10), face-like objects (p = .44), and objects (p = .60). From top to bottom, the subplots present, for each time-point, the averaged event-related field (ERF) activation, a stimulus-wise subtraction for the averaged ERFs, and the permutation-based T-values and effect sizes
Fig. 6
Fig. 6
Within-group pairwise comparisons between faces and objects. Cluster-based permutation test for event-related fields with 5000 permutations when comparing faces and objects for control (p < .0002) and autism (p = .067). From top to bottom, the subplots present, for each time-point, the averaged event-related field (ERF) activation, a stimulus-wise subtraction for the averaged ERFs, permutation-based T-values and effect sizes, and the proportion of individuals with positive within-subject subtractions
Fig. 7
Fig. 7
Within-group pairwise comparisons between face-like objects and objects. Cluster-based permutation test for event-related fields with 5000 permutations when comparing face-like objects and objects for control (p = .027) and autism (p = .053). From top to bottom, the subplots present, for each time-point, the averaged event-related field (ERF) activation, a stimulus-wise subtraction for the averaged ERFs, permutation-based T-values and effect sizes, and the proportion of individuals with positive within-subject subtractions
Fig. 8
Fig. 8
Within-group pairwise comparisons between faces and face-like objects. Cluster-based permutation test for event-related fields with 5000 permutations when comparing faces and face-like objects for control (p = .02) and autism (p = .63). From top to bottom, the subplots present, for each time-point, the averaged event-related field (ERF) activation, a stimulus-wise subtraction for the averaged ERFs, permutation-based T-values and effect sizes, and the proportion of individuals with positive within-subject subtractions
Fig. 9
Fig. 9
Source space distribution of F-values around 150–170 ms from cluster-based permutation when comparing face-like objects and objects across all participants
Fig. 10
Fig. 10
Source space distribution of F-values around 130–150 ms from cluster-based permutation when comparing faces and objects across all participants

Similar articles

References

    1. Pelphrey KA, Sasson NJ, Reznick JS, Paul G, Goldman BD, Piven J. Visual scanning of faces in autism. J Autism Dev Disord. 2002;32(4):249–61. - PubMed
    1. Apicella F, Sicca F, Federico RR, Campatelli G, Muratori F. Fusiform gyrus responses to neutral and emotional faces in children with autism spectrum disorders: a high density ERP study. Behav Brain Res. 2013;251:155–62. - PubMed
    1. Jemel B, Mottron L, Dawson M. Impaired face processing in autism: fact or artifact? J Autism Dev Disord. 2006;36(1):91–106. - PubMed
    1. Farashi S, Jenabi E, Bashirian S, et al. Differences Between Autism Spectrum Disorder and Typically Developing Individuals During Visual Information Processing—A Systematic Review and Meta-analysis Focusing on Visual Event-Related Potentials. Rev J Autism Dev Disord. 2023. 10.1007/s40489-023-00383-5.
    1. Schultz RT. Developmental deficits in social perception in autism: the role of the amygdala and fusiform face area. Int J Dev Neurosci. 2005;23(2–3):125–41. - PubMed

LinkOut - more resources