

Predicting responsiveness to GLP-1 pathway drugs using real-world data
- PMID: 39695549
- PMCID: PMC11654408
- DOI: 10.1186/s12902-024-01798-9
Predicting responsiveness to GLP-1 pathway drugs using real-world data
Abstract
Background: Medications targeting the glucagon-like peptide-1 (GLP-1) pathway are an important therapeutic class currently used for the treatment of Type 2 diabetes (T2D). However, there is not enough known about which subgroups of patients would receive the most benefit from these medications.
Objective: The goal of this study was to develop a predictive model for patient responsiveness to medications, here collectively called GLP-1 M, that include GLP-1 receptor agonists and dipeptidyl peptidase-4 (DPP4) inhibitors (that normally degrade endogenously-produced GLP-1). Such a model could guide clinicians to consider certain patient characteristics when prescribing second line medications for T2D.
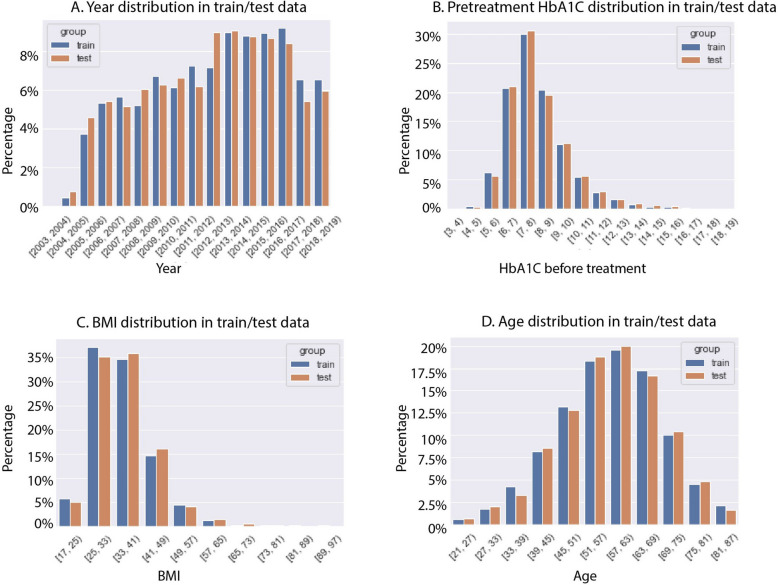
Methods: We analyzed de-identified electronic health records of 7856 subjects with T2D treated with GLP-1 M drugs at Vanderbilt University Medical Center from 2003-2019. Using common clinical features (including commonly ordered lab tests, demographic information, other T2D medications, and diabetes-associated complications), we compared four different models: logistic regression, LightGBM, artificial neural network (ANN), and support vector classifier (SVC).
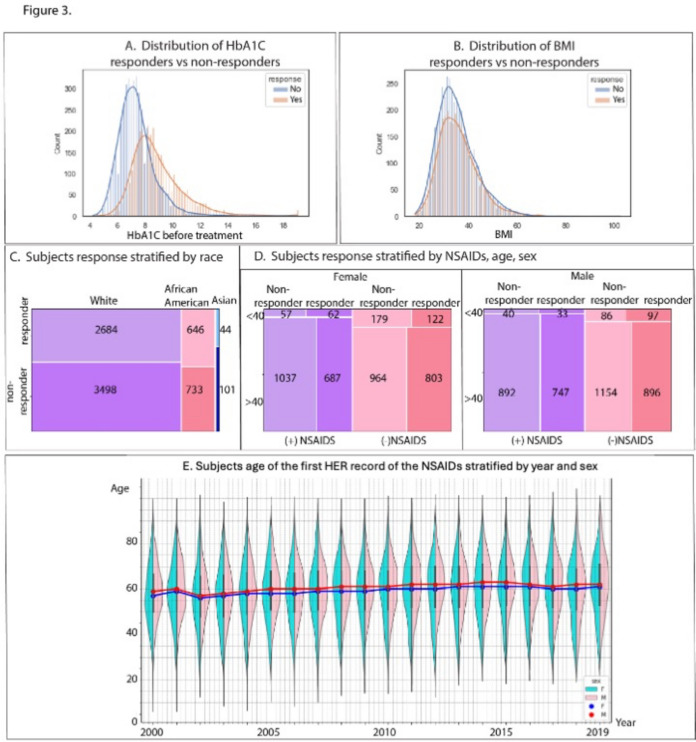
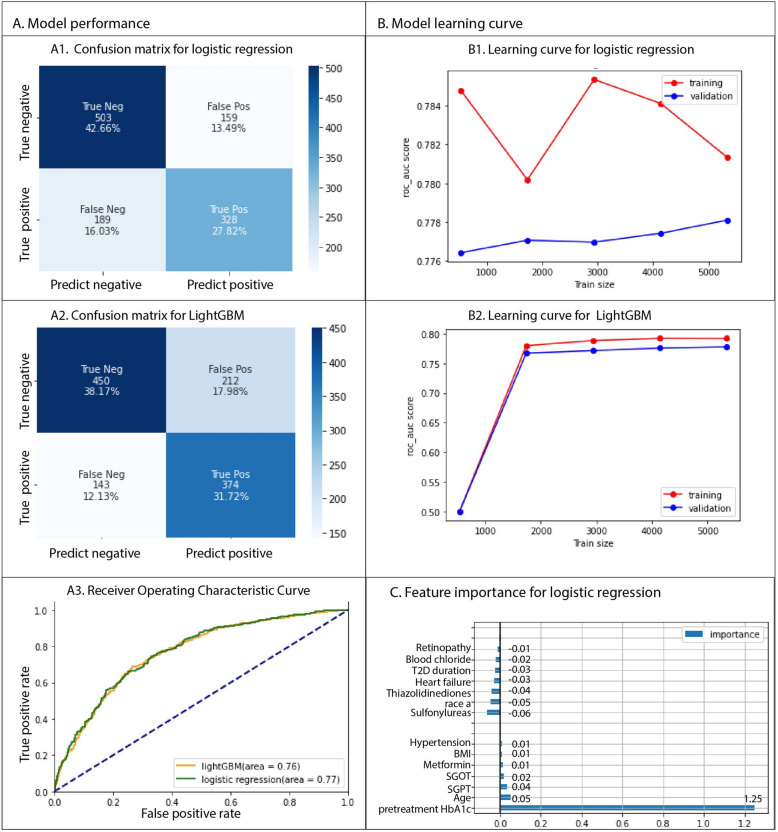
Results: Our analysis revealed that the traditional logistic regression model outperforms the other machine learning models, with an area under the Receiver Operating Characteristic curve (auROC) of 0.77.Our model showed that higher pre-treatment HbA1C is a dominant feature for predicting better response to GLP-1 M, while features such as use of thiazolidinediones or sulfonylureas is correlated with poorer response to GLP-1 M, as assessed by lowering of hemoglobin A1C (HbA1C), a standard marker of glycated hemoglobin used for assessing glycemic control in individuals with diabetes. Among female subjects under 40 taking GLP-1 M, the simultaneous use of non-steroidal anti-inflammatory drugs (NSAIDs) was associated with a greater reduction in HbA1C (0.82 ± 1.72% vs 0.28 ± 1.70%, p = 0.008).
Conclusion: These findings indicate a thorough analysis of real-world electronic health records could reveal new information to improve treatment decisions for the treatment of T2D. The predictive model developed in this study highlights the importance of considering individual patient characteristics and medication interactions when prescribing GLP-1 M drugs.
1. Patient characteristics such as poorer blood glucose control, higher body mass, and shorter duration of diabetes predict better response to medications that target the GLP-1 pathway. 2. Simultaneous use of NSAIDs (for example ibuprofen) was associated with better responsiveness in women under 40.3. Combining GLP-1 pathway medications with some other commonly used T2D medications (for example thiazolidinediones or sulfonylureas) may not have an additional benefit.
Keywords: Electronic health record; GLP-1; HbA1c; Predictive model; Type 2 diabetes.
© 2024. This is a U.S. Government work and not under copyright protection in the US; foreign copyright protection may apply.
Conflict of interest statement
Declarations. Ethics approval and consent to participate: All methods were carried out in accordance with relevant guidelines and regulations. All experimental protocols were approved by the Vanderbilt University Medical Center IRB Committee/Committee on Human Research Protection. All of the data used in the current study was obtained from a fully deidentified synthetic derivative of the electronic health record from Vanderbilt University Medical Center. Individual informed consent for participation in the current study was waived since subject information is deidentified and specific patients cannot be identified. However, at the time of their visit, patients can opt out of being included in the database. Thus, all subjects in the database chose to be included. Consent for publication: Not applicable. Competing interests: The authors declare no competing interests.
Figures

References
-
- Saeedi P, Petersohn I, Salpea P, Malanda B, Karuranga S, Unwin N, Colagiuri S, Guariguata L, Motala AA, Ogurtsova K, Shaw JE, Bright D, Williams R. Global and regional diabetes prevalence estimates for 2019 and projections for 2030 and 2045: Results from the International Diabetes Federation Diabetes Atlas, 9(th) edition. Diabetes Res Clin Pract. 2019;157:107843. - PubMed
-
- Centers for Disease Control and Prevention USDoHaHS (Ed.). Centers for Disease Control and Prevention. National Diabetes Statistics Report, 2020. 2020. https://www.cdc.gov/diabetes/php/dataresearch/index.html.
-
- Association AD: 9. Pharmacologic Approaches to Glycemic Treatment: <em>Standards of Medical Care in Diabetes—2021</em>. Diabetes care 2021;44:S111-S124 - PubMed
MeSH terms
Substances
Grants and funding
LinkOut - more resources
Full Text Sources
Medical
Miscellaneous
