

Expression of mTOR, CD163, α-SMA, FOXp3 as survival predictors and its significance in patients with oral squamous cell carcinoma
- PMID: 39695576
- PMCID: PMC11653707
- DOI: 10.1186/s12903-024-05245-y
Expression of mTOR, CD163, α-SMA, FOXp3 as survival predictors and its significance in patients with oral squamous cell carcinoma
Abstract
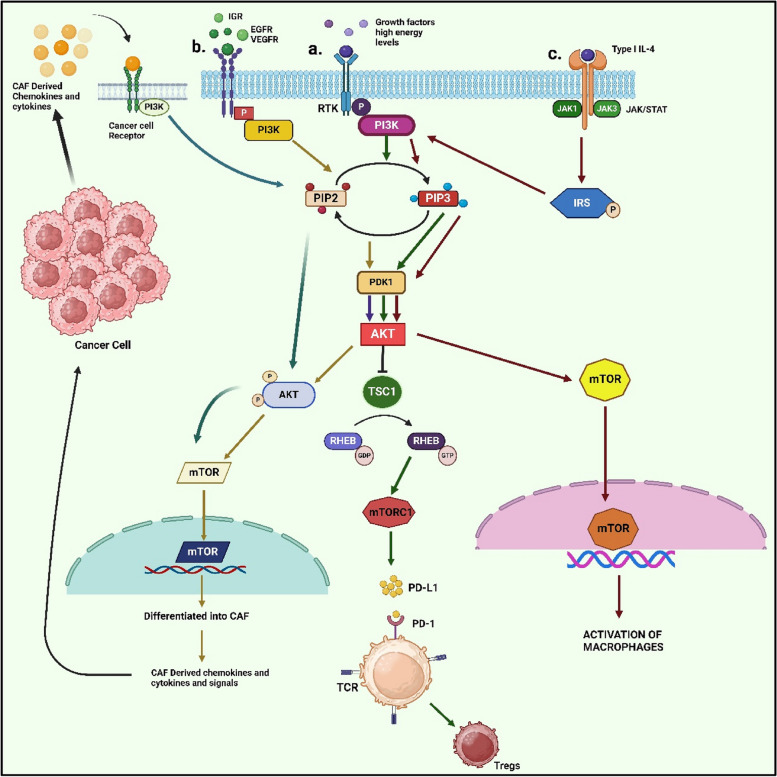
Background: Oral cancer; categorised under head and neck cancers (HNC) predominantly originates from squamous cells and is referred as oral squamous cell carcinoma (OSCC). Various factors (internal and external) causes OSCC. PI3K/AKT/mTOR pathways are known to be primarily mutated in HNC. mTOR remains as a key regulator for various physiological and developmental processes in normal and cancer cells. Cancer cells are surrounded by tumor microenvironment, majorly composed of immune cells. Cancer associated fibroblasts, macrophages and regulatory T cells controlled by mTOR, plays an important role in the progression of cancer.
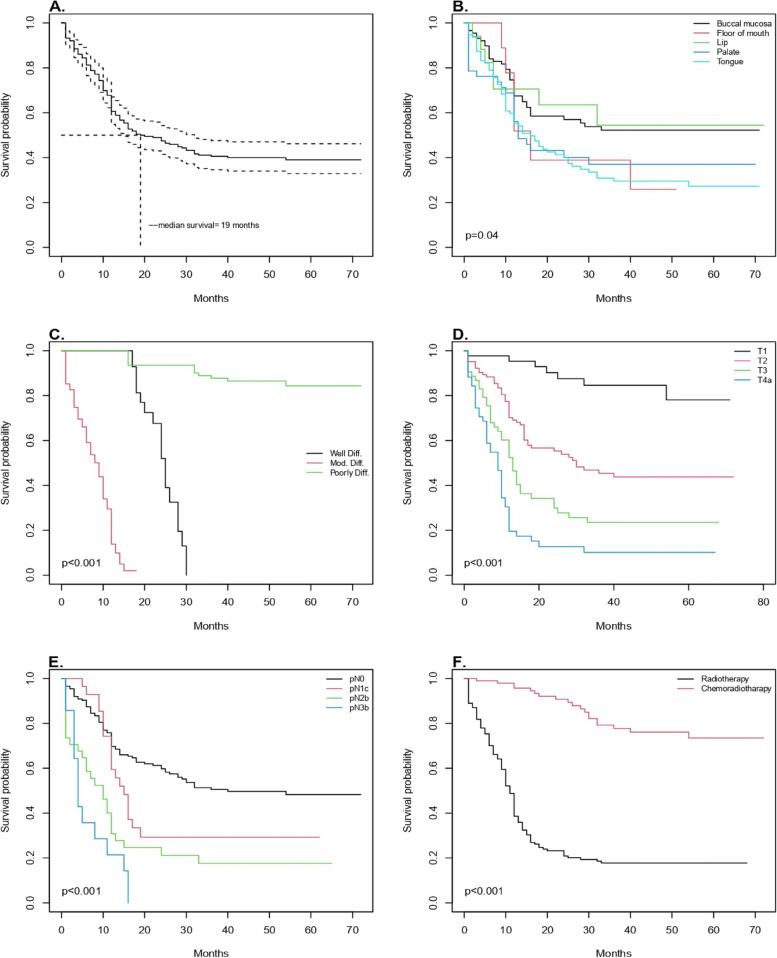
Methods: Two hundred sixty retrospective patient samples were collected along with their demographical and clinic-pathological data. Here, we have analysed expression of mTOR, α-SMA, CD163 and FOXp3 using immunohistochemistry and their survival outcomes were calculated using Kaplan-Meier statistical method.
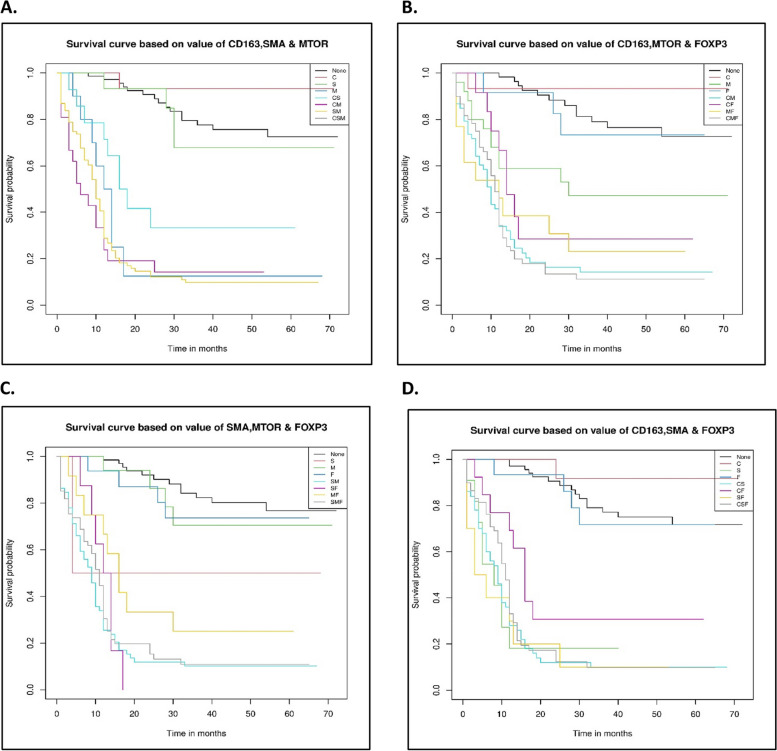
Results: Overexpression of CD163 and α-SMA was detected in samples of patients compared to mTOR and FOXp3. Their expression was compared with clinico-oncological parameters. We also observed two and three combinations of markers and its association with the prognosis of the cancer. The results suggest, higher the expression of all the four markers in combination correlated to poor prognosis of patients and vice-versa.
Conclusion: The study reveals that over expression of CD163 and α-SMA is strongly associated with disease outcome. The combinations of all the four marker expression profile will be emerging strategy towards prognosis and also to determine survival outcomes in patients. This is a pioneering observation of these combinations of markers in OSCC despite certain limitations.
Keywords: Head and Neck cancer; Immunohistochemical Markers; Kaplan-Meier; Prognosis; Retrospective.
© 2024. The Author(s).
Conflict of interest statement
Declarations. Ethics approval and consent to participate: The study was approved by Institutional Review Board known as Institutional Ethics Committee of Sri Ramachandra Institute of Higher Education and Research, bearing reference number IEC-NI/21/APR/78/53 dated 19.03.2021. The present study utilised samples (tissue blocks) from Department of Oral Pathology, Sri Ramachandra Dental College and Hospital and Department of Pathology, Sri Ramachandra Medical College and Research Institute, SRIHER. Written informed consent from patients towards sample collection have been obtained as part of intervention/procedure. Consent for publication: Not Applicable. Competing interests: The authors declare no competing interests.
Figures


References
-
- Chamoli A, Gosavi AS, Shirwadkar UP, Wangdale KV, Behera SK, Kurrey NK, et al. Overview of oral cavity squamous cell carcinoma: risk factors, mechanisms, and diagnostics. Oral Oncol. 2021;121: 105451. - PubMed
-
- de Morais EF, Almangush A, Salo T, da Silva SD, Kujan O, Coletta RD. Emerging histopathological parameters in the prognosis of oral squamous cell carcinomas. Histol Histopathol. 2023:18634. Available from: https://pubmed.ncbi.nlm.nih.gov/37310089/. - PubMed
MeSH terms
Substances
LinkOut - more resources
Full Text Sources
Medical
Research Materials
Miscellaneous
