

A potential predictive model based on machine learning and CPD parameters in elderly patients with aplastic anemia and myelodysplastic neoplasms
- PMID: 39695587
- PMCID: PMC11654282
- DOI: 10.1186/s12911-024-02781-z
A potential predictive model based on machine learning and CPD parameters in elderly patients with aplastic anemia and myelodysplastic neoplasms
Abstract
Background: Aplastic anemia (AA) and myelodysplastic neoplasms (MDS) have similar peripheral blood manifestations and are clinically characterized by reduced hematological triad. It is challenging to distinguish and diagnose these two diseases. Hence, utilizing machine learning methods, we employed and validated an algorithm that used cell population data (CPD) parameters to diagnose AA and MDS.
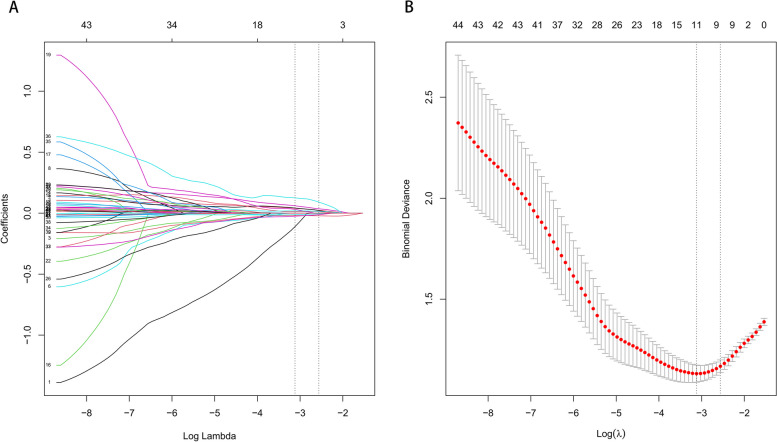
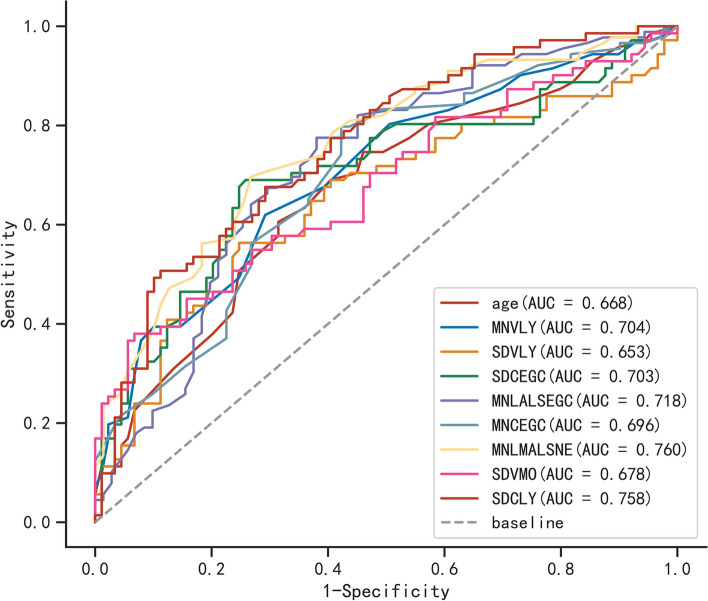
Methods: In this study, CPD parameters were obtained from the Beckman Coulter DxH800 analyzer for 160 individuals diagnosed with AA or MDS through a comprehensive retrospective analysis. The individuals were unselectively assigned to a training cohort (77%) and a testing cohort (23%). Additionally, an external validation cohort consisting of eighty-six elderly patients with AA and MDS from two additional centers was established. The discriminative parameters were carefully analyzed through univariate analysis, and the most predictive variables were selected using least absolute shrinkage and selection operator (LASSO) regression. Six machine learning algorithms were utilized to compare the performance of forecasting AA and MDS patients. The area under the curves (AUCs), calibration curves, decision curves analysis (DCA), and shapley additive explanations (SHAP) plots were employed to interpret and assess the model's predictive accuracy, clinical utility, and stability.
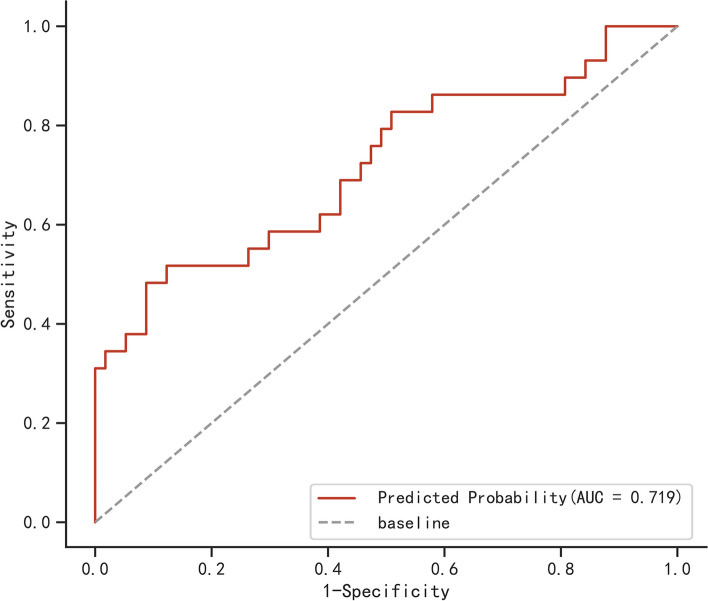
Results: After the comparative evaluation of various models, the logistic regression model emerged as the most suitable machine learning model for predicting the probability of AA and MDS, which utilized five principal variables (age, MNVLY, SDVLY, MNLALSEGC, and MNCEGC) to accurately estimate the risk of these diseases. The best model delivered an AUC of 0.791 in the testing cohort and had a high specificity (0.850) and positive predictive value (0.818). Furthermore, the calibration curve indicated excellent agreement between actual and predicted probabilities. The DCA curve further supported the clinical utility of our model and offered significant clinical advantages in guiding treatment decisions. Moreover, the model's performance was consistent in an external validation group, with an AUC of 0.719.
Conclusions: We developed a novel model that effectively distinguished elderly patients with AA and MDS, which had the potential to provide physicians assistance in early diagnosis and the proper treatment for the elderly.
Keywords: Aplastic anemia; Cell population data; Machine learning; Myelodysplastic neoplasms; Parameters.
© 2024. The Author(s).
Conflict of interest statement
Declarations. Ethics statement and consent to participate: This study was approved by the Ethics Committee of the First Affiliated Hospital of Zhejiang Chinese Medical University with approval number 2024-KLS-348–01. Written informed consent to participate was obtained from all of the participants in the study. Consent for publication: Not applicable. Competing interests: The authors declare no competing interests.
Figures


Similar articles
-
A predictive model for disease severity among COVID-19 elderly patients based on IgG subtypes and machine learning.Front Immunol. 2023 Nov 30;14:1286380. doi: 10.3389/fimmu.2023.1286380. eCollection 2023. Front Immunol. 2023. PMID: 38106427 Free PMC article.
-
Prediction and validation of pathologic complete response for locally advanced rectal cancer under neoadjuvant chemoradiotherapy based on a novel predictor using interpretable machine learning.Eur J Surg Oncol. 2024 Dec;50(12):108738. doi: 10.1016/j.ejso.2024.108738. Epub 2024 Oct 6. Eur J Surg Oncol. 2024. PMID: 39395242
-
Early prediction of sepsis associated encephalopathy in elderly ICU patients using machine learning models: a retrospective study based on the MIMIC-IV database.Front Cell Infect Microbiol. 2025 Apr 17;15:1545979. doi: 10.3389/fcimb.2025.1545979. eCollection 2025. Front Cell Infect Microbiol. 2025. PMID: 40313459 Free PMC article.
-
The ratio of bone marrow myeloid progenitor cell proportion to mature lymphocytes proportion can effectively differentiate aplastic anemia and hypoplastic myelodysplastic syndrome and evaluate the quality of bone marrow aspirates.Int J Lab Hematol. 2024 Dec;46(6):1077-1083. doi: 10.1111/ijlh.14346. Epub 2024 Jul 17. Int J Lab Hematol. 2024. PMID: 39019548
-
Construction of a random survival forest model based on a machine learning algorithm to predict early recurrence after hepatectomy for adult hepatocellular carcinoma.BMC Cancer. 2024 Dec 25;24(1):1575. doi: 10.1186/s12885-024-13366-4. BMC Cancer. 2024. PMID: 39722042 Free PMC article.
Cited by
-
Reference intervals for leukocyte cell population data in healthy adults in Zigong region, China.Sci Rep. 2025 Aug 14;15(1):29786. doi: 10.1038/s41598-025-15766-3. Sci Rep. 2025. PMID: 40813457 Free PMC article.
References
-
- Cazzola M. Myelodysplastic Syndromes. N Engl J Med. 2020;383(14):1358–74. - PubMed
-
- Kim SY, Park Y, Kim H, et al. Discriminating myelodysplastic syndrome and other myeloid malignancies from non-clonal disorders by multiparametric analysis of automated cell data. Clin Chim Acta. 2018;480:56–64. - PubMed
MeSH terms
Grants and funding
LinkOut - more resources
Full Text Sources
Medical
Research Materials
Miscellaneous
