. 2024 Dec 18;22(1):288.
doi: 10.1186/s12915-024-02083-w.

Pheromone relay networks in the honeybee: messenger workers distribute the queen's fertility signal throughout the hive

Affiliations

Pheromone relay networks in the honeybee: messenger workers distribute the queen's fertility signal throughout the hive

Thomas O Richardson et al. BMC Biol. .

Abstract

Background: The harmonious operation of many insect societies depends upon colony-wide dissemination of a non-volatile pheromone produced by a single queen, which informs workers of her presence. This represents a major challenge in large colonies. Honeybee colonies, which can exceed 60,000 bees, are believed to solve this challenge using 'messenger' workers that actively relay the queen pheromone throughout the hive. However, little is known about the structure and effectiveness of the underlying relay network or the biology of messaging.

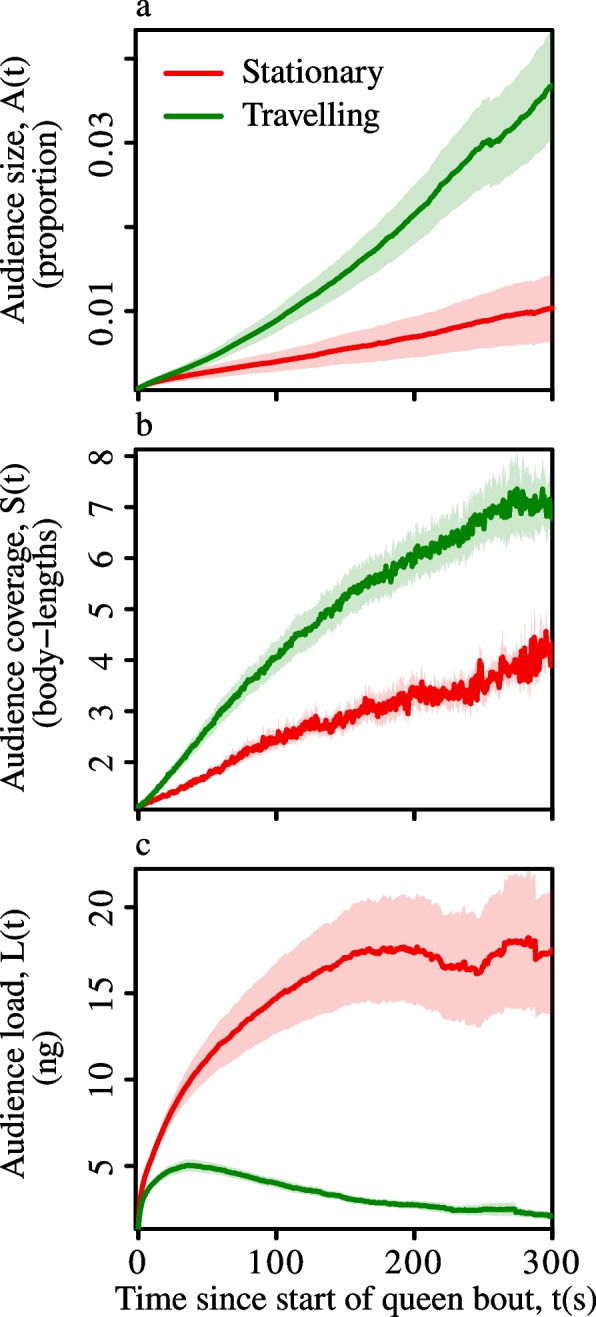
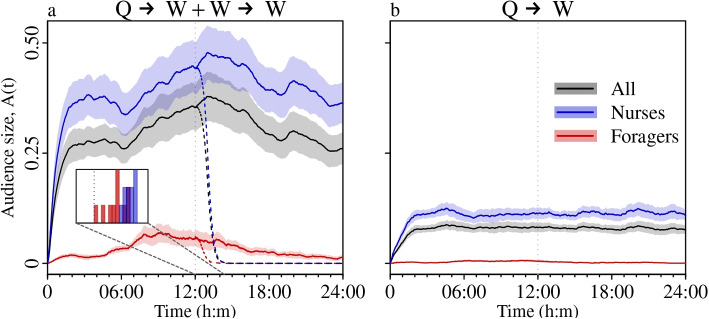
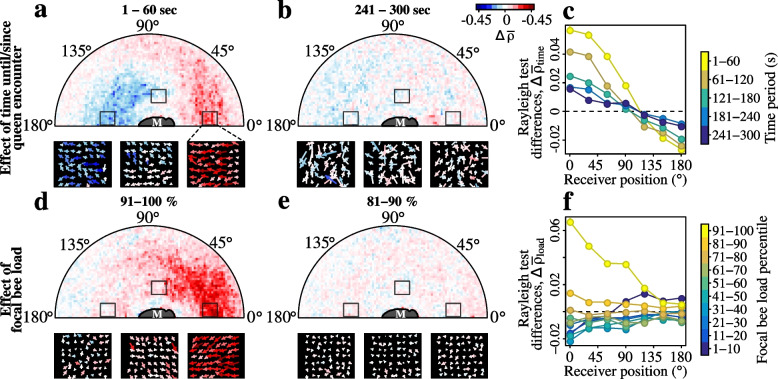
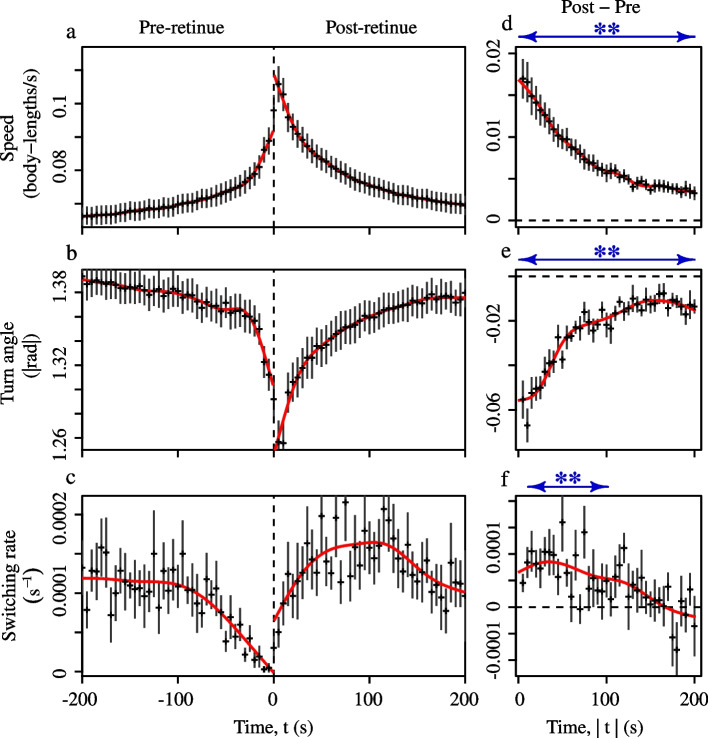
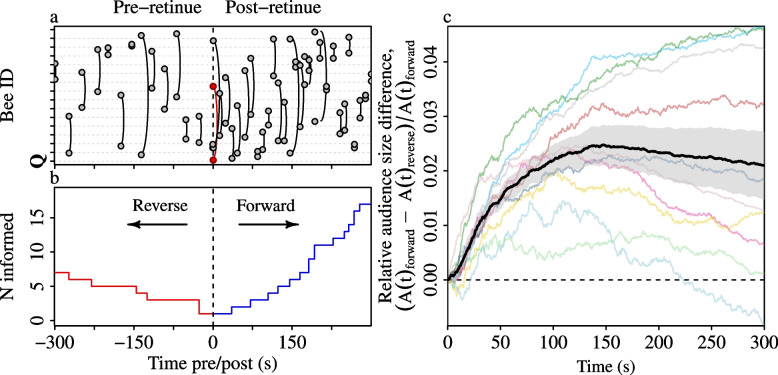
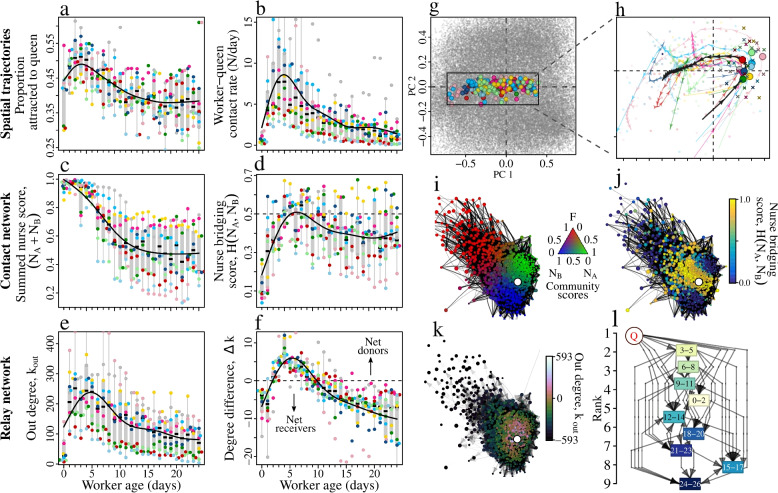
Results: Here, we combine automated tracking with modelling to address these outstanding questions. We find that both queen movement and worker messaging play fundamental roles in queen pheromone dissemination. Fine-grained analyses of worker behaviour confirmed the existence of active messaging, as physical contacts with the queen caused workers to move faster and straighter, thereby accelerating pheromone transmission. Finally, we show that messaging follows a stereotypical developmental trajectory, resulting in an age-dependent hierarchical relay network, with the most intense messaging observed between three and five days of age, when workers undergo a suite of physiological changes associated with queen rearing.

Conclusions: These results suggest that the individuals that contribute most to advertising the presence of the queen are also the ones that control queen production.

Keywords: Animal communication; Automatic tracking; Contact network; Contagion; Fertility signalling; Queen pheromone; Social insect; Transmission.


Conflict of interest statement

Declarations. Ethics approval and consent to participate: Not applicable. Consent for publication: Not applicable. Competing interests: The authors declare that they have no competing interests.

Figures

Fig. 1
Fig. 1
Quantifying the influence of queen behavioural state on pheromone transmission. a An example 24-hour queen trajectory on one side of the hive; travelling segments are shown in green and stationary segments in red. The black polygon indicates the boundary of the broodnest and the corner marked with a red arc represents the nest entrance. The blow-up shows the queen’s movement during an example 10-minute travelling bout (focal bout). Crosses indicate encounters with workers. b Behavioural state sequence of the queen during the same 24 hours, inferred by applying a HMM to the queen’s trajectory. The black line highlights the focal bout. c Queen movement speed during the focal bout (units are square-root-transformed body-lengths/sec). d Transmission sequence during the first minute of the focal bout. Each line on the y-axis represents a different bee, with the queen at y=0, and with the workers positioned according to the transmission order. Red and grey arrows respectively depict queen-to-worker and worker-to-worker pheromone transfers. e Individual-level load dynamics for the entire bout. f Snapshots of the spatial coverage of the informed workers on both sides of the hive. Points show locations of informed workers, lines show pairwise distances
Fig. 2
Fig. 2
Short-term dynamics of queen pheromone transmission. Panels show the growth in a audience size (proportion of the colony that are informed), b average spatial separation between informed workers, and c average pheromone load of informed workers, for stationary versus travelling queen bouts. Lines & shaded areas show the cross-colony grand mean & standard error. Each colony contributes a single value to the grand mean (n=10)
Fig. 3
Fig. 3
Indirect transmission enhances queen pheromone spreading, and nurses are more exposed than foragers. Growth curves show the proportion of informed bees as a function of time for daily contact sequences including both direct and indirect transmission (a, QW+WW), or in the absence of indirect transmission (b, direct transmission only, QW). Lines and shaded areas show the cross-colony grand means and standard errors, respectively. Each colony contributes a single value to the mean (n=10). Dashed coloured lines indicate the decay in the proportion of informed workers after the simulated removal of the queen at 12:00. The histograms in panel (a) show the post queen removal half-life distributions for informed nurses (blue) and foragers (red)
Fig. 4
Fig. 4
Workers orient towards nestmates that recently encountered the queen, or that have high queen pheromone loads. a-b Difference maps showing the change in the orientation strength of workers around a messenger bee (M). Worker orientation strengths are quantified using the Rayleigh test statistic, ρ. Panels a & b show respectively the post-pre differences in receiver orientation strengths for the first and fifth minutes either side of the queen contact (i.e., Δρ¯time=ρ¯1:60-ρ¯-1:-60 & ρ¯241:300-ρ¯-241:-300). Arrow plots show post-pre difference vectors, Δv, for areas to the front, the side, and behind the messenger. c Angular transect of the post-pre orientation strength differences as a function of the position of the receiver worker. Positions are measured clockwise relative to the heading of the messenger. Dots and error bars represent means & standard errors. d-e Difference maps comparing worker orientation strength toward a post-retinue messenger (M) with a given queen pheromone load, versus all post-retinue bees irrespective of their pheromone load (i.e., Δρ¯load). Panels d & e show respectively the difference maps for messengers with a load in the top, and the second deciles (i.e., ρ91:100-ρ1:100 & ρ81:90-ρ81:90). f Angular transect of the differences in receiver orientation strengths as a function of the position of the receiver
Fig. 5
Fig. 5
Physical contact with the queen induces worker excitation. a-c Worker movement before a physical encounter with the queen (‘Pre retinue’, negative times), and after it (‘Post retinue’, positive times). d-f Differences between the movement of pre- versus post-retinue workers. Differences were calculated by subtracting the observation at a given time before the queen contact, T=-t, from the observation at the same time after the contact, T=+t. Black crosses indicate cross-colony grand means & standard errors. Each colony contributes one value to the grand mean (n=10). Solid red lines indicate fits from the GAMMs described in the text. Blue arrows in d-f indicate times when the pre- and post-retinue GAMM fits were significantly different (at p<0.01)
Fig. 6
Fig. 6
Comparison of forwards versus reverse-time transmission. a Example contact sequence covering a five minute pre- and post-retinue period. Individual bees occupy fixed positions on the y-axis, and physical encounters between pairs of bees are indicated by curved links. The queen is indicated in red. b Growth curves obtained from running the transmission simulation on the five-minute post-retinue contacts (‘forward’), and on the time-reversed five minute pre-retinue contacts (‘reverse’). c Relative differences between the audience size growth curves for the original post-retinue contact sequence versus the time-reversed pre-retinue contacts. Coloured lines indicate individual colony means. The black line and the shaded area indicates the grand mean & standard error, towards which each colony contribute a single value (n=10)
Fig. 7
Fig. 7
Expression of the messaging ‘syndrome’ follows a stereotypical developmental trajectory. a-b Active attraction of workers to the queen and contact rates between the queen and workers as a function of worker age. Points represent colony means, and point colours indicate colony identity. Solid lines indicate general additive models, fitted to the colony means. c-d Community affiliations in the daily contact networks as a function of age. e-f Spreading roles in the daily relay network according to age. Out-degree kout represents the number of nestmates an individual donates queen pheromone to, and degree difference Δk represents the out-degree minus the in-degree (number of nestmates an individual receives queen pheromone from). g-h Dimension reduction reveals that workers follow stereotypical developmental trajectories as they age. g Principal component analysis of the six behaviours shown in panels a-f. Background points represent a given individual on a given day. Foreground points show the mean for a given age cohort on a given day. Point colours represent colony identities. h Blowup of the rectangular area in g. Coloured arrows show developmental trajectories for each colony. The black arrow shows the ‘global’ trajectory. Coloured points show the inflection point for each colony. Points marked with an ‘x’ indicate the 3–5 day-old workers, which contribute most to feeding the queen and raising new queens. i-k The daily contact network (i-j) and the daily pheromone relay network (k) for colony 18 on 29/8/2016. All networks used the same layout, obtained by applying a force-directed layout algorithm to the contact network. Nodes represent individual bees, and the queen is indicated by the white node. Node size indicates age. In (i-j), edge thickness represents the number of pairwise encounters. In (k) edge weight & direction indicates pheromone flow. In (i), the nodes are coloured according to the community scores. The network is partitioned into three overlapping communities; a foraging community consisting mainly of older workers (red nodes), and two nurse communities consisting mainly of younger workers (blue and green nodes). In (j) nodes are coloured according to the nurse bridging score, H(NA,NB). Bees positioned at the overlap of the two nurse communities have high bridging scores. In (k) nodes are coloured according to the out degree. l The coarse-grained flow network. Node labels indicate the age in days. Weighted and directed edges indicate the net pheromone flow between cohorts. The donation hierarchy is indicated by the vertical positions of each node, as defined by the dominance ranks

References

    1. Queller DC, Strassmann JE. Kin selection and social insects. Bioscience. 1998;48(3):165–75.
    1. Keller L, Nonacs P. The role of queen pheromones in social insects: queen control or queen signal? Anim Behav. 1993;45(4):787–94.
    1. Nakata K, Tsuji K. The effect of colony size on conflict over male-production between gamergate and dominant workers in the Ponerine ant Diacamma sp. Ethol Ecol Evol. 1996;8(2):147–56.
    1. Shimoji H, Abe MS, Tsuji K, Masuda N. Global network structure of dominance hierarchy of ant workers. J R Soc Interface. 2014;11(99):20140599. - PMC - PubMed
    1. Butler CG. The method and importance of the recognition by a colony of honeybees (A. mellifera) of the presence of its queen. Trans R Entomol Soc Lond. 1954;105(2):11–29.

LinkOut - more resources