. 2024 Dec 18;21(1):326.
doi: 10.1186/s12974-024-03320-3.

Alterations of the IKZF1-IKZF2 tandem in immune cells of schizophrenia patients regulate associated phenotypes

Affiliations

Alterations of the IKZF1-IKZF2 tandem in immune cells of schizophrenia patients regulate associated phenotypes

Iván Ballasch et al. J Neuroinflammation. .

Abstract

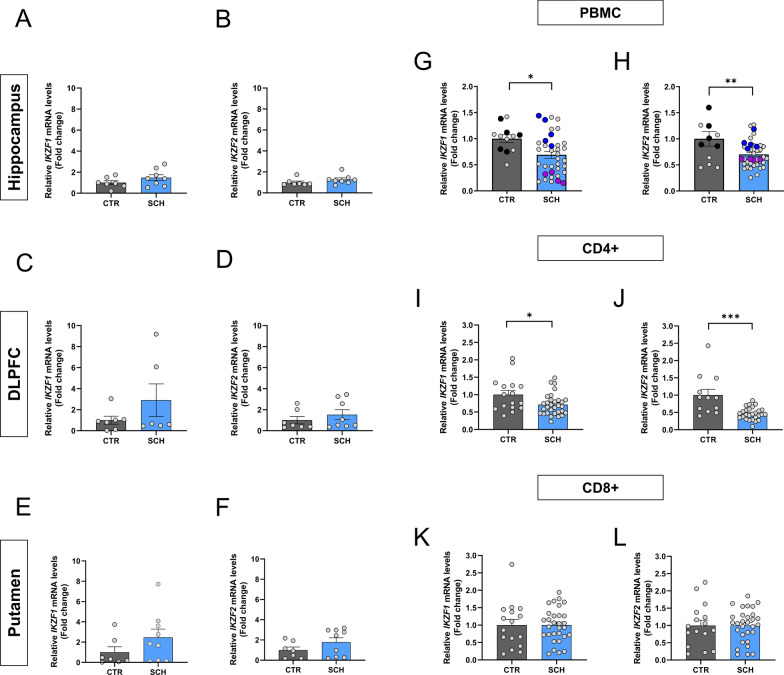
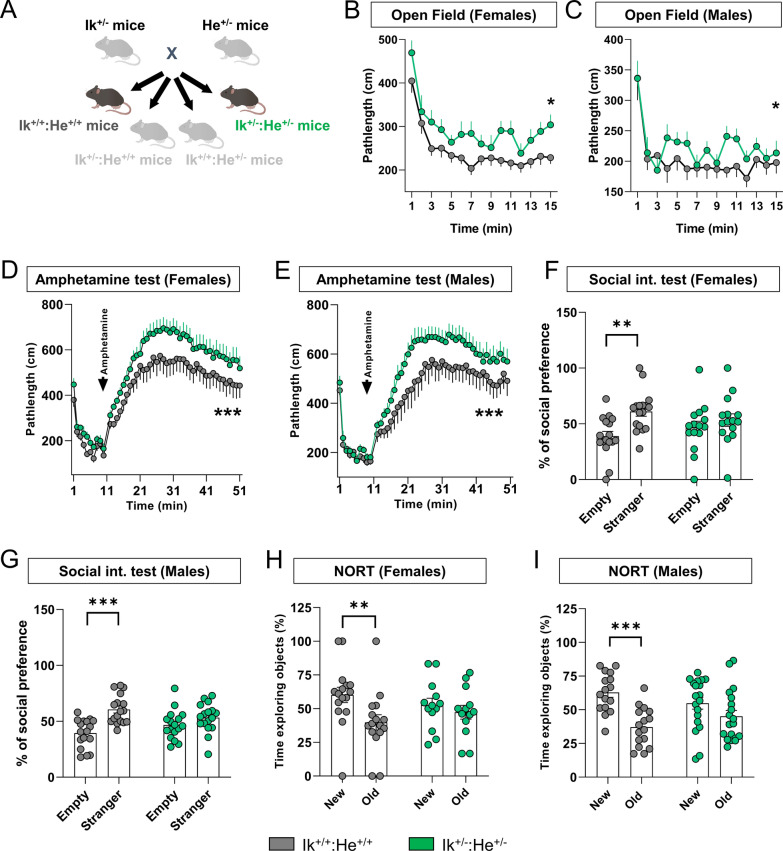
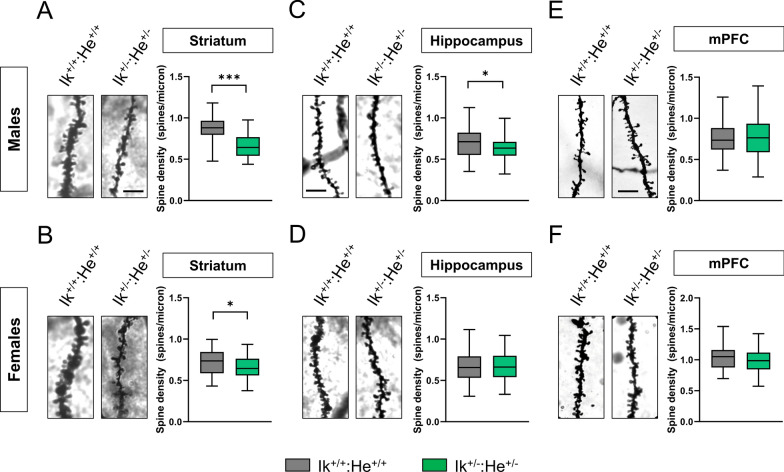
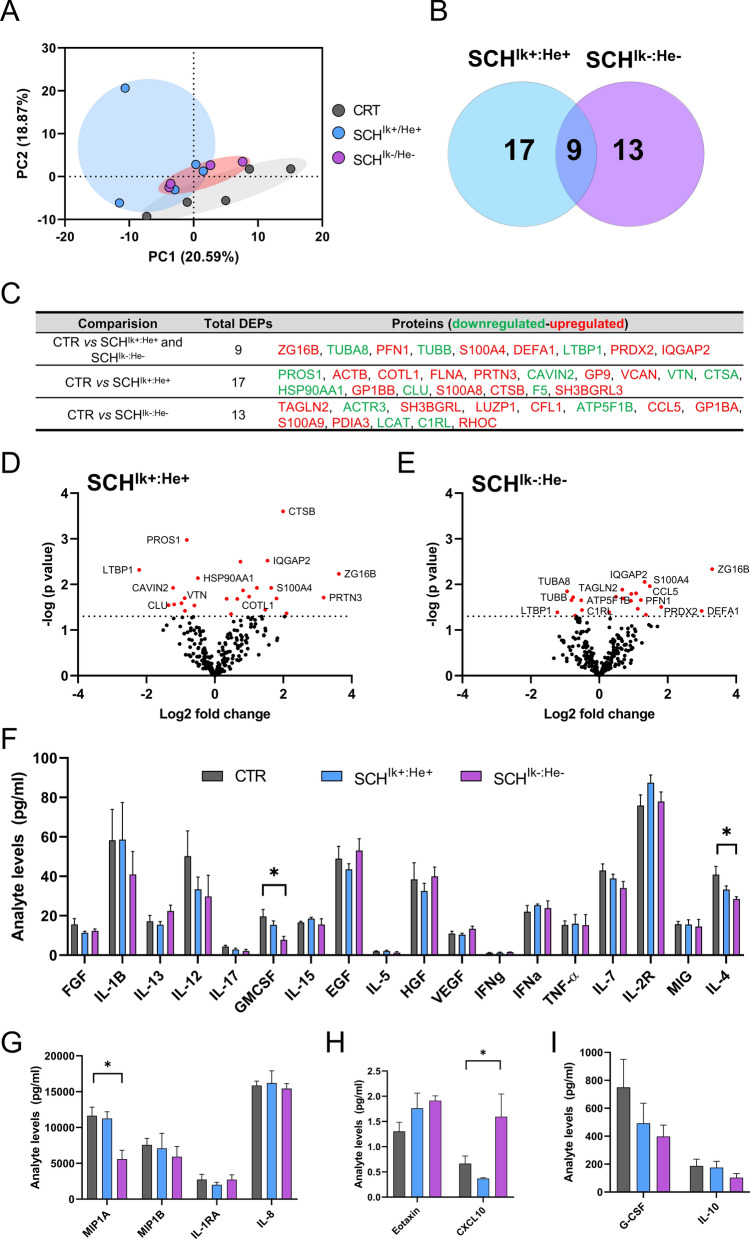
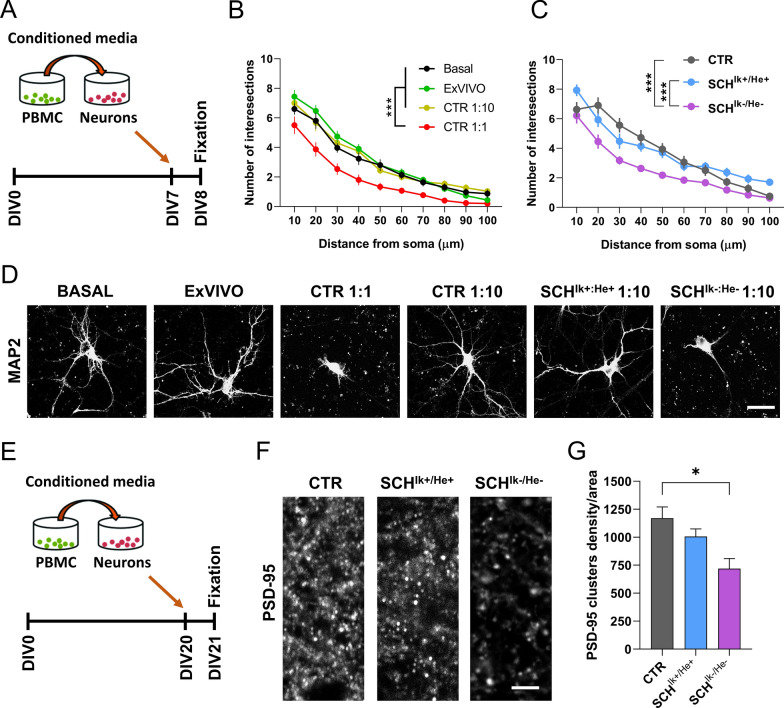
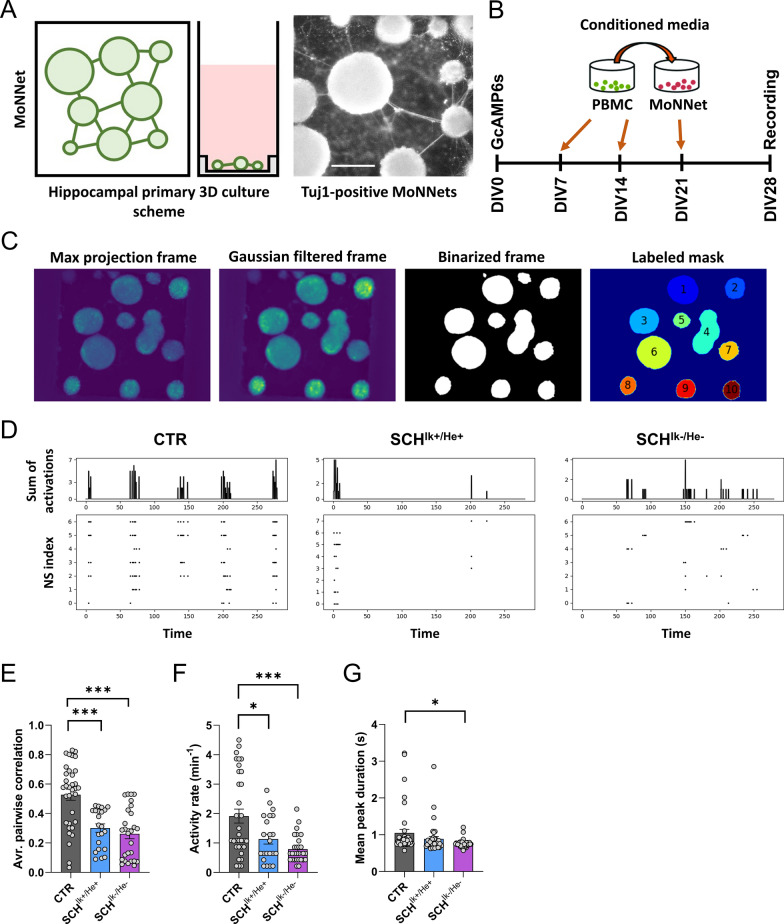
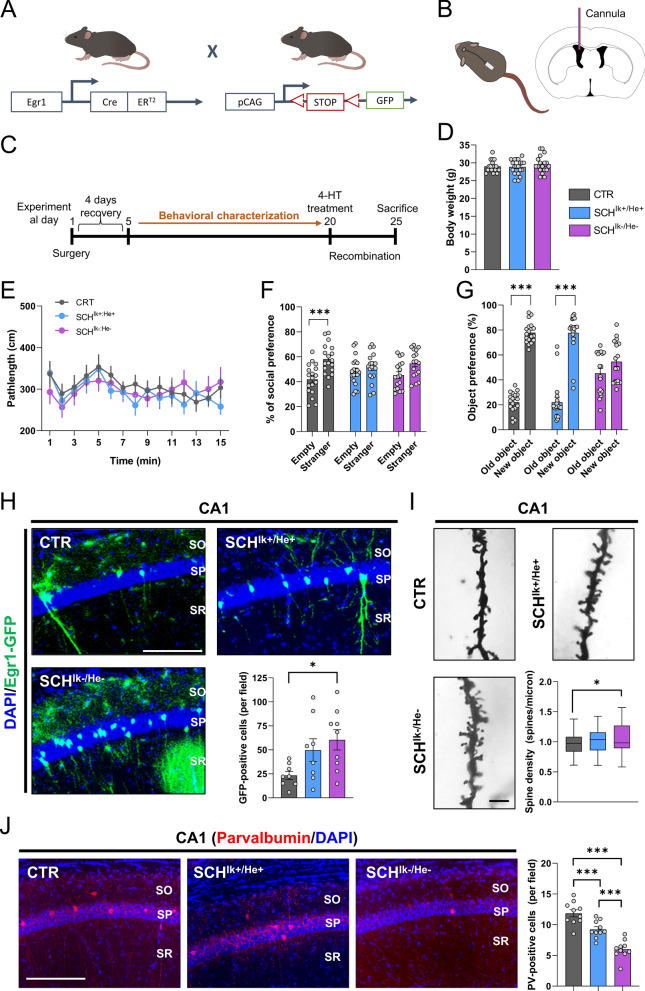
Schizophrenia is a complex multifactorial disorder and increasing evidence suggests the involvement of immune dysregulations in its pathogenesis. We observed that IKZF1 and IKZF2, classic immune-related transcription factors (TFs), were both downregulated in patients' peripheral blood mononuclear cells (PBMCs) but not in their brain. We generated a new mutant mouse model with a reduction in Ikzf1 and Ikzf2 to study the impact of those changes. Such mice developed deficits in the three dimensions (positive-negative-cognitive) of schizophrenia-like phenotypes associated with alterations in structural synaptic plasticity. We then studied the secretomes of cultured PBMCs obtained from patients and identified potentially secreted molecules, which depended on IKZF1 and IKZF2 mRNA levels, and that in turn have an impact on neural synchrony, structural synaptic plasticity and schizophrenia-like symptoms in in vivo and in vitro models. Our results point out that IKZF1-IKZF2-dependent immune signals negatively impact on essential neural circuits involved in schizophrenia.

Keywords: CCL5; CXCL10; Cognitive symptoms; Helios; IL-4; Ikaros; Lymphocytes; Mouse models; Negative symptoms; Neuronal networks.


Conflict of interest statement

Declarations. Ethics approval and consent to participate: All the procedures for the obtention of post-mortem samples followed the ethical guidelines of the Declaration of Helsinki and local ethical committees (Universitat de Barcelona: IRB00003099; Fundació CEIC Sant Joan de Déu: BTN-PSSJD). The blood samples of this study (N◦PI17/00246, PI Belen Arranz) was recruited in the Outpatient clinic located in Cornellà, Barcelona, Spain (Parc Sanitari Sant Joan de Deu). All animal procedures were approved by local committees [Universitat de Barcelona, CEEA (136/19); Generalitat de Catalunya (DAAM 10786) following the European Communities Council Directive (86/609/EU). Competing interests: The authors declare no competing interests.

Figures

Fig. 1
Fig. 1
IKZF1 and IKZF2 mRNA levels in the brain and circulating immune cells of patients with schizophrenia. Determination of IKZF1 and IKZF2 mRNA levels in different brain regions. Results from RT-qPCR of total IKZF1 and IKZF2 mRNA levels in different brain regions namely hippocampus (a and b respectively), dorso-lateral prefrontal cortex (DLPFC, c and d respectively) and putamen (e and f respectively) from patients with schizophrenia (SCH) or matched controls (CTR). Demographics of the samples are displayed in supplementary Table 1. Results from RT-qPCR of total (g) IKZF1 and (h) IKZF2 mRNA levels in peripheral blood mononuclear cells (PBMCs) isolated from patients with schizophrenia (SCH) or matched controls (CTR). Highlighted black, blue and violet dots are the samples selected for the subgroups used in Fig. 4 onwards (CTR, SCHIk+:He+ and SCHIk−:He− groups respectively). (i) Results from RT-qPCR of total IKZF1 and (j) IKZF2 mRNA levels in CD4 + cells isolated from PBMCs in i-j. Results from RT-qPCR of total (k) IKZF1 and (l) IKZF2 mRNA levels in CD8 + cells isolated from PBMCs in i-j. Demographics of the samples are displayed in supplementary Table 2. Data are means ± SEM and they were analyzed using the two-tailed Student t-test. *p < 0.05, **p < 0.01 and ***p < 0.001 vs CTR
Fig. 2
Fig. 2
Generation and characterization of the Ik±:He± double mutant mice. a Schematic representation of the adult mutant mice generated and used. Ik± and He± mice were crossed to generate the four genotypes; Ik+/+:He+/+, Ik+/+:He±, Ik±:He+/+ and Ik±:He±. Since the behavioral phenotype in Ik+/+:He± and Ik±:He+/+ groups of mice were punctual compared to that in Ik+/+:He+/+ mice (Suppl. Figure 3), we focused on the controls Ik+/+:He+/+ and the double mutant Ik±:He± mice. Basal locomotor activity was evaluated in the two groups of mice separated into (b) females (Genotype effect: F(1, 495) = 22,58, p < 0.0001) and (c) males (Genotype effect: F(1, 538) = 9,518, p = 0.0021) in a 15 min testing session of free exploration in an open field. Induced agitation and sensitivity to the psychostimulant D-amphetamine was measured in a 45 min testing session upon injection of 5 mg/Kg of D-amphetamine in (d) female (Genotype effect: F(49, 1450) = 20,37, p < 0.0001) and (e) male (Genotype effect: F(48, 1666) = 21,28, p < 0.0001) mice from both groups. Sociability was evaluated in the three-chamber social interaction test (TCSIT). Mice from the two groups were subjected to the TCSIT and data were depicted for (f) females (Social preference effect: F(1, 60) = 8,456, p = 0.0051) and (g) males (Social preference effect: F(1, 64) = 19,36, p < 0.0001). Recognition memory was evaluated in the novel object recognition test (NORT) 24 h after a training session. Mice from two groups were subjected to the NORT and data were depicted for (h) females (NORT preference effect: F(1, 54) = 5,415, p = 0.0237) and (i) males (NORT preference effect: F(1, 66) = 18,35, p < 0.0001). Data are means ± SEM and they were analyzed using the two-way ANOVA. *p < 0.05, ***p < 0.001 vs Ik+/+:He+/+ mice in b, d and e. In f, g, h, and i data were analyzed using the two-way ANOVA with Bonferroni’s post hoc test; **p < 0.01 and ***p < 0.001 vs time exploring the stranger or the new object
Fig. 3
Fig. 3
Characterization of structural synaptic plasticity in the Ik±:He± mice. a, b Representative images (left panels) and quantification (right panels) of spine density in dendrites from medium spiny neurons (MSNs) of the dorsal striatum labeled with Golgi staining. Images were obtained in a bright-field microscope in adult (a) male and (b) female Ik+/+:He+/+ and Ik±:He± mice. Scale bar, 5 μm. c, d Representative images (left panels) and quantification (right panels) of spine density in secondary apical dendrites from pyramidal neurons of the hippocampal CA1 labeled with Golgi staining. Images were obtained in adult (c) male and (d) female Ik+/+:He+/+ and Ik±:He± mice. Scale bar, 5 μm. e, f Representative images (left panels) and quantification (right panels) of spine density in dendrites from pyramidal neurons of layer V in the frontal cortex labeled with Golgi staining. Images were obtained in adult (e) male and (f) female Ik+/+:He+/+ and Ik±:He± mice. Scale bar, 5 μm. Data are means ± SEM and they were analyzed using the two-tailed Student t-test. *p < 0.05, ***p < 0.01 vs Ik+/+:He+/+ mice. In a, n = 50–54 dendrites/genotype (from 7 mice/genotype). In b, n = 54–66 dendrites/genotype (from 7 mice/genotype). In c, n = 62–65 dendrites/genotype (from 7 mice/genotype). In d, n = 60–68 dendrites/genotype (from 7 mice/genotype). In e, n = 89–55 dendrites/genotype (from 7 mice/genotype). In f, n = 43–47 dendrites/genotype (from 7 mice/genotype). Scale bar in a, 5 µm
Fig. 4
Fig. 4
Molecular profile of PBMC secretomes from stratified patients with schizophrenia. From our results in Fig. 1g, h, we selected and stratified patients as follows: Patients with schizophrenia but with unaltered mRNA levels in PBMC of both, IKZF1 and IKZF2 respect to CTR subjects (SCHIk+:He+ group; n = 5) and patients with a double reduction (≥ 40%) of IKZF1 and IKZF2 mRNA levels in PBMCs (SCHIk−:He− group; n = 4). These stratified patients were matched to control subjects with normal IKZF1 and IKZF2 mRNA levels (CTR group; n = 5). From these stratified patients, supernatants of cultured PBMC were collected and subjected to Mass Spectrometry. a Principal component analysis (PCA) for proteomics data from PBMC supernatants. The PCA plot represents the 14 subjects from the three subgroups (CTR in grey, SCHIk+:He+ in blue, and SCHIk−:He− in violet) that indicates subtle proteomics profile differences between such supernatants. b Venn diagram showing the total number of proteins differentially expressed or DEPs in each of the SCH subgroups. The common DEPs (9) comparing both groups (SCHIk+:He+ and SCHIk−:He−) with respect to the CTR group, the specific DEPs (17, blue) comparing SCHIk+:He+ with CTR, and the specific DEPs (13, violet) comparing SCHIk−:He− with CTR are depicted. c Table showing the specific down-regulated (green) and up-regulated (red) DEPs in each comparison extracted from b. d Volcano plot depicting DEPs when comparing supernatants from the CTR and SCHIk+:He+ groups. Dashed horizontal line shows the p values cutoff, and the two vertical dashed lines indicate down/up regulated proteins. Red points indicate significantly DEPs. Dark points indicate non-significant DEPs. e Volcano plot depicting DEPs when comparing supernatants from the CTR and SCHIk−:He− groups as we did for d. Analyte array measured by a Luminex assay depicting the levels in pg/ml of (f) FGF, IL-1B, IL-13, IL-12, IL-17, GMCSF, IL-15, HGF, VEGF, IFNg, IFNa, TNFa, IL-17, IL-2R, MIG, IL-4 and (g) MIP1A, MIP1B, IL-1RA, IL-8 and (h) Eotaxin, CXCL10 and (i) G-CSF and IL-10. The analytes are depicted in four (fi) different graphs due to their huge variability in terms of the range of concentrations. Data are means ± SEM and they were analyzed using the one-way ANOVA and the Dunnet’s post hoc in fi. *p < 0.05 vs CTR group
Fig. 5
Fig. 5
Effects of CTR, SCHIk+:He+ and SCHIk−:He− supernatants in neuronal structural plasticity. a The experimental design is depicted. Supernatants (a.k.a. conditioned media) from cultured PBMC were added to primary hippocampal neurons at DIV7 and 24 h later, their dendritic morphology was assessed by using the Sholl analysis. b and d Different concentrations (1:1 and 1:10 supernatants from the CTR pool) and controls (X-Vivo media and naïve primary neurons) were employed (Group effect: F(3, 1166) = 147,1, p < 0.0001). The 1:10 concentration was selected as the one to be used from c onwards because of its safety when compared with Basal and X-Vivo control conditions (b and d). c and d Effects of CTR, SCHIk+:He+ and SCHIk−:He− supernatants on neuronal branching in primary hippocampal neurons using the selected (1:10) dose (Group effect: F(2, 890) = 40,97, p < 0.0001). In b-d MAP2 staining was employed. e The experimental design to evaluate synaptic changes is depicted. Supernatants (conditioned media) from cultured PBMC were added to primary hippocampal neurons at DIV20 and 24 h later (f) the density of PSD-95 positive puncta per area was assessed in the three groups. g Quantification of PSD-95-positive puncta/area from f (F(2, 9) = 6,905, p = 0.0152). Data are mean ± SEM. In b (n = 30 neurons/group) and c (n = 27–33 neurons/group) the two-way ANOVA was applied and Tukey’s multiple comparisons test was used as a post hoc. In g (n = 4 cultures/group) one-way ANOVA was applied, and Dunnett’s multiple comparisons test was used as a post hoc. Scale bar in d, 30 µm. Scale bar in f, 5 µm
Fig. 6
Fig. 6
Impact of CTR, SCHIk+:He+, and SCHIk−:He− supernatants in neuronal activity and synchrony. a Schematic overview of MoNNet approach (Left panel). Primary hippocampal cells were infected with AAV7m8.Syn.GCaMP6s.WPRE.SV40, and plated on a PDMS mold for self-organized assembly of MoNNet (a.k.a. neurospheres, Middle panel). Tuj-1 labeled MoNNets (right panel). Scale bar 250 µm. b The experimental design is depicted. Pooled supernatants (a.k.a. conditioned media) from each group (CTR, SCHIk+:He+, and SCHIk−:He−) of cultured PBMC were added to primary hippocampal neurons at DIV7, DIV14, and DIV21. At DIV28, their GcAMP6s-based activity was assessed. c Maxima projection showing GcAMP6s activity and its subsequent filtering (Gaussian > binarized > and final mask). System-wide cellular-resolution Ca2+ imaging was performed at 25 Hz. We analyzed the activity of each neurosphere and compared it with the rest of neurospheres. d Representative raster plots from DIV28 recordings in all three groups (CTR, SCHIk+:He+, and SCHIk−:He−). From the binarized signal the following parameters were computed: e average pairwise Pearson correlation of MoNNets (one-way ANOVA; F(2, 80) = 18,31, p < 0.0001), (f) mean activity rate (one-way ANOVA: F(2, 81) = 10,22, p < 0.0001) and (g) mean peak duration (one-way ANOVA: F(2, 108) = 3,893, p = 0.023). In eg one-way ANOVA was applied and the Dunnett's multiple comparisons test was used as a post hoc. *p < 0.05 and ***p < 0.001 vs CTR
Fig. 7
Fig. 7
Schizophrenia-like phenotypes induced by the SCHIk+:He+ and SCHIk−:He− supernatants when intraventricularly administered in mice. a Schematic representation of adult double-heterozygous-mutant Egr1-CreERT2 × R26RCE GFP mice used to label activated neural engrams upon treatment with supernatants. b Schematic representation of the intraventricular infusion of CTR, SCHIk+:He+, and SCHIk−:He− supernatants. Mini-osmotic pumps infused 0,11 µl/h of supernatants at a concentration of 0,206 µg/µl of protein. c The experimental design is depicted. After surgical intervention, mice recovered for 4–5 days and then they were subjected to a broad behavioral characterization. At day 19, this behavioral characterization terminated and at day 20 mice were treated with 50 mg/kg of 4-hydroxytamoxifen (4-HT) to induce recombination and labeling (GFP) of activated neural ensembles. At day 25, mice were processed to evaluate neural engrams formation and labeling and to evaluate spine density in the hippocampal CA1. d Body weight was monitored on the day of sacrifice. e Basal locomotion/agitation was evaluated by using the open field in the three groups of mice (CTR, SCHIk+:He+, and SCHIk−:He−). In the same groups of mice, f sociability was measured using the three-chamber social interaction test/TCSIT (Group effect: F(1, 102) = 18,43, p < 0.0001). g The same groups of mice were also subjected to the Novel Object Recognition Test/NORT (Group effect: F(1, 106) = 229,3, p < 0.0001) where memory was tested 24 h after a training session. h Double fluorescent staining (DAPI in blue, GFP in green) in hippocampal CA1 from mice treated with one of each supernatant (CTR, SCHIk+:He+, and SCHIk−:He−). Graph (right-down) shows quantification of Egr1-dependent activated CA1 pyramidal cells (estimated number of GFP-positive cells/area of 500 µm2, Group effect: F(2, 22) = 3,926, p = 0.034). Scale bar, 300 μm. i Representative images and quantification (right-down panel) of spine density in secondary apical dendrites of the CA1 pyramidal neurons labeled with Golgi staining (n = 72–121 dendrites/group from 7 mice/group). Images were obtained in a bright-field microscope in the three groups of mice treated with CTR, SCHIk+:He+, and SCHIk−:He− supernatants (Scale bar, 5 μm). j Double fluorescent staining (left panels, DAPI in blue, parvalbumin in red) in hippocampal CA1 from the same mice as in h. Graph (right) shows quantification of parvalbumin-positive interneurons in the CA1 (estimated number of parvalbumin-positive cells/area of 500 µm2, Group effect: F(2, 27) = 33,86, p < 0.001). Scale bar, 300 μm. Data are means ± SEM. In d, h and I one-way ANOVA was applied, and Tukey's multiple comparisons test was used as a post hoc. In e, f, and g, two-way ANOVA was applied, and Bonferroni's multiple comparisons test was used as a post hoc. *p < 0.05, vs CTR; ***p < 0.001, vs Empty or vs Old Object. CTR (n = 18); SCHIk+:He+ (n = 20); SCHIk−:He− (n = 18). In j n = 10 in all groups

Similar articles

References

    1. Aguilar R, Campo JJ, Chicuecue S, Cisteró P, Català A, Luis L, Ubillos I, Galatas B, Aide P, Guinovart C, Moncunill G, Dobaño C. Changing plasma cytokine, chemokine and growth factor profiles upon differing malaria transmission intensities. Malar J. 2019;18:406. 10.1186/s12936-019-3038-x. - PMC - PubMed
    1. Ahmad SF, Nadeem A, Ansari MA, Bakheet SA, AL-Ayadhi LY, Attia SM. Downregulation in Helios transcription factor signaling is associated with immune dysfunction in blood leukocytes of autistic children. Prog Neuro-Psychopharmacol Biol Psychiatry. 2018;85:98–104. 10.1016/j.pnpbp.2018.04.011. - PubMed
    1. Alberro A, Iparraguirre L, Fernandes A, Otaegui D. Extracellular vesicles in blood: sources, effects, and applications. Int J Mol Sci. 2021;22:8163. 10.3390/ijms22158163. - PMC - PubMed
    1. Alhosaini K, Ansari MA, Nadeem A, Attia SM, Bakheet SA, Al-Ayadhi LY, Mahmood HM, Al-Mazroua HA, Ahmad SF. Dysregulation of Ki-67 expression in T cells of children with autism spectrum disorder. Children. 2021;8:116. 10.3390/children8020116. - PMC - PubMed
    1. Alsiö JM, Tarchini B, Cayouette M, Livesey FJ. Ikaros promotes early-born neuronal fates in the cerebral cortex. Proc Natl Acad Sci. 2013. 10.1073/pnas.1215707110. - PMC - PubMed

LinkOut - more resources