

Developing the new diagnostic model by integrating bioinformatics and machine learning for osteoarthritis
- PMID: 39695788
- PMCID: PMC11658098
- DOI: 10.1186/s13018-024-05340-4
Developing the new diagnostic model by integrating bioinformatics and machine learning for osteoarthritis
Abstract
Background: Osteoarthritis (OA) is a common cause of disability among the elderly, profoundly affecting quality of life. This study aims to leverage bioinformatics and machine learning to develop an artificial neural network (ANN) model for diagnosing OA, providing new avenues for early diagnosis and treatment.
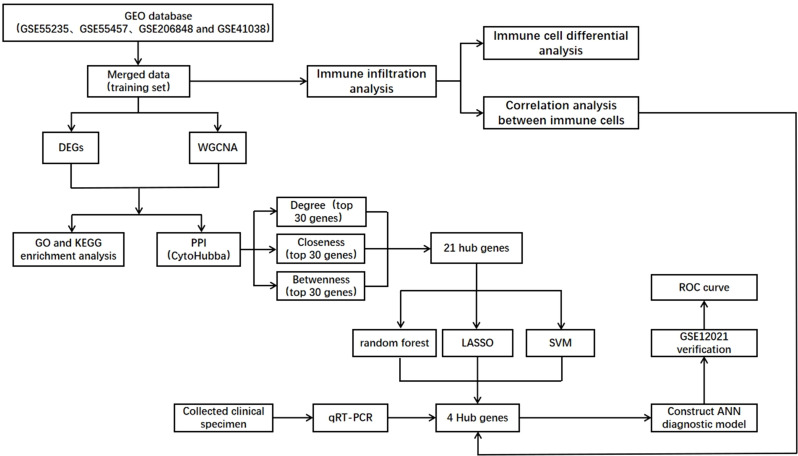
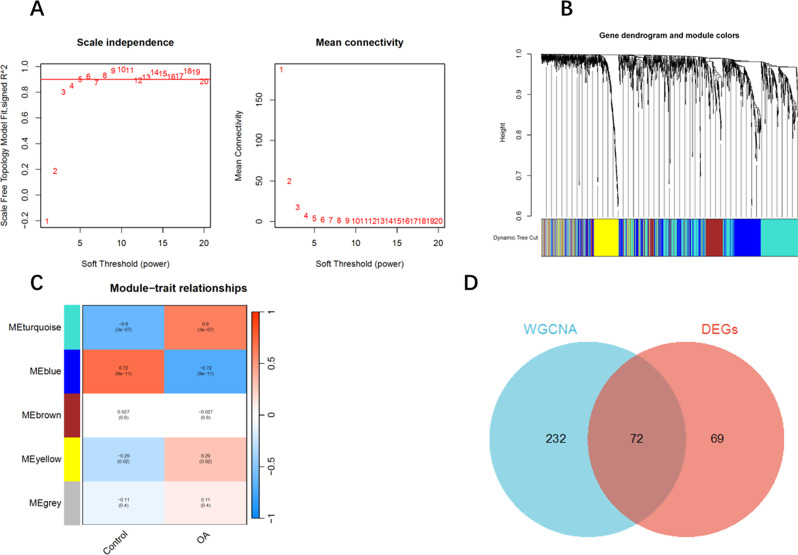
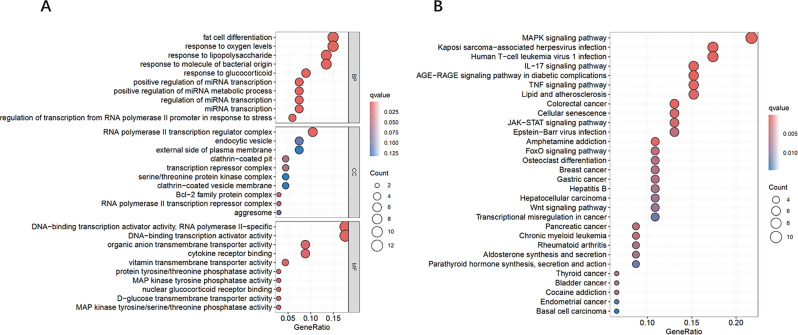
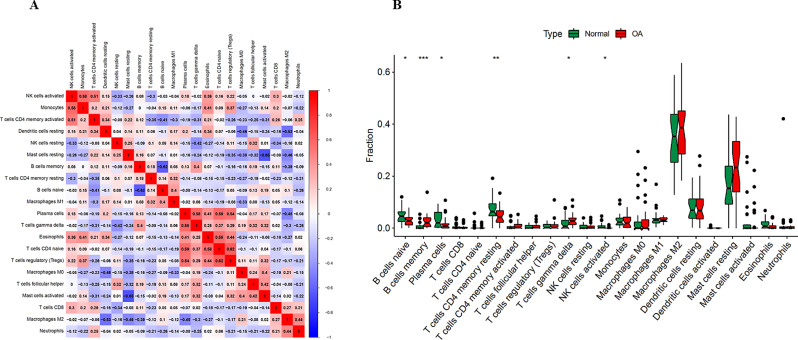
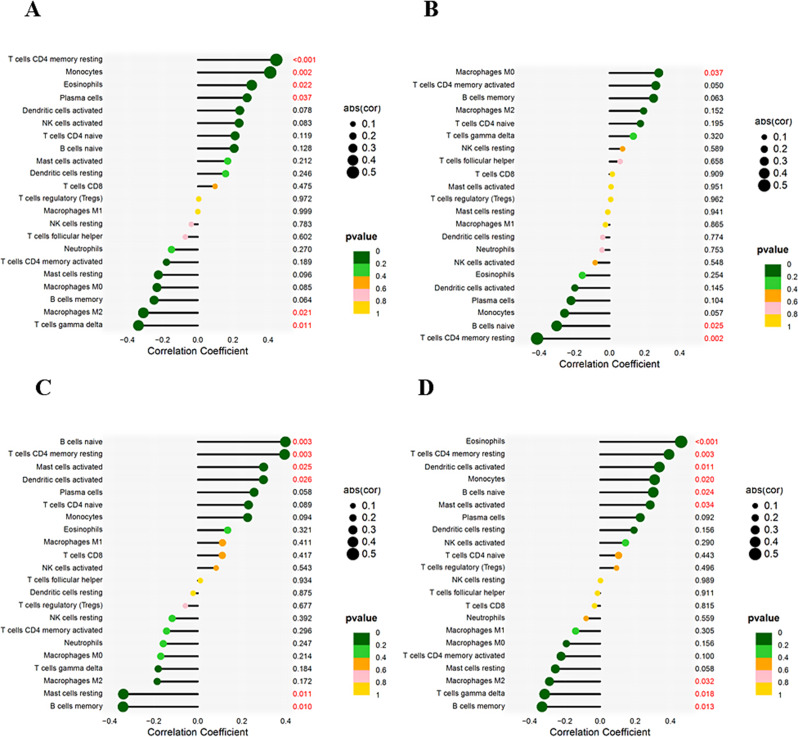
Methods: From the Gene Expression Omnibus (GEO) database, we first obtained OA synovial tissue microarray datasets. Differentially expressed genes (DEGs) associated with OA were identified through utilization of the Limma package and weighted gene co-expression network analysis (WGCNA). Subsequently, protein-protein interaction (PPI) network analysis and machine learning were employed to identify the most relevant potential feature genes of OA, and ANN diagnostic model and receiver operating characteristic (ROC) curve were constructed to evaluate the diagnostic performance of the model. In addition, the expression levels of the feature genes were verified using real-time quantitative polymerase chain reaction (qRT-PCR). Finally, immune cell infiltration analysis was performed using CIBERSORT algorithm to explore the correlation between feature genes and immune cells.
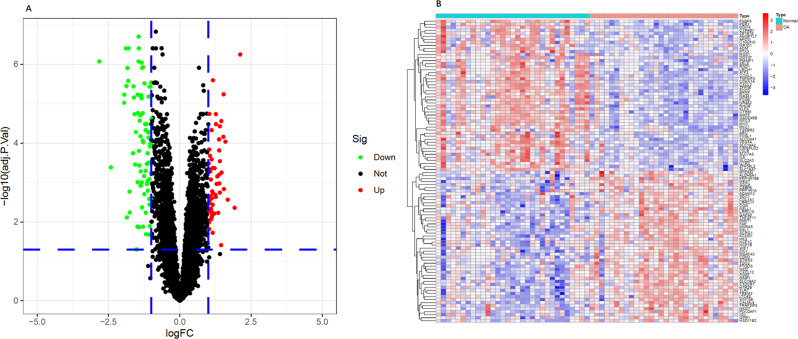
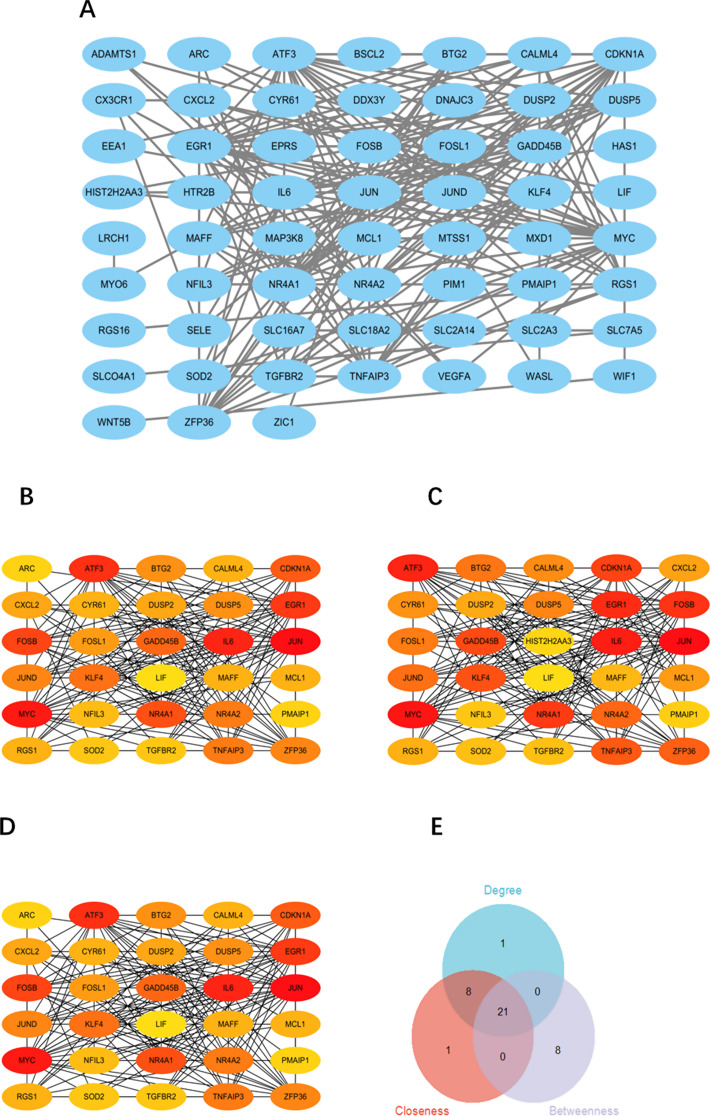
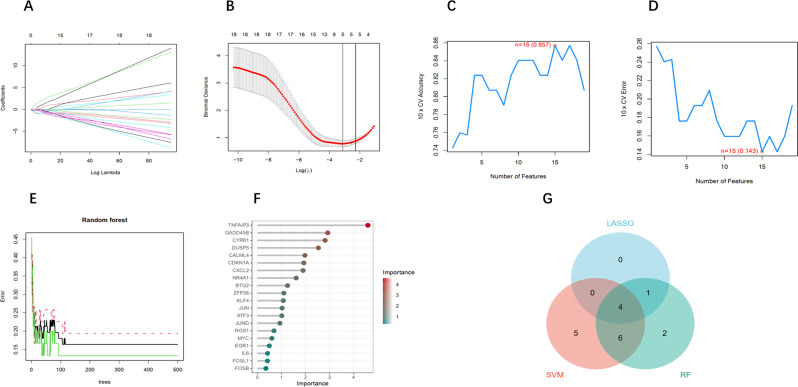
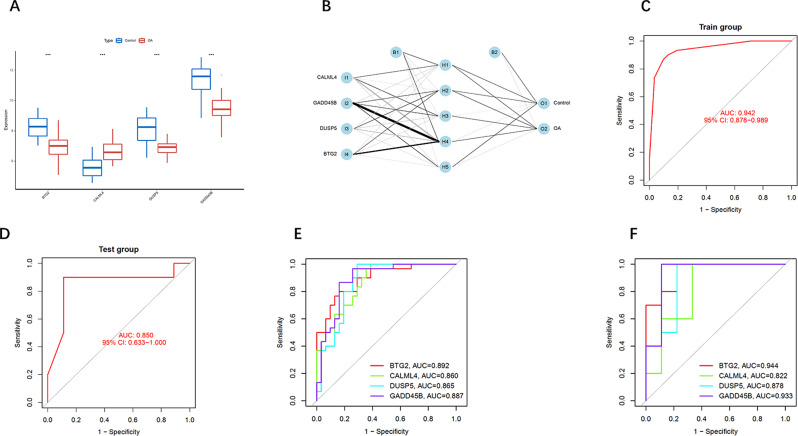
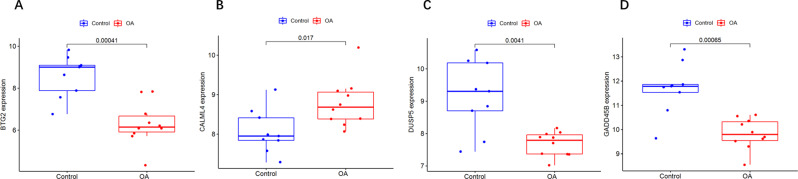
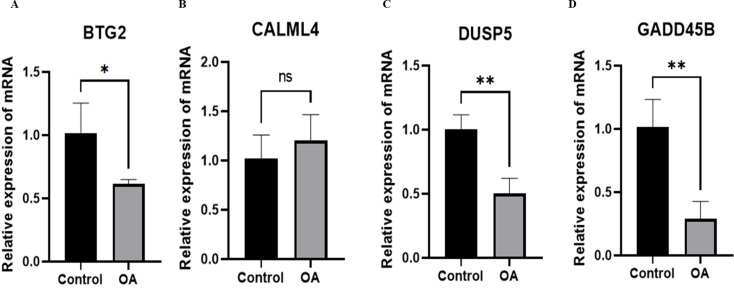
Results: The Limma package and WGCNA identified a total of 72 DEGs related to OA, of which 12 were up-regulated and 60 were down-regulated. Then, the PPI network analysis identified 21 hub genes, and three machine learning algorithms finally screened four feature genes (BTG2, CALML4, DUSP5, and GADD45B). The ANN diagnostic model was constructed based on these four feature genes. The AUC of the training set was 0.942, and the AUC of the validation set was 0.850. In addition, the qRT-PCR validation results demonstrated a significant downregulation of BTG2, DUSP5, and GADD45 mRNA expression levels in OA samples compared to normal samples, while CALML4 mRNA expression level exhibited an upregulation. Immune cell infiltration analysis revealed B cells memory, T cells gamma delta, B cells naive, Plasma cells, T cells CD4 memory resting, and NK cells The abnormal infiltration of activated cells may be related to the progression of OA.
Conclusions: BTG2, CALML4, DUSP5, and GADD45B were identified as potential feature genes for OA, and an ANN diagnostic model with good diagnostic performance was developed, providing a new perspective for the early diagnosis and personalized treatment of OA.
Keywords: Artificial neural networks; Feature genes; Immune cell infiltration; Machine learning; Osteoarthritis.
© 2024. The Author(s).
Conflict of interest statement
Declarations. Competing interests: The authors declare no competing interests.
Figures
Similar articles
-
Identification of four-gene signature to diagnose osteoarthritis through bioinformatics and machine learning methods.Cytokine. 2023 Sep;169:156300. doi: 10.1016/j.cyto.2023.156300. Epub 2023 Jul 14. Cytokine. 2023. PMID: 37454542
-
[Exploration of key ferroptosis-related genes as therapeutic targets for sepsis based on bioinformatics and the depiction of their immune profiles characterization].Zhonghua Wei Zhong Bing Ji Jiu Yi Xue. 2024 Oct;36(10):1025-1032. doi: 10.3760/cma.j.cn121430-20240524-00457. Zhonghua Wei Zhong Bing Ji Jiu Yi Xue. 2024. PMID: 39586719 Chinese.
-
Identification and development of a novel 5-gene diagnostic model based on immune infiltration analysis of osteoarthritis.J Transl Med. 2021 Dec 23;19(1):522. doi: 10.1186/s12967-021-03183-9. J Transl Med. 2021. PMID: 34949204 Free PMC article.
-
Exploration and Identification of Potential Biomarkers and Immune Cell Infiltration Analysis in Synovial Tissue of Rheumatoid Arthritis.Int J Rheum Dis. 2025 Feb;28(2):e70137. doi: 10.1111/1756-185X.70137. Int J Rheum Dis. 2025. PMID: 39953769
-
Advancing ocular gene therapy: a machine learning approach to enhance delivery, uptake and gene expression.Drug Discov Today. 2025 May;30(5):104359. doi: 10.1016/j.drudis.2025.104359. Epub 2025 Apr 12. Drug Discov Today. 2025. PMID: 40228736 Review.
Cited by
-
Osteoimmunology and aging - a frontier to explore.Geroscience. 2025 Jun 25. doi: 10.1007/s11357-025-01744-0. Online ahead of print. Geroscience. 2025. PMID: 40563025
-
Integrated Bioinformatics and Experimental Validation Reveal Macrophage Polarization-Related Biomarkers for Osteoarthritis Diagnosis.J Multidiscip Healthc. 2025 Aug 1;18:4589-4612. doi: 10.2147/JMDH.S537507. eCollection 2025. J Multidiscip Healthc. 2025. PMID: 40765736 Free PMC article.
References
-
- Martel-Pelletier J, et al. Osteoarthr Nat Rev Dis Primers. 2016;2:16072. - PubMed
MeSH terms
Grants and funding
LinkOut - more resources
Full Text Sources
Medical
Research Materials
