. 2024 Dec 18;19(1):102.
doi: 10.1186/s40793-024-00635-9.

Impact of foliar application of phyllosphere yeast strains combined with soil fertilizer application on rice growth and yield

Affiliations

Impact of foliar application of phyllosphere yeast strains combined with soil fertilizer application on rice growth and yield

Gomathy Muthukrishanan et al. Environ Microbiome. .

Abstract

Background: The application of beneficial microbes in agriculture is gaining increasing attention as a means to reduce reliance on chemical fertilizers. This approach can potentially mitigate negative impacts on soil, animal, and human health, as well as decrease climate-changing factors. Among these microbes, yeast has been the least explored, particularly within the phyllosphere compartment. This study addresses this knowledge gap by investigating the potential of phyllosphere yeast to improve rice yield while reducing fertilizer dosage.

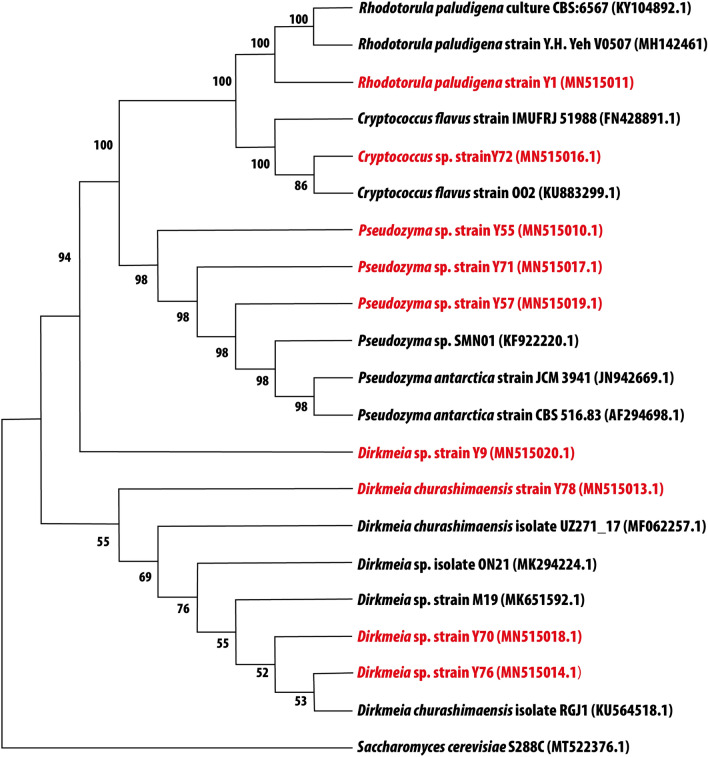
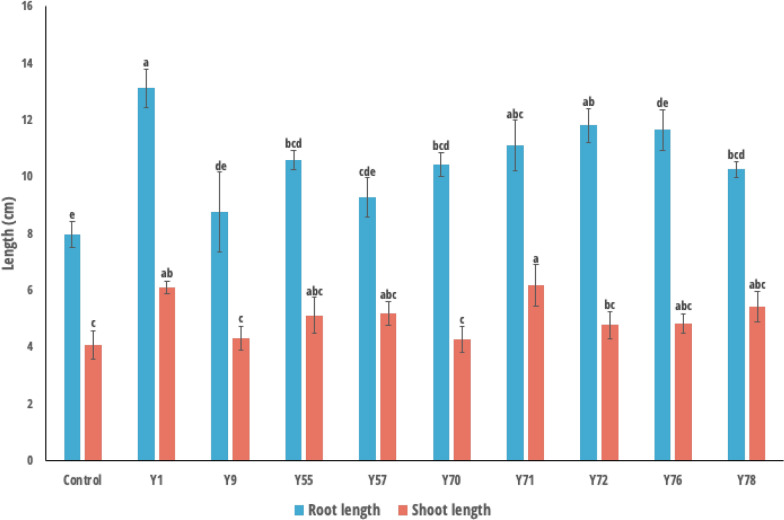
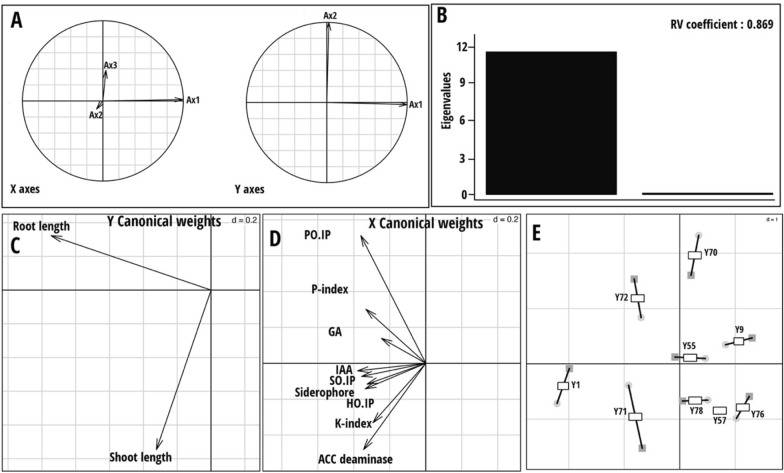
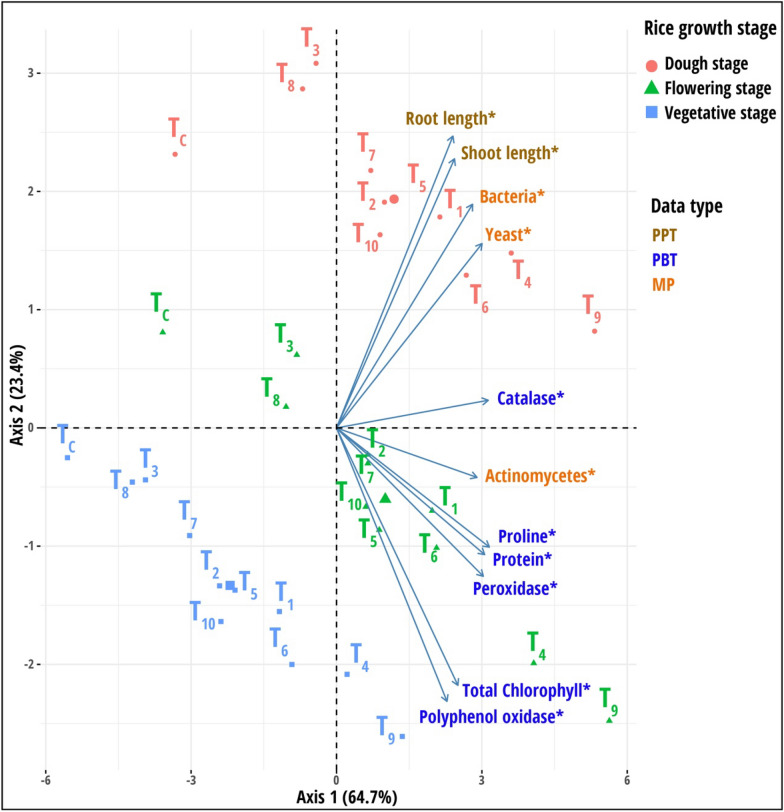
Results: From fifty-two rice yeast phyllosphere isolates, we identified three yeast strains-Rhodotorula paludigena Y1, Pseudozyma sp. Y71, and Cryptococcus sp. Y72-that could thrive at 36 °C and possessed significant multifarious plant growth-promoting traits, enhancing rice root and shoot length upon seed inoculation. These three strains demonstrated favorable compatibility, leading to the creation of a yeast consortium. We assessed the combined effect of foliar application of this yeast consortium and individual strains with two distinct recommended doses of chemical fertilizers (RDCFs) (75 and 100%), as well as RDCFs alone (75 and 100%), in rice maintained in pot-culture and field experiments. The pot-culture experiment investigated the leaf microbial community, plant biochemicals, root and shoot length during the stem elongation, flowering, and dough phases, and yield-related parameters at harvest. The field experiment determined the actual yield. Integrated results from both experiments revealed that the yeast consortium with 75% RDCFs was more effective than the yeast consortium with 100% RDCFs, single strain applications with RDCFs (75 and 100%), and RDCFs alone (75 and 100%). Additionally, this treatment improved leaf metabolite levels compared to control rice plants.

Conclusions: Overall, a 25% reduction in soil chemical fertilizers combined with yeast consortium foliar application improved rice growth, biochemicals, and yield. This study also advances the field of phyllosphere yeast research in agriculture.

Keywords: Crop improvement; Phyllosphere; Plant growth-promoting microbes; Rice; Yeast.


Conflict of interest statement

Declarations. Ethics approval: This material is the authors' own original work, which has not been previously published elsewhere. The paper reflects the authors' own research and analysis in a truthful and complete manner. Competing interests: The authors declare no competing interests.

Figures

Fig. 1
Fig. 1
The maximum likelihood phylogenetic tree based on ITS1 and ITS4 gene sequences, showing the relationships between the yeast taxa identified in this study. The bootstrap values ≥ 50% (based on 100 replications) are shown at branching points. Strains in red are the yeast strains isolated from the rice phyllosphere
Fig. 2
Fig. 2
Results of root and shoot length of rice obtained from the roll paper towel method treated with yeast strains. The strain codes on the plot are as follows, Y1—Rhodotorula paludigena Y1, Y9—Dirkmeia sp. Y9, Y55—Pseudozyma sp. Y55, Y57—Pseudozyma sp. Y57, Y70—Dirkmeia sp. Y70, Y71—Pseudozyma sp. Y71, Y27—Cryptococcus sp. Y72, Y76—Dirkmeia sp. Y76, and Y78—Dirkmeia churashimaensis Y78. Bars with different letters are significantly different according to Tukey’s test. p < 0.05
Fig. 3
Fig. 3
Co-inertia analysis (CIA) results based on two datasets (yeast plant growth promoting traits and rice phenotypic traits). A Projections of the principal axes of the two datasets onto the axes of the co-inertia analysis. X axes: Yeast plant growth promoting traits; Y axes: rice phenotypic traits. B Scree plot of eigenvalues. C Correlation of plant phenotypic traits data with the first two axes of the co-inertia analysis. D Correlation of yeast plant growth promoting traits and plant phenotypic traits with the first two axes of the co-inertia analysis. E Plot of the first two components in the sample space. Each sample is represented by a square, where the two datasets for each sample are connected by lines to a center point (global score). The strain codes on the plot are as follows, Y1—Rhodotorula paludigena Y1, Y9—Dirkmeia sp. Y9, Y55—Pseudozyma sp. Y55, Y57—Pseudozyma sp. Y57, Y70—Dirkmeia sp. Y70, Y71—Pseudozyma sp. Y71, Y27—Cryptococcus sp. Y72, Y76—Dirkmeia sp. Y76, and Y78—Dirkmeia churashimaensis Y78
Fig. 4
Fig. 4
Results of principal component analysis (PCA) based on the integration of all dataset categories measured in pot culture experiment. Variables marked with an asterisk are significant along the first principal component axis obtained from the PCAtest analysis. The treatments are as follows: T1Rhodotorula paludigena Y1 + 100% recommend dose of chemical fertilizers (RDCFs), T2Pseudozyma sp. Y71 + 100% RDCFs, T3Cryptococcus sp. Y72 + 100% RDCFs, T4—Yeast consortium (Rhodotorula paludigena Y1, Pseudozyma sp. Y71 and Cryptococcus sp. Y72) + 100% RDCFs, T5—100% RDCFs, T6Rhodotorula paludigena Y1 + 75% RDCFs, T7Pseudozyma sp. Y71 + 75% RDCFs, T8Cryptococcus sp. Y72 + 75% RDCFs, T9—Yeast consortium (Rhodotorula paludigena Y1, Pseudozyma sp. Y71 and Cryptococcus sp. Y72) + 75% RDCFs, T10—75% RDCFs, and TC – Control. Data type abbreviations: PBT, plant biochemical traits; PPT, plant phenotypic traits; and MP, Microbial population
Fig. 5
Fig. 5
A Comparison of the leaf metabolite profiles between control plants and those treated with the yeast consortium plus 75% RDCFs B Volcano plot illustrating the changes in leaf metabolites of plants treated with the yeast consortium plus 75% RDCFs compared to control plants. NS—nonsignificant
Fig. 6
Fig. 6
Multiple co-inertia analysis (MCIA) results based on nine data sets (Plant biochemical traits, plant phenotypic traits, and microbial population measured during stem elongation, flowering, and dough stages). A Plot of the first two components in the sample space. Each sample is represented by a colored shape, with lines connecting the nine datasets for each sample to a central point (MCIA global score). B Variable space for each data set. C A scree plot of absolute eigenvalues (bars) and the proportions of variance for the eigenvectors (line). D A plot of data weighting space that shows the pseudo-eigenvalues space of all data sets indicating how much variance of an eigenvalue is contributed by each data set. The treatment codes used are: T1Rhodotorula paludigena Y1 + 100% recommend dose of chemical fertilizers (RDCFs), T2Pseudozyma sp. Y71 + 100% RDCFs, T3Cryptococcus sp. Y72 + 100% RDCFs, T4—Yeast consortium (Rhodotorula paludigena Y1, Pseudozyma sp. Y71 and Cryptococcus sp. Y72) + 100% RDCFs, T5—100% RDCFs, T6Rhodotorula paludigena Y1 + 75% RDCFs, T7Pseudozyma sp. Y71 + 75% RDCFs, T8Cryptococcus sp. Y72 + 75% RDCFs, T9—Yeast consortium (Rhodotorula paludigena Y1, Pseudozyma sp. Y71 and Cryptococcus sp. Y72) + 75% RDCFs, T10—75% RDCFs, and TC – Control. The data set abbreviations PBT1, PBT2, and PBT3 are plant biochemical traits; PPT1, PPT2, and PPT3 are plant phenotypic traits; MP1, MP2, and MP3 are microbial population, and YP are yield parameters
Fig. 7
Fig. 7
A Results of multiple kernel learning analysis (MKL). A Plot of kernel principal component analysis (KPCA) based on nine data sets (Plant biochemical traits, plant phenotypic traits and microbial population measured during stem elongation, flowering, and dough stages). B Plot for important variables in each dataset assessed using Crone-Crosby distance. The treatment codes used are: T1Rhodotorula paludigena Y1 + 100% recommend dose of chemical fertilizers (RDCFs), T2Pseudozyma sp. Y71 + 100% RDCFs, T3Cryptococcus sp. Y72 + 100% RDCFs, T4—Yeast consortium (R. paludigena Y1, Pseudozyma sp. Y71 and Cryptococcus sp. Y72) + 100% RDCFs, T5—100% RDCFs, T6R. paludigena Y1 + 75% RDCFs, T7Pseudozyma sp. Y71 + 75% RDCFs, T8Cryptococcus sp. Y72 + 75% RDCFs, T9—Yeast consortium (Rhodotorula paludigena Y1, Pseudozyma sp. Y71 and Cryptococcus sp. Y72) + 75% RDCFs, T10—75% RDCFs, and TC – Control

Similar articles

References

    1. IPAD. USDA. India Rice Area, Yield and Production. 2024. Retrive from https://ipad.fas.usda.gov/countrysummary/Default.aspx?id=IN&crop=Rice.
    1. FAO. The state of food and agriculture. In: Moving forward on food loss and waste reduction. Rome: FAO; 2019.
    1. Deutsch CA, Tewksbury JJ, Tigchelaar M, Battisti DS, Merrill SC, Huey RB, Naylor RL. Increase in crop losses to insect pests in a warming climate. Science. 2018;361(6405):916–9. 10.1126/science.aat3466. - PubMed
    1. Koli P, Bhardwaj NR, Mahawer SK. Agrochemicals: harmful and beneficial effects of climate changing scenarios. In: Climate change and agricultural ecosystems. New Delhi: Woodhead Publishing; 2019. p. 65–94.
    1. Malhi GS, Kaur M, Kaushik P. Impact of climate change on agriculture and its mitigation strategies: a review. Sustainability. 2021;13(3):1318. 10.3390/su13031318.

LinkOut - more resources