. 2024 Dec 18;24(1):1183.
doi: 10.1186/s12870-024-05919-3.

Genome-wide identification and gene expression pattern analysis of the glycoside hydrolase family 1 in Fagopyrum tataricum

Affiliations

Genome-wide identification and gene expression pattern analysis of the glycoside hydrolase family 1 in Fagopyrum tataricum

Haizhu Yang et al. BMC Plant Biol. .

Abstract

Background: The β-glucosidases (BGLU) of glycoside hydrolase family 1 hydrolyze the glycosidic bond to release β-D-glucose and related ligands, which are widely involved in important physiological processes in plants. Genome-wide analysis of the BGLU genes in the model crops Arabidopsis thaliana and Oryza sativa revealed that they are functionally diverse. In contrast, the BGLU gene family in Tartary buckwheat remains unclear.

Results: This study identified the FtBGLU gene family based on Tartary buckwheat genomic data and analyzed the biological function of the FtBGLU gene using bioinformatics methods and the expression pattern of the gene using fluorescence quantitative PCR. The results showed that 39 BGLU genes were identified in Tartary buckwheat, which were classified into 10 subfamilies and one unclassified group. They were unevenly distributed on 10 chromosomes, and seven tandem duplication events involving 19 FtBGLU genes were observed, which mainly occurred in subfamily II. Their physicochemical properties are highly variable; however, they have relatively conserved exon-intron structures and high sequence homology in the subfamily, and most of the FtBGLUs contain conserved motifs, among which the expression products FtBGLU1, FtBGLU17, FtBGLU19, FtBGLU21, FtBGLU22, and FtBGLU28 have no β-glucosidase activity. Additionally, we analyzed the tissue expression specificity of 10 FtBGLU genes during Tartary buckwheat growth and development and their expression patterns under adversity stress and hormone treatments. Revealing the important role of the BGLU gene family in Tartary buckwheat growth and development, as well as its response to adversity, provides strong support for further analysis of its regulatory mechanisms and functional applications. A total of 39 FtBGLU genes were identified. Bioinformatics analysis of the gene structure, evolutionary relationship, and expression pattern of the Fagopyrum tataricum BGLU gene family establishes a foundation for a better understanding and future research on the Tartary buckwheat BGLU gene family.

Keywords: BGLU gene family; Fagopyrum tataricum; Evolutionary relationships; Expression patterns; Genome-wide analysis.


Conflict of interest statement

Declarations. Ethics approval and consent to participate: Plant materials, and collection do not necessitate licensing. The plant materials were maintained in accordance with the institutional guidelines established by the College of Agriculture at Guizhou University. The methodologies employed adhered to the pertinent guidelines and regulations. It should be noted that this study did not involve any human participants or animal experimentation carried out by the authors. Consent for publication: Not applicable. Clinical trial number: Not applicable. Competing interests: The authors declare no competing interests.

Figures

Fig. 1
Fig. 1
Phylogenetic tree of the relationships between the BGLU proteins of F. tataricum and A. thaliana. I, II, III, IV, V, VI, VII, VIII, IX, X, and UN group represent the different subfamilies
Fig. 2
Fig. 2
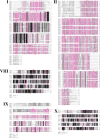
Multiple sequence alignments of the BGLU domains of the members of five phylogenetic subfamilies. Black, pink, and gray backgrounds indicate 100%, ≥ 80%, and ≥ 60% amino acid homology, respectively. Red boxes indicate the conserved motifs of β-glucosidase TFNEP and I/VTENG. The red triangles point to six amino acids that are essential for glucose binding (Q38, H142, E191, E406, E464, and W465)
Fig. 3
Fig. 3
Phylogenetic tree, gene structure, and motif pattern of BGLU genes in F. tataricum. (A) The phylogenetic tree constructed using the neighbor-joining method from the full-length sequence of the FtBGLU protein, with 1000 repetitive sequences per node. (B) Exons and introns are indicated by yellow rectangles and black lines, respectively. The numbers “0”, “1”, and “2” indicate the different stages of CDS in the gene. (C) Green, yellow, and pink rectangles represent the untranslated region (UTR), coding sequence (CDS), and BGLU structural domain (Glyco_hydro_1), respectively
Fig. 4
Fig. 4
The cis-acting element of the promoter region (upstream 2000 bp) of 39 FtBGLU genes in F. tataricum
Fig. 5
Fig. 5
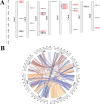
Schematic diagram of the chromosomal distribution and interchromosomal relationships of the F. tataricum BGLU genes. (A) Vertical bars represent the chromosomes of F. tataricum; each chromosome is labeled with a chromosome number on the left side of the chromosome; the scale on the left represents chromosome length. (B) Colored lines indicate all homologous blocks in the F. tataricum genome; chromosome numbers are labeled at the bottom of each chromosome
Fig. 6
Fig. 6
Synteny analyses of the BGLU genes between F. tataricum and six representative plants (B. distachyon, O. sativa, A. thaliana, C. quinoa, T. cacao, and S. lycopersicum). The gray lines on the background indicate the collinear blocks in the genomes of F. tataricum and other plants. Red lines highlight syntenic F. tataricum BGLU gene pairs
Fig. 7
Fig. 7
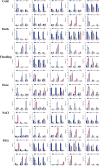
Relative expression patterns of 10 FtBGLUs (FtBGLU1, FtBGLU6, FtBGLU9, FtBGLU12, FtBGLU20, FtBGLU21, FtBGLU29, FtBGLU33, FtBGLU34, and FtBGLU38) under different stresses (cold, heat, dark, NaCl, flooding, and PEG) at the seedling stage: expression patterns of 10 FtBGLUs at 3, 12, and 24 h in root, stem, and leaf. Values of the column chart are expressed as mean ± SD; the lowercase letters represent significant differences (p < 0.05, Duncan test)
Fig. 8
Fig. 8
Correlation analysis of 10 FtBGLUs (FtBGLU1, FtBGLU6, FtBGLU9, FtBGLU12, FtBGLU20, FtBGLU21, FtBGLU29, FtBGLU33, FtBGLU34, and FtBGLU38) under different stresses (cold, heat, dark, NaCl, flooding, and PEG) at the seedling stage. A positive number represents a positive correlation, and a negative number indicates a negative correlation. The right color scale (− 0.40 to 1.00) represents the normalized gene expression correlation
Fig. 9
Fig. 9
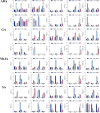
Relative expression patterns of 10 FtBGLUs (FtBGLU1, FtBGLU6, FtBGLU9, FtBGLU12, FtBGLU20, FtBGLU21, FtBGLU29, FtBGLU33, FtBGLU34, and FtBGLU38) under different hormone treatments (abscisic acid, ABA; methyl jasmonate, MeJA; gibberellin, GA; and salicylic acid, SA) at the seedling stage: expression patterns of 10 FtBGLUs at 3, 12, and 24 h in root, stem, and leaf. Values of the column chart are expressed as mean ± SD; the lowercase letters represent significant differences (p < 0.05, Duncan test)
Fig. 10
Fig. 10
Correlation analysis of 10 FtBGLUs (FtBGLU1, FtBGLU6, FtBGLU9, FtBGLU12, FtBGLU20, FtBGLU21, FtBGLU29, FtBGLU33, FtBGLU34, and FtBGLU38) under different hormone treatments (abscisic acid, ABA; methyl jasmonate, MeJA; gibberellin, GA; and salicylic acid, SA) at the seedling stage. A positive number represents a positive correlation, and a negative number indicates a negative correlation. The right color scale (− 0.20 to 1.00) represents the normalized gene expression correlation
Fig. 11
Fig. 11
Relative expression patterns and correlation analysis of 10 FtBGLUs (FtBGLU1, FtBGLU6, FtBGLU9, FtBGLU12, FtBGLU20, FtBGLU21, FtBGLU29, FtBGLU33, FtBGLU34, and FtBGLU38). (A) Expression patterns of 10 FtBGLUs at the mid-grain-filling stage in root, stem, young leaf, mature leaf, flower, grain, and husk. Values of the column chart are expressed as mean ± SD; the lowercase letters represent significant differences (p < 0.05, Duncan test). (B) Correlation hierarchical cluster analysis between their expression in different tissues at the mid-grain-filling stage. A positive number represents a positive correlation, and a negative number indicates a negative correlation. The right color scale (− 0.90 to 1.20) represents the normalized gene expression correlation
Fig. 12
Fig. 12
Relative expression patterns and correlation analysis of 10 FtBGLUs (FtBGLU1, FtBGLU6, FtBGLU9, FtBGLU12, FtBGLU20, FtBGLU21, FtBGLU29, FtBGLU33, FtBGLU34, and FtBGLU38) in grain and husk at different grain-filling stages. (A) Expression patterns of 10 FtBGLUs in the grain and husk during early, middle, and late grain-filling stages. Values of the column chart are expressed as mean ± SD; the lowercase letters represent significant differences (p < 0.05, Duncan test). (B) Correlation analysis between their expression in the grain and husk during the grain-filling stage. A positive number represents a positive correlation, and a negative number indicates a negative correlation. The right color scale (− 0.60 to 1.00) represents the normalized gene expression correlation

Similar articles

References

    1. Oliveira RP, Santos BV, Costal, Henrique MA, Daniel, Baffi MA. Xylanase and β-glucosidase production by aspergillus fumigatus using commercial and lignocellulosic substrates submitted to chemical pre-treatments. Ind Crop Prod. 2017;95:453–9. 10.1016/j.indcrop.2016.10.055.
    1. Gonzalez-pombo P, Farina L, Carrau F, Batista-Viera F, Brena B. A novel extracellular β-glucosidase from Issatchenkia terricola: isolation, immobilization and application for aroma enhancement of white Muscat wine. Process Biochem. 2011;46(1):385–9. 10.1016/j.procbio.2010.07.016.
    1. Henrissat B, Callebaut I, Fabrega S, Lehn P, Mornon JP, Davies G. Conserved catalytic machinery and the prediction of a common Fold for several families of glycosyl hydrolases. P Natl Acad Sci USA. 1995;92(15):7090–4. 10.1073/pnas.92.15.7090. - PMC - PubMed
    1. Cantarel BL, Coutinho PM, Rancurel C, Bernard T, Lombard V, Henrissat B. The carbohydrate-active EnZymes database (CAZy): an expert resource for glycogenomics. Nucleic Acids Res. 2009;37(Database issue):D233–8. 10.1093/nar/gkn663. - PMC - PubMed
    1. Opassiri R, Pomthong B, Akiyama T, Nakphaichit M, Onkoksoong T, Ketudat Cairns M, Ketudat Cairns JR. A stress-induced rice (Oryza sativa L.) beta-glucosidase represents a new subfamily of glycosyl hydrolase family 5 containing a fascin-like domain. Biochem J. 2007;408(2):241–9. 10.1042/BJ20070734. - PMC - PubMed

LinkOut - more resources