

Spall: accurate and robust unveiling cellular landscapes from spatially resolved transcriptomics data using a decomposition network
- PMID: 39695962
- PMCID: PMC11656923
- DOI: 10.1186/s12859-024-06003-1
Spall: accurate and robust unveiling cellular landscapes from spatially resolved transcriptomics data using a decomposition network
Abstract
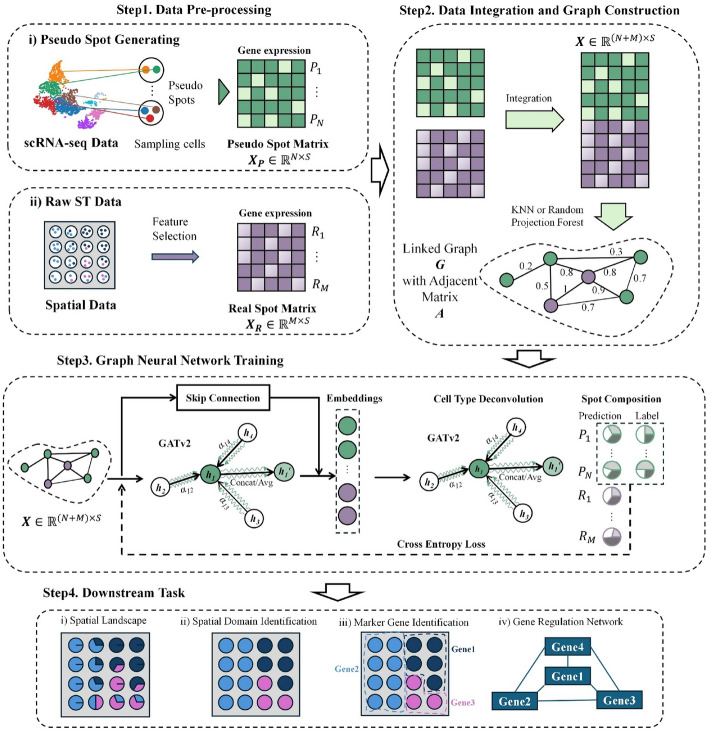
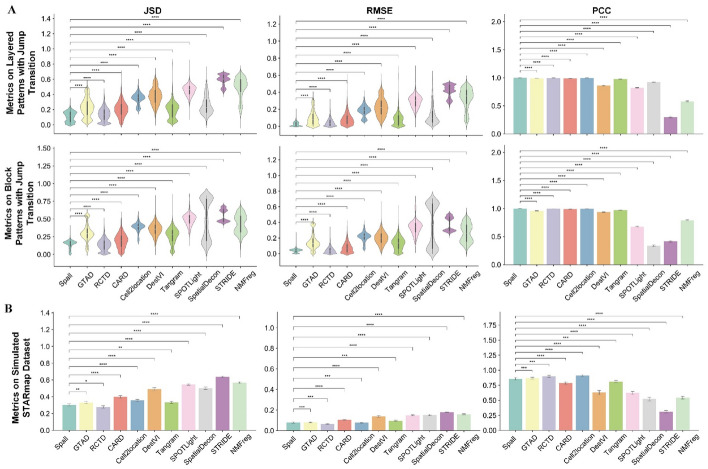
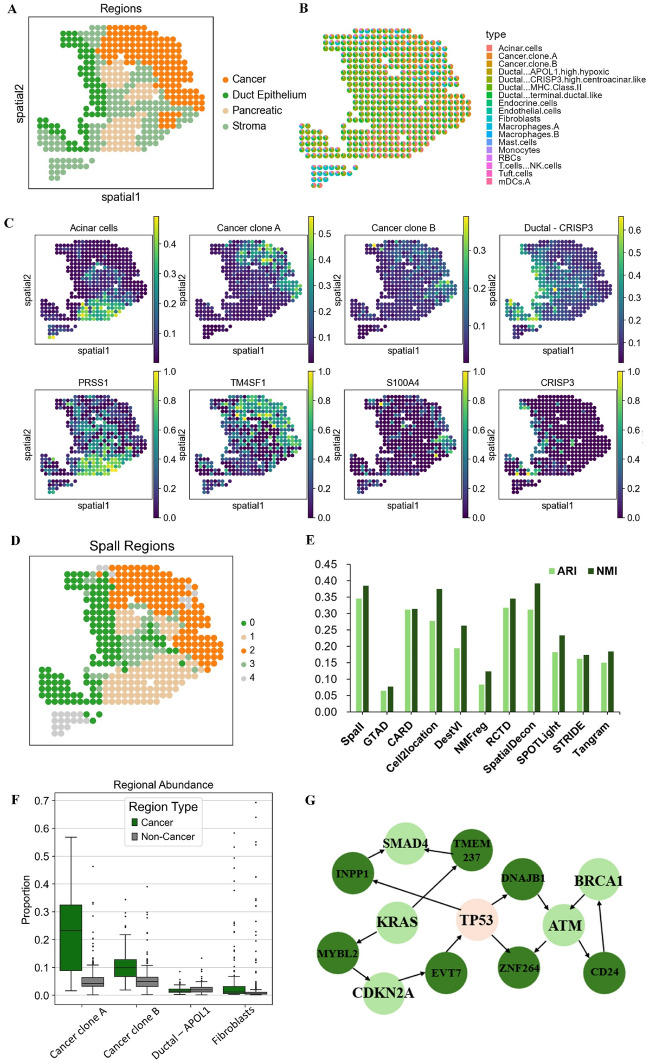
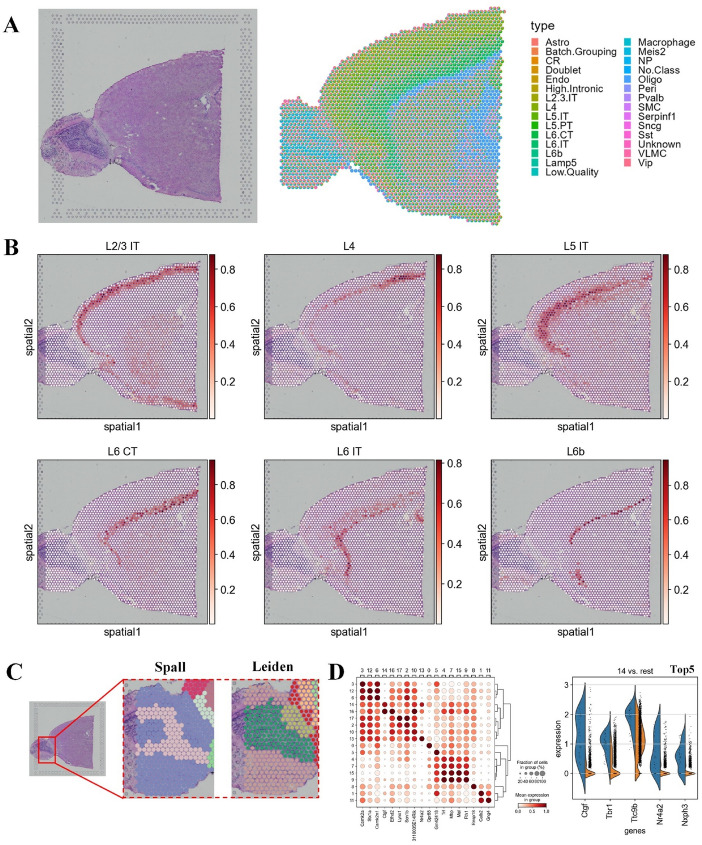
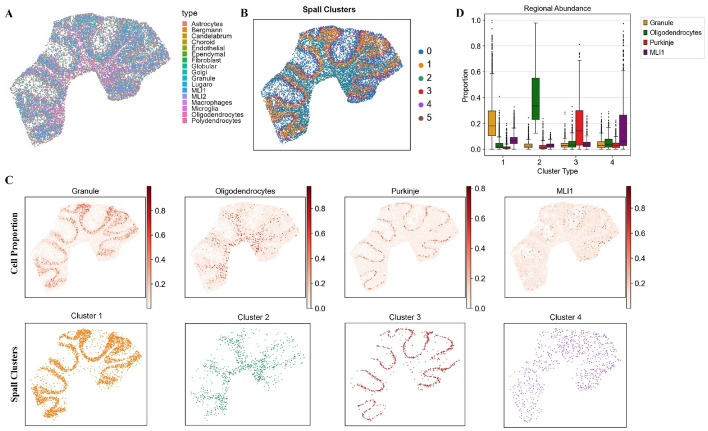
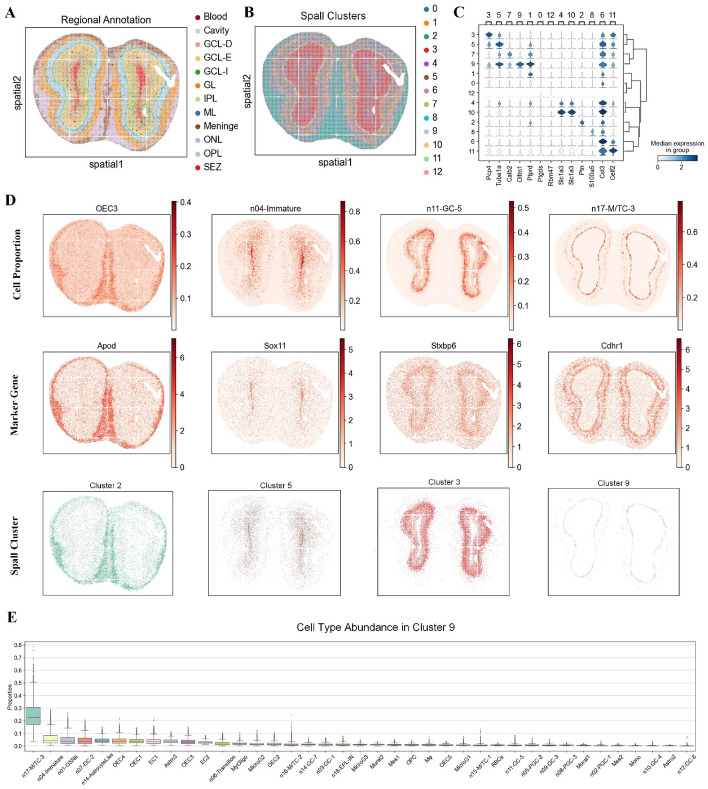
Recent developments in spatially resolved transcriptomics (SRT) enable the characterization of spatial structures for different tissues. Many decomposition methods have been proposed to depict the cellular distribution within tissues. However, existing computational methods struggle to balance spatial continuity in cell distribution with the preservation of cell-specific characteristics. To address this, we propose Spall, a novel decomposition network that integrates scRNA-seq data with SRT data to accurately infer cell type proportions. Spall introduced the GATv2 module, featuring a flexible dynamic attention mechanism to capture relationships between spots. This improves the identification of cellular distribution patterns in spatial analysis. Additionally, Spall incorporates skip connections to address the loss of cell-specific information, thereby enhancing the prediction capability for rare cell types. Experimental results show that Spall outperforms the state-of-the-art methods in reconstructing cell distribution patterns on multiple datasets. Notably, Spall reveals tumor heterogeneity in human pancreatic ductal adenocarcinoma samples and delineates complex tissue structures, such as the laminar organization of the mouse cerebral cortex and the mouse cerebellum. These findings highlight the ability of Spall to provide reliable low-dimensional embeddings for downstream analyses, offering new opportunities for deciphering tissue structures.
Keywords: Cell type proportion; Decomposition; Graph neural network; Spatially resolved transcriptomics; Tissue structure.
© 2024. The Author(s).
Conflict of interest statement
Declarations. Ethics approval and consent to participate: Not applicable. Consent for publication: Not applicable. Competing interests: The authors declare no competing interests.
Figures
Similar articles
-
Precise gene expression deconvolution in spatial transcriptomics with STged.Nucleic Acids Res. 2025 Feb 8;53(4):gkaf087. doi: 10.1093/nar/gkaf087. Nucleic Acids Res. 2025. PMID: 39970279 Free PMC article.
-
Spatially Aware Domain Adaptation Enables Cell Type Deconvolution from Multi-Modal Spatially Resolved Transcriptomics.Small Methods. 2025 May;9(5):e2401163. doi: 10.1002/smtd.202401163. Epub 2024 Dec 2. Small Methods. 2025. PMID: 39623794
-
Deciphering spatial domains from spatially resolved transcriptomics through spatially regularized deep graph networks.BMC Genomics. 2024 Nov 29;25(1):1160. doi: 10.1186/s12864-024-11072-w. BMC Genomics. 2024. PMID: 39614161 Free PMC article.
-
Integrating Spatially-Resolved Transcriptomics Data Across Tissues and Individuals: Challenges and Opportunities.Small Methods. 2025 May;9(5):e2401194. doi: 10.1002/smtd.202401194. Epub 2025 Feb 11. Small Methods. 2025. PMID: 39935130 Free PMC article. Review.
-
Challenges and considerations for single-cell and spatially resolved transcriptomics sample collection during spaceflight.Cell Rep Methods. 2022 Oct 31;2(11):100325. doi: 10.1016/j.crmeth.2022.100325. eCollection 2022 Nov 21. Cell Rep Methods. 2022. PMID: 36452864 Free PMC article. Review.
References
-
- Zhang W, Xu H, Qiao R, et al. ARIC: accurate and robust inference of cell type proportions from bulk gene expression or DNA methylation data. Brief Bioinform. 2022;23(1):bbab362. - PubMed
MeSH terms
Grants and funding
LinkOut - more resources
Full Text Sources
Medical
