

Exploring the genetic diversity and population structure of an ancient hexaploid wheat species Triticum sphaerococcum using SNP markers
- PMID: 39695987
- PMCID: PMC11656872
- DOI: 10.1186/s12870-024-05968-8
Exploring the genetic diversity and population structure of an ancient hexaploid wheat species Triticum sphaerococcum using SNP markers
Abstract
Background: Understanding genetic diversity and population structure is crucial for strategizing and enhancing breeding efficiency. Wheat, a globally cultivated crop, is a significant source of daily calories for humans. To overcome challenges such as extreme climatic fluctuations, stagnant yields, and diminishing genetic variation, it is essential to develop diverse germplasms with new alleles. Triticum sphaerococcum, an underutilized ancient hexaploid wheat species, shows promise for contributing beneficial alleles. However, the genetic diversity of its germplasms remains unstudied. This is the first report where we have examined the genetic diversity and population structure of 116 T. sphaerococcum accessions using a 35 K SNP Array. The objective of this study is to apply these findings to improve wheat breeding programs.
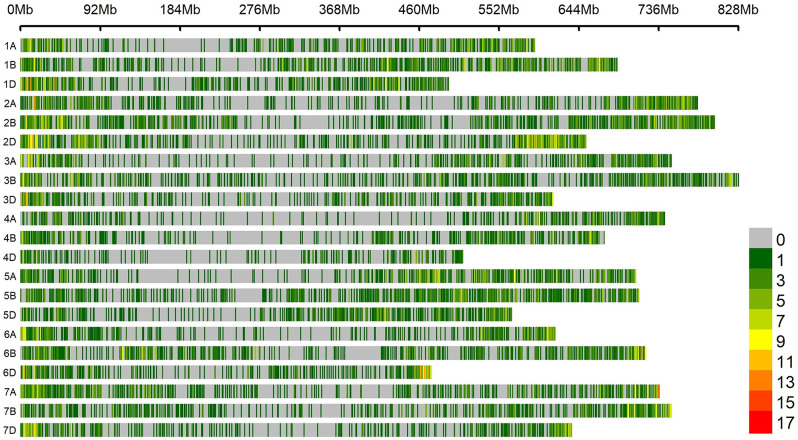
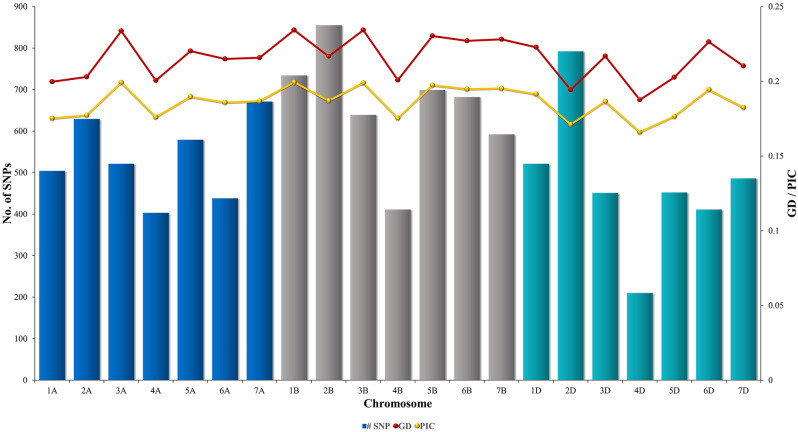
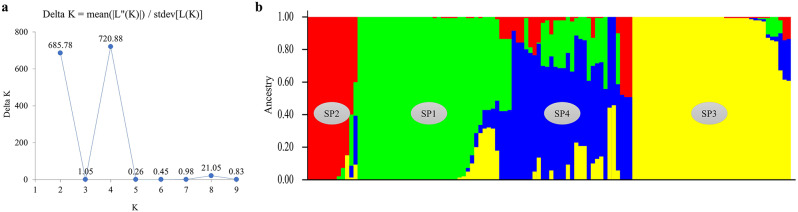
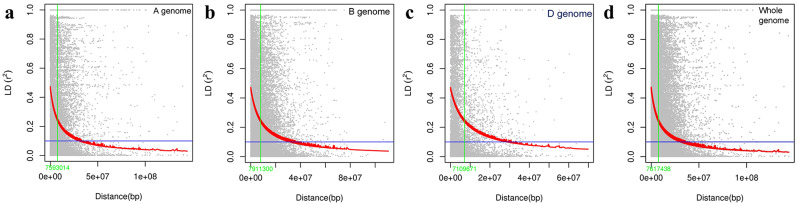
Results: Analysis of the population's genetic structure identified four potential subpopulations, which was supported by principal coordinate analysis. Allele neutrality tests showed an abundance of intermediate genotypes, suggesting that many beneficial alleles are maintained through balancing selection. Among the three subgenomes, subgenome B exhibited the highest genetic diversity. AMOVA (Analysis of Molecular Variance) revealed significant variation both among (35%) and within (65%) the four subpopulations. The high genetic differentiation between subpopulations was corroborated by a moderate level of haploid migrant numbers (Nm = 1.286), indicating sufficient gene flow. SP4 emerged as the most diverse subpopulation, showing the highest values for allelic pattern indices due to its larger size and higher percentage of polymorphic loci. The D subgenome displayed a faster linkage disequilibrium (LD) decay rate compared to the A and B subgenomes. Haplotype block analysis identified 260 haplotype blocks of varying sizes distributed across the genome.
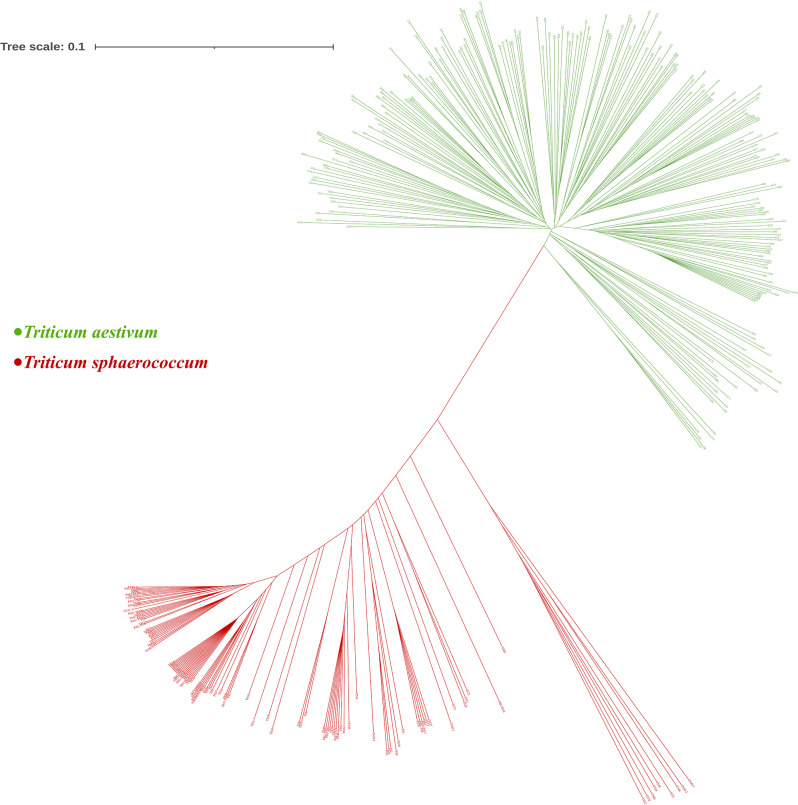
Conclusions: This research demonstrates that Indian dwarf wheat accessions, sourced from three distinct gene banks and local collections, possess considerable genetic diversity. These germplasm collections offer valuable opportunities to investigate their unexplored genetic potential. They can be utilized in wheat improvement initiatives to tackle both present and future breeding challenges. Furthermore, these accessions can introduce new alleles to broaden the genetic base of modern wheat varieties, enhancing their overall diversity.
Keywords: Genetic diversity; Indian dwarf wheat; SNP Triticum sphaerococcum; haplotypes; linkage disequilibrium; population structure.
© 2024. The Author(s).
Conflict of interest statement
Declarations. Ethics approval and consent to participate: Not applicable. Consent for publication: Not applicable. Competing interests: The authors declare no competing interests.
Figures


Similar articles
-
Molecular genetic analysis of spring wheat core collection using genetic diversity, population structure, and linkage disequilibrium.BMC Genomics. 2020 Jun 26;21(1):434. doi: 10.1186/s12864-020-06835-0. BMC Genomics. 2020. PMID: 32586286 Free PMC article.
-
Characterization of genetic diversity and population structure in wheat using array based SNP markers.Mol Biol Rep. 2020 Jan;47(1):293-306. doi: 10.1007/s11033-019-05132-8. Epub 2019 Oct 19. Mol Biol Rep. 2020. PMID: 31630318
-
Linkage disequilibrium patterns, population structure and diversity analysis in a worldwide durum wheat collection including Argentinian genotypes.BMC Genomics. 2021 Apr 5;22(1):233. doi: 10.1186/s12864-021-07519-z. BMC Genomics. 2021. PMID: 33820546 Free PMC article.
-
Unlocking the novel genetic diversity and population structure of synthetic Hexaploid wheat.BMC Genomics. 2018 Aug 6;19(1):591. doi: 10.1186/s12864-018-4969-2. BMC Genomics. 2018. PMID: 30081829 Free PMC article.
-
Genetic diversity, linkage disequilibrium, and population structure of tetraploid wheat landraces originating from Europe and Asia.BMC Genomics. 2023 Nov 14;24(1):682. doi: 10.1186/s12864-023-09768-6. BMC Genomics. 2023. PMID: 37964224 Free PMC article.
Cited by
-
Fossil or Non-Fossil: A Case Study in the Archaeological Wheat Triticum parvicoccum (Poaceae: Triticeae).Genes (Basel). 2025 Feb 25;16(3):274. doi: 10.3390/genes16030274. Genes (Basel). 2025. PMID: 40149426 Free PMC article.
-
Genetic dissection of Septoria tritici blotch and Septoria nodorum blotch resistance in wheat using GWAS.Front Plant Sci. 2025 May 13;16:1524912. doi: 10.3389/fpls.2025.1524912. eCollection 2025. Front Plant Sci. 2025. PMID: 40433159 Free PMC article.
-
Evaluating heat and drought resilience in ancient Indian Dwarf wheat Triticum sphaerococcum Percival using stress tolerance indices.Sci Rep. 2025 May 30;15(1):18970. doi: 10.1038/s41598-025-02502-0. Sci Rep. 2025. PMID: 40447645 Free PMC article.
-
Unravelling genetic diversity in pointed gourd (Trichosanthes dioica) genotypes from India's Eastern plateau and hill region: Insights from morphological and molecular markers.J Genet Eng Biotechnol. 2025 Sep;23(3):100542. doi: 10.1016/j.jgeb.2025.100542. Epub 2025 Jul 19. J Genet Eng Biotechnol. 2025. PMID: 40854661 Free PMC article.
References
-
- Erenstein O, Jaleta M, Mottaleb KA, Sonder K, Donovan J, Braun HJ. Global trends in wheat production, consumption and trade. In: Reynolds MP, Braun HJ, editors. Wheat improvement: food security in a changing climate. Cham: Springer International Publishing; 2022. pp. 47–66. 10.1007/978-3-030-90673-3_4.
-
- FAO. WIEWS - World Information and Early Warning System on Plant Genetic Resources for Food and Agriculture | Food and Agriculture Organization of the United Nations. https://www.fao.org/wiews/data/ex-situ-sdg-251/overview/en/. Accessed 2 Sept 2024.
MeSH terms
Grants and funding
LinkOut - more resources
Full Text Sources
Research Materials
