. 2024 Dec 18;24(1):919.
doi: 10.1186/s12888-024-06350-6.

Aberrant amplitude of low-frequency fluctuation and functional connectivity in children with different subtypes of ADHD: a resting-state fNIRS study

Affiliations

Aberrant amplitude of low-frequency fluctuation and functional connectivity in children with different subtypes of ADHD: a resting-state fNIRS study

Qinwei Liu et al. BMC Psychiatry. .

Abstract

Background: Attention-deficit/hyperactivity disorder (ADHD) is a neurodevelopmental disorder with different subtypes of pathogenesis. Insufficient research on the subtypes of ADHD has limited the effectiveness of therapeutic methods.

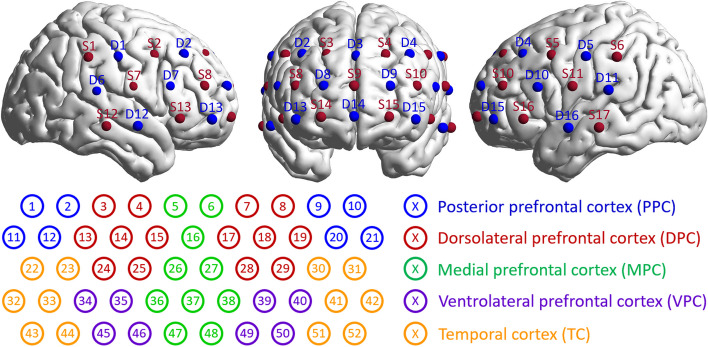
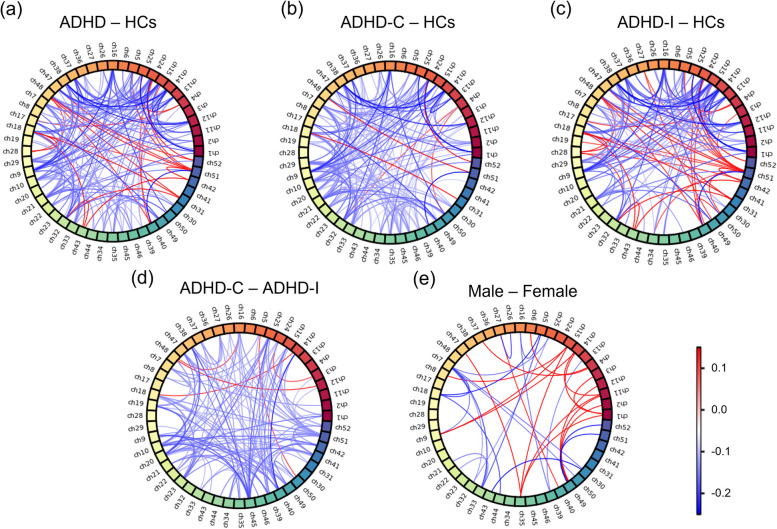
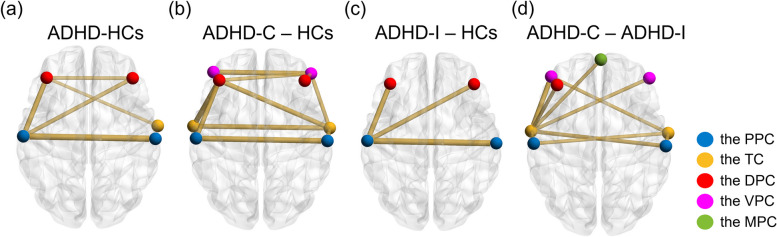
Methods: This study used resting-state functional near-infrared spectroscopy (fNIRS) to record hemodynamic signals in 34 children with ADHD-combined subtype (ADHD-C), 52 children with ADHD-inattentive subtype (ADHD-I), and 24 healthy controls (HCs). The amplitude of low-frequency fluctuation (ALFF) and the functional connectivity (FC) analysis were conducted for all subjects.

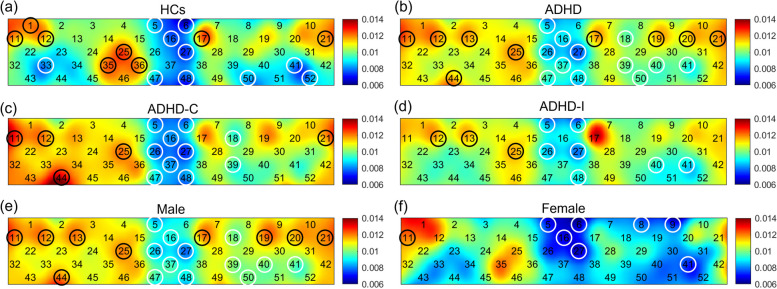
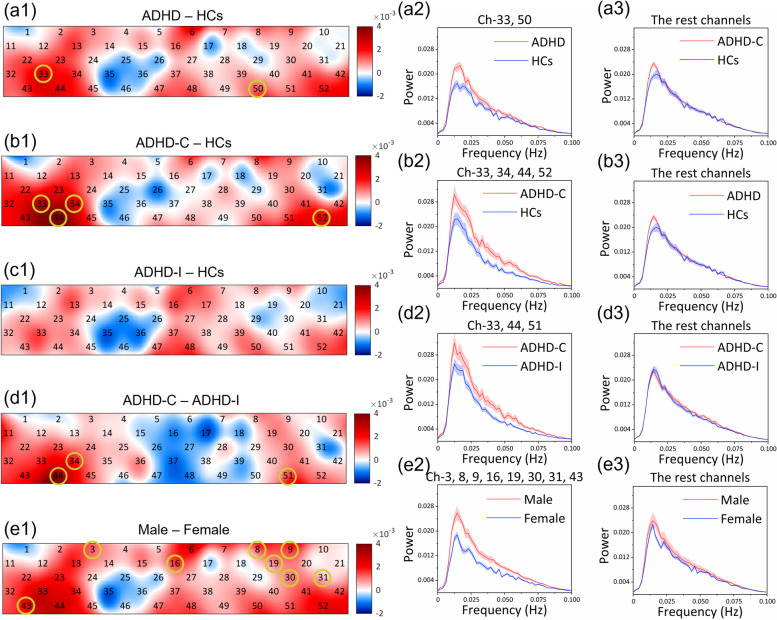
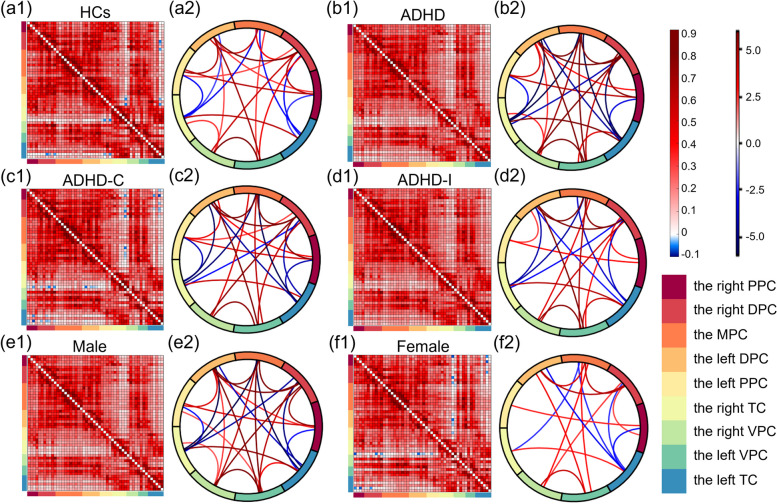
Results: Compared with HCs, the ADHD group exhibited significantly increased ALFF and decreased FC. The ADHD-C group showed significantly higher ALFF in partial brain regions and significantly lower FC between multiple brain regions than participants with ADHD-I. The male group displayed a significant increase in ALFF in some brain regions, while no significant difference was found in FC when compared to the female group.

Conclusions: This study provides evidence to support the subtype classification of ADHD-I and ADHD-C, and the combined analysis of ALFF and FC has the potential to be a promising biomarker for the diagnosis of ADHD.

Keywords: Amplitude of low-frequency fluctuation; Functional connectivity; Functional near-infrared spectroscopy; Subtypes of ADHD.


Conflict of interest statement

Declarations. Ethics approval and consent to participate: This study was approved by the Medical Research Ethics Committee of Peking University Sixth Hospital (IRB number: 2016-15), in accordance with the "Ethical Review Measures for Life Sciences and Medical Research Involving Human Beings". Written informed consent was obtained from the guardians of all participants before the experiment. Consent for publication: Not applicable. Competing interests: The authors declare no competing interests.

Figures

Fig. 1
Fig. 1
The arrangement of 17 light sources and 16 detectors on the brain model and the correspondence between 52 channels and regions of interest (ROIs)
Fig. 2
Fig. 2
The activation pattern of 52 channels in HCs (a), all ADHD patients (b), the ADHD-C subtype (c), the ADHD-I subtype (d), male patients (e), and female patients (f). The color bar indicates different ALFF values. The circles highlight the channels with significantly higher (black) and lower ALFF values (white), respectively, in the one-sample T-test (p < 0.05)
Fig. 3
Fig. 3
(a1-e1) The subtraction of ALFF values in each channel between groups. The color bar indicates different ALFF subtractions. The circles highlight the channels with significant differences in the two-sample T-test between groups (p < 0.05). (a2, b2, d2, e2) The average Fourier spectra of the channels with significant differences; the large spectrum value indicates strong activation. (a3, b3, d3, e3) The average Fourier spectra of the channels with no significant differences. The error bars were generated from the standard error of each group
Fig. 4
Fig. 4
The FC distribution of each group. Nine ROIs were visualized with nine different colors. (a1-f1) The square diagrams show the average FC matrixes of each group. Their horizontal and vertical coordinates referred to the fifty-two channels, the order of which was consistent with the ROIs shown in Fig. 1(b). Pixels with different colors indicate different FC values between two channels, as shown in the first color bar. (a2-f2) The circle diagrams visualized the T values in the one-sample T-test, which was executed in each group to analyze the significance of each FC value. Wires with different colors indicate different T values, as the second color bar shows. Only partial T values that indicated significance in the one-sample T-test (p < 0.05) were visualized
Fig. 5
Fig. 5
The subtraction of FC values between groups. Fifty-two channels were visualized with fifty-two different colors, and the order was consistent with the ROIs, as shown in Fig. 1(b). Each wire indicates the subtraction of the FC value between two channels. Only partial subtractions of FC values that indicated a significant difference in the two-sample T-test (p < 0.05) would be visualized
Fig. 6
Fig. 6
The subtraction of FC values between groups. The spheres with different colors indicate different brain regions. The lines with different thicknesses indicate the subtractions of FC values between two brain regions. Thicker and thinner lines indicate higher and lower absolute subtraction of FC values, respectively. Only partial subtractions of FC values that indicated significant differences in the two-sample T-test (p < 0.05) would be visualized. There is no map showing the subtraction between the Male and Female group because no significant difference was found between the two groups. The subtraction of FC values visualized in these diagrams were all negative

Similar articles

Cited by

References

    1. Sibley MH, Bruton AM, Zhao X, Johnstone JM, Mitchell J, Hatsu I, Arnold LE, Basu HH, Levy L, Vyas P, et al. Non-pharmacological interventions for attention-deficit hyperactivity disorder in children and adolescents. Lancet Child Adolesc Health. 2023;7(6):415–28. - PMC - PubMed
    1. Salari N, Ghasemi H, Abdoli N, Rahmani A, Shiri MH, Hashemian AH, Akbari H, Mohammadi M. The global prevalence of ADHD in children and adolescents: a systematic review and meta-analysis. Ital J Pediatr. 2023;49(1):48. - PMC - PubMed
    1. Posner J, Polanczyk GV, Sonuga-Barke E. Attention-deficit hyperactivity disorder. Lancet. 2020;395(10222):450-62. - PMC - PubMed
    1. Baggio S, Billieux J, Dirkzwager A, Iglesias K, Moschetti K, Perroud N, Schneider M, Vernaz N, Wolff H, Heller P. Protocol of a monocentric, double-blind, randomized, superiority, controlled trial evaluating the effect of in-prison OROS-methylphenidate vs. placebo treatment in detained people with attention-deficit hyperactivity disorder (BATIR). Trials. 2024;25(1):23. - PMC - PubMed
    1. Barra S, Turner D, Müller M, Hertz PG, Retz-Junginger P, Tüscher O, Huss M, Retz W. ADHD symptom profiles, intermittent explosive disorder, adverse childhood experiences, and internalizing/externalizing problems in young offenders. Eur Arch Psychiatry Clin NeuroSci. 2022;272(2):257–69. - PMC - PubMed

MeSH terms

LinkOut - more resources