. 2024 Dec 18;22(1):608.
doi: 10.1186/s12964-024-01990-3.

CD69+CD103+CD8+ tissue-resident memory T cells possess stronger anti-tumor activity and predict better prognosis in colorectal cancer

Affiliations

CD69+CD103+CD8+ tissue-resident memory T cells possess stronger anti-tumor activity and predict better prognosis in colorectal cancer

Zi-Xin Wu et al. Cell Commun Signal. .

Abstract

Background: Colorectal cancer (CRC) is one of the most prevalent cancers worldwide. Despite advancements in therapeutic methodologies, it still causes a high rate of patient mortality. CD8+ tissue-resident memory T (TRM) cells are strategically positioned to mediate effective anti-tumor responses. However, the characteristic surface molecules and functions of CD8+ TRM cells exhibit significant heterogeneity.

Methods: The roles and anti-tumor biological functions of different CD8+ TRM subsets in CRC were determined by clinical CRC samples, bioinformatics analysis, and in vitro experiments including co-culture experiments and transwell migration assays. The signaling pathways that synergistically regulate the differentiation of CD8+ TRM cells were identified by in vitro CD8+ T cell activation and inhibition assays, and the functioning transcription factors were predicted using the UCSC and JASPAR databases.

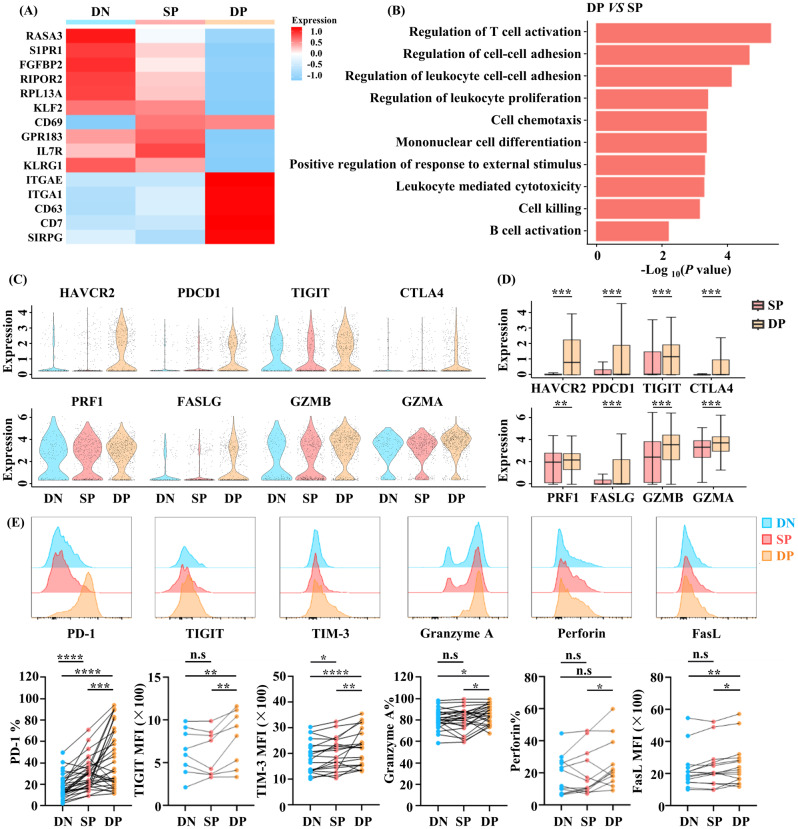
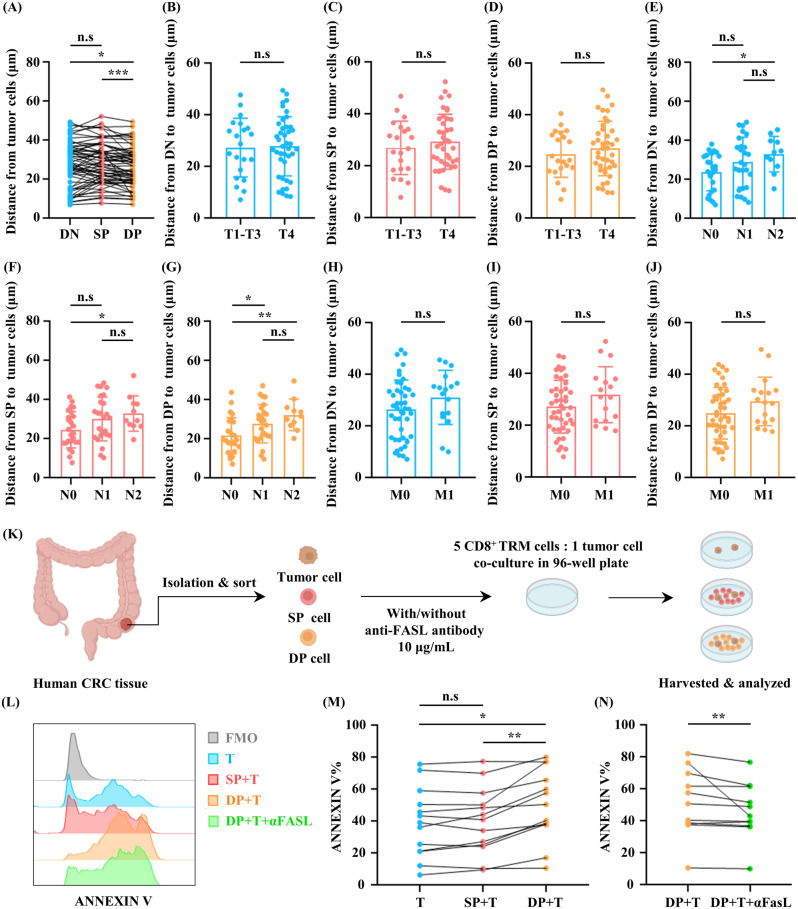
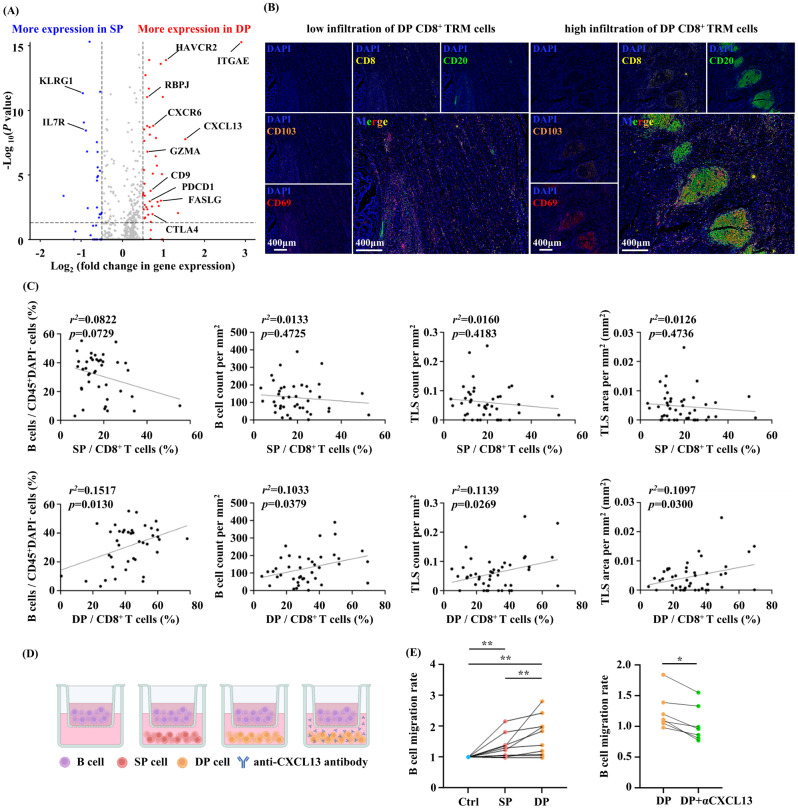
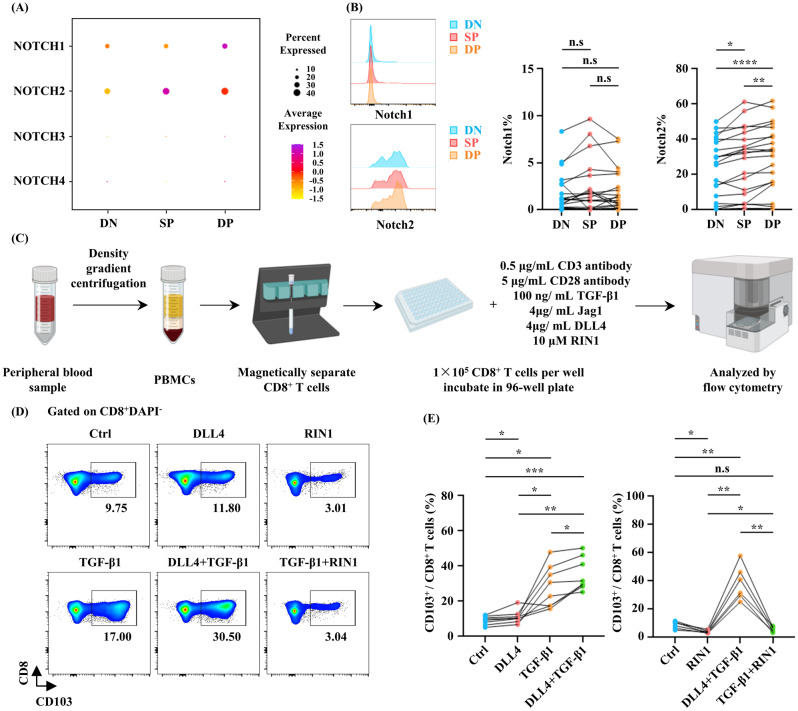
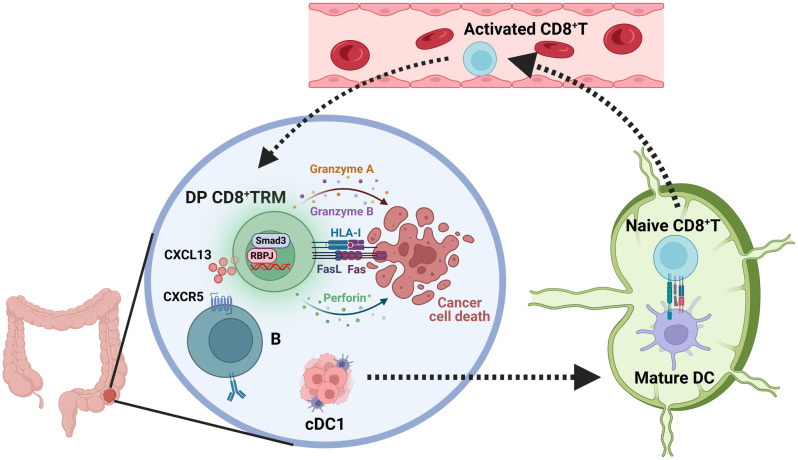
Results: We found that different CD8+ TRM subsets existed in CRC tumor tissues, which were identified as CD69-CD103-CD8+ TRM, CD69+CD103-CD8+ TRM (SP CD8+ TRM), and CD69+CD103+CD8+ TRM (DP CD8+ TRM) subsets. Compared with SP CD8+ TRM cells, increased infiltration of DP CD8+ TRM cells predicted better prognosis and played a protective role mainly in tumor invasion and lymph node metastasis of CRC. DP CD8+ TRM cells expressed higher levels of effector molecules and exerted stronger anti-tumor effects in a FAS/FASL pathway-dependent manner. Additionally, DP CD8+ TRM cells secreted higher levels of CXCL13 and recruited B cells into tumor tissues through the CXCL13/CXCR5 signaling axis to form tertiary lymphoid structures, participating in anti-tumor immune responses. Notch and TGF-β signaling pathways synergistically regulate the differentiation of DP CD8+ TRM cells.

Conclusions: We clarified the roles and mechanisms of different CD8+ TRM subsets in CRC and identified that DP CD8+ TRM cells exert stronger anti-tumor effects and predict better prognosis, which provides ideas for developing new clinically available therapeutic targets.

Keywords: Anti-tumor effect; CD103; CD69; Colorectal cancer; Prognosis; Tissue-resident memory T cell.


Conflict of interest statement

Declarations. Ethics approval and consent to participate: This study was approved by the Ethics Review Committee of Guangzhou First People’s Hospital and Guangdong Provincial People’s Hospital (No. K-2019-070-01 and KY2023-453-02) and conducted in accordance with recognized ethical guidelines. Written informed consent was obtained from all participants. Consent for publication: Not applicable. Competing interests: The authors declare no competing interests.

Figures

Fig. 1
Fig. 1
Prognosis effect of CD69 and ITGAE in patients with CRC. (A) Disease-free survival rate and overall survival rate of ITGAE high and ITGAE low patients with CRC from the TCGA dataset. (B) Disease-free survival rate and overall survival rate of CD69 high and CD69 low patients with CRC from the TCGA dataset. (C) Disease-free survival rate and overall survival rate of ITGAE high CD69 high and non-ITGAE high CD69 high patients with CRC from the TCGA dataset. (D) T-SNE plot of CD45+DAPI cells in the CRC tumor tissues with main subclusters indicated. (E) Feature plots of CD45+DAPI cell markers. (F) Percentages of T, B, NK, CD3+CD56+, CD8+ T, memory CD8+ T, CD4+ T, memory CD4+ T, Treg, and other cells of CD69+CD103+ cells in the CRC tumor tissues (n = 9). All data represented as mean ± SD. Statistical analysis was performed by non-parametric Mann-Whitney U test and Kruskal-Wallis test with Dunn’s multiple comparisons test. (*p < 0.05; **p < 0.01; ***p < 0.001; ****p < 0.0001; n.s: not significant)
Fig. 2
Fig. 2
Relationship between infiltration of different CD8+ TRM subsets and different TNM stages. (A) Flow cytometric analysis showing CD69CD103 double-negative (DN, blue), CD69+CD103 single-positive (SP, red), and CD69+CD103+ double-positive (DP, orange) CD8+ TRM subsets in CRC tumor tissues. (B-J) Relationship between the proportion of different CD8+ TRM subsets detected by flow cytometry and different TNM stages (n = 45). (K) The FFPE CRC tumor tissue slides from patients with CRC were stained with DAPI (blue), CD8 (green), CD69 (red), CD103 (orange), and CK19 (cyan). (L) Relationship between the proportion of different CD8+ TRM subsets detected by mIHC and different TNM stages (n = 64). All data represented as mean ± SD. Statistical analysis was performed by non-parametric Mann-Whitney U test and Kruskal-Wallis test with Dunn’s multiple comparisons test. (*p < 0.05; n.s: not significant)
Fig. 3
Fig. 3
Gene expression profile of different CD8+ TRM subsets. (A) Heatmap showing the top five up-regulated genes for different CD8+ TRM subsets of the GSE108989 dataset. (B) Up-regulated gene sets in DP CD8+ TRM cells compared with SP CD8+ TRM cells by GO analysis of the GSE108989 dataset. (C) Violin plots showing the expressions of HAVCR2, PDCD1, TIGIT, CTLA4, PRF1, FASLG, GZMB, and GZMA in different CD8+ TRM subsets of the GSE108989 dataset. (D) Box plots showing the expressions of HAVCR2, PDCD1, TIGIT, CTLA4, PRF1, FASLG, GZMB, and GZMA in different CD8+ TRM subsets of the GSE108989 dataset. Data represented as mean ± SD. Statistical analysis was performed by non-parametric Mann-Whitney U test. (E) Representative histogram overlays and statistics of PD-1 (n = 33), TIGIT (n = 8), TIM-3 (n = 20), granzyme A (n = 25), perforin (n = 12), and FasL (n = 15) expression in different CD8+ TRM subsets in CRC tumor tissues detected by flow cytometry. Statistical analysis was performed by Friedman test with Dunn’s multiple comparisons test. (*p < 0.05; **p < 0.01; ***p < 0.001; ****p < 0.0001; n.s: not significant)
Fig. 4
Fig. 4
Killing ability of different CD8+ TRM subsets. (A) Distances from different CD8+ TRM subsets to tumor cells (n = 64). Statistical analysis was performed by Friedman test with Dunn’s multiple comparisons test. (B-J) Relationship between the distances from different CD8+ TRM subsets to tumor cells and different TNM stages (n = 64). Data represented as mean ± SD. Statistical analysis was performed by non-parametric Mann-Whitney U test and Kruskal-Wallis test with Dunn’s multiple comparisons test. (K) Schematic overview of the CD8+ TRM cell-tumor cell co-culture system design and analytical workflow. (L) Representative histogram overlays of ANNEXIN V of tumor cells cultured either alone or with different CD8+ TRM subsets with or without anti-FasL blocking antibody. (M) Expressions of ANNEXIN V of tumor cells cultured either alone or with different CD8+ TRM subsets (n = 13). Statistical analysis was performed by Friedman test with Dunn’s multiple comparisons test. (N) Expressions of ANNEXIN V of tumor cells co-cultured with DP CD8+ TRM cells with or without anti-FasL blocking antibody (n = 11). Statistical analysis was performed by non-parametric Wilcoxon’s matched-pairs tests. (T: tumor cells; SP + T: tumor cells co-cultured with SP CD8+ TRM cells; DP + T: tumor cells co-cultured with DP CD8+ TRM cells; DP + T + αFASL: tumor cells co-cultured with DP CD8+ TRM cells and anti-FasL blocking antibody. *p < 0.05; **p < 0.01; ***p < 0.001; n.s: not significant)
Fig. 5
Fig. 5
Relationship between the proportion of different CD8+ TRM subsets and DC subsets. (A) Correlation between the proportion of different CD8+ TRM subsets and DC subsets in CRC tumor tissues (n = 27). Statistical analysis was performed by Pearson correlation analysis. (B-C) Expressions of Ki-67 (n = 17) and ANNEXIN V (n = 9) of different CD8+ TRM subsets in CRC tumor tissues. Statistical analysis was performed by Friedman test with Dunn’s multiple comparisons test. (*p < 0.05; **p < 0.01; n.s: not significant)
Fig. 6
Fig. 6
Relationship of different CD8+ TRM subset with B cells and TLS in CRC tumor tissues. (A) Volcano plot showing differentially expressed genes between DP CD8+ TRM subsets and SP CD8+ TRM subsets of the GSE108989 dataset. (B) The FFPE CRC tumor tissue slides from patients with CRC were stained with DAPI (blue), CD20 (green), CD8 (yellow), CD103 (orange), and CD69 (red). (C) Relationship between the proportion of different CD8+ TRM cells and the proportion of B cells in CRC tumor tissues detected by flow cytometry (n = 40) and relationship between the proportion of different CD8+ TRM cells and the count of B cells and the count and area of TLS in CRC tumor tissues detected by mIHC (n = 64). Statistical analysis was performed by Pearson correlation analysis. (D) Schematic overview of the transwell migration assay design. (E) B cell migration rate when cultured either alone or with different CD8+ TRM subsets (n = 10) and B cell migration rate when cultured with DP CD8+ TRM cells with or without anti-CXCL13 neutralizing antibody (n = 7). Statistical analysis was performed by non-parametric Wilcoxon’s matched-pairs tests and Friedman test with Dunn’s multiple comparisons test. (*p < 0.05; **p < 0.01)
Fig. 7
Fig. 7
Notch and TGF-β signaling pathways synergistically regulate the differentiation of DP CD8+ TRM cells. (A) Dot plot showing the expressions of NOTCH1, NOTCH2, NOTCH3, and NOTCH4 in different CD8+ TRM subsets of the GSE108989 dataset. (B) Expressions of Notch1 and Notch2 of different CD8+ TRM subsets in CRC tumor tissues detected by flow cytometry (n = 20). Statistical analysis was performed by Friedman test with Dunn’s multiple comparisons test. (C) Schematic overview of the in vitro CD8+ T cell activation and inhibition assay design and analytical workflow. (D) Representative dot plot of CD103+ cells of peripheral blood CD8+ T cells incubated in media containing RIN1, TGF-β1, and DLL4 in vitro. (E) Percentages of CD103+ cells of peripheral blood CD8+ T cells incubated with (n = 6) or without (n = 8) RIN1. Statistical analysis was performed by Friedman test with Dunn’s multiple comparisons test. (*p < 0.05; **p < 0.01; ***p < 0.001; ****p < 0.0001; n.s: not significant)
Fig. 8
Fig. 8
Working model of DP CD8+ TRM cells in CRC.

References

    1. Sung H, Ferlay J, Siegel RL, Laversanne M, Soerjomataram I, Jemal A, et al. Global Cancer statistics 2020: GLOBOCAN estimates of incidence and Mortality Worldwide for 36 cancers in 185 countries. CA Cancer J Clin. 2021;71:209–49. - PubMed
    1. Snaebjornsson P, Jonasson L, Olafsdottir EJ, van Grieken NCT, Moller PH, Theodors A, et al. Why is colon cancer survival improving by time? A nationwide survival analysis spanning 35 years. Int J Cancer. 2017;141:531–9. - PubMed
    1. Siegel RL, Miller KD, Jemal A. Cancer statistics, 2020. CA Cancer J Clin. 2020;70:7–30. - PubMed
    1. Yaghoubi N, Soltani A, Ghazvini K, Hassanian SM, Hashemy SI. PD-1/ PD-L1 blockade as a novel treatment for colorectal cancer. Biomed Pharmacother. 2019;110:312–8. - PubMed
    1. Cheon IS, Son YM, Sun J. Tissue-resident memory T cells and lung immunopathology. Immunol Rev. 2023;316:63–83. - PMC - PubMed