. 2024 Dec 18;22(1):290.
doi: 10.1186/s12915-024-02085-8.

Accurate RNA velocity estimation based on multibatch network reveals complex lineage in batch scRNA-seq data

Affiliations

Accurate RNA velocity estimation based on multibatch network reveals complex lineage in batch scRNA-seq data

Zhaoyang Huang et al. BMC Biol. .

Erratum in

Abstract

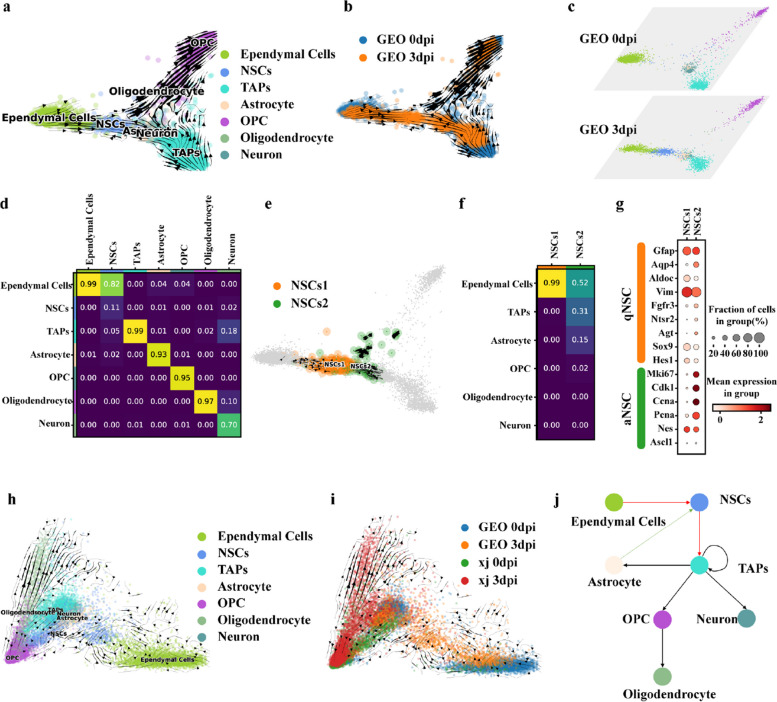
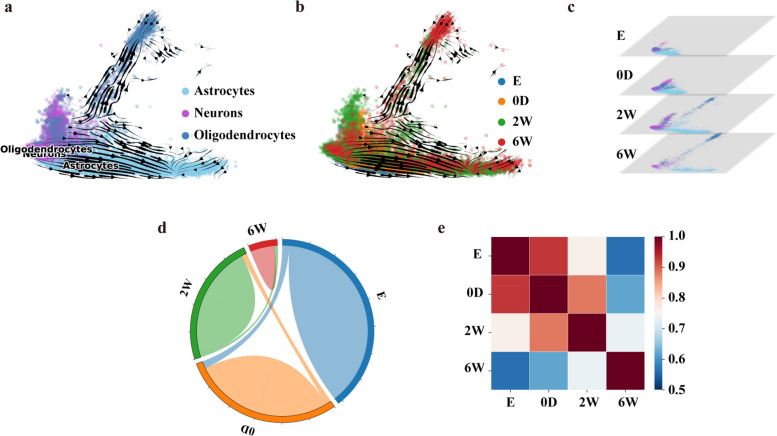
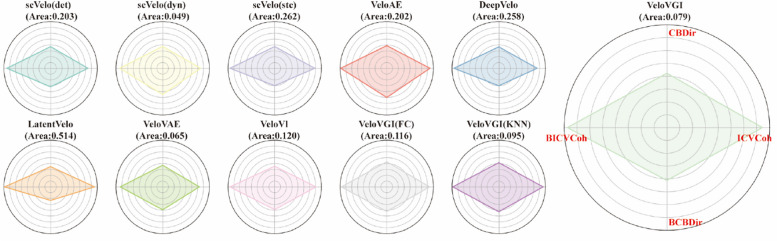
RNA velocity, as an extension of trajectory inference, is an effective method for understanding cell development using single-cell RNA sequencing (scRNA-seq) experiments. However, existing RNA velocity methods are limited by the batch effect because they cannot directly correct for batch effects in the input data, which comprises spliced and unspliced matrices in a proportional relationship. This limitation can lead to an incorrect velocity stream. This paper introduces VeloVGI, which addresses this issue innovatively in two key ways. Firstly, it employs an optimal transport (OT) and mutual nearest neighbor (MNN) approach to construct neighbors in batch data. This strategy overcomes the limitations of existing methods that are affected by the batch effect. Secondly, VeloVGI improves upon VeloVI's velocity estimation by incorporating the graph structure into the encoder for more effective feature extraction. The effectiveness of VeloVGI is demonstrated in various scenarios, including the mouse spinal cord and olfactory bulb tissue, as well as on several public datasets. The results show that VeloVGI outperformed other methods in terms of metric performance.

Keywords: Batch effect; Complex lineage; Optimal transport; RNA velocity; scRNA-seq data.


Conflict of interest statement

Declarations. Ethics approval and consent to participate: Not applicable. Consent for publication: Not applicable. Competing interests: The authors declare no competing interests.

Figures

Fig. 1
Fig. 1
Overview of VeloVGI. a Graph construction of multi-batch network and sampled network in preprocessing. b Variational graph autoencoder (VGAE) structure and velocity estimation. c velocity aggregation for unsampled cells. d a variety of biological application
Fig. 2
Fig. 2
RNA velocity stream plot analysis on neural-related cells of spinal cord injury (SCI) tissue with VeloVGI. a and b show velocity stream with different colors to distinguish cell type and batch. c visualizes the heterogeneity of cell types in different batches by displaying the batches in a hierarchy embedding. d depicts transition probabilities of different cell types across batches from 0 to 3 calculated by Moscot [25]. e displays velocity stream results of NSCs subtyping based on lineage subcluster (detail in the “Methods” section) where the transition probabilities and marker gene bubble plot f, g show the clusters difference. h and i show velocity stream with additional data processed by the same experimental manipulation. j illustrate the known difference in direction among these related cells
Fig. 3
Fig. 3
RNA Velocity stream analysis on immune-related cells of spinal cord injury (SCI) tissue with VeloVGI. a and b show velocity stream with different colors to distinguish cell type and batch. c visualizes the heterogeneity of cell types in different batches by displaying the batches in a hierarchy embedding. d depicts the number of neighbors among different batches, establishing batch-to-batch neighbors in chronological order. e Heatmap illustrating sample correlations between batches
Fig. 4
Fig. 4
RNA Velocity stream analysis on neural system cells of spinal cord injury (SCI) tissue with VeloVGI. a and b show velocity stream with different colors to distinguish cell type and batch. c visualizes the heterogeneity of cell types in different batches by displaying the batches in a hierarchy embedding. d depicts the number of neighbors among different batches, establishing batch-to-batch neighbors in chronological order. e Heatmap illustrating sample correlations between batches
Fig. 5
Fig. 5
Comparison of scVelo(stc) and VeloVGI for RNA velocity analysis. Analysis on dentategyrus (a), mef reprogramming (b), gastrulation (c), and gastrulation erythroid (d). Key parts corrected by VeloVGI are marked with dashed boxes. scVelo(stc) means scVelo with the stochastic
Fig. 6
Fig. 6
CBDir, ICVCoh BCBDir, and BCBDir metric boxplots evaluate the performance of different RNA velocity models through a series of boxplots, which illustrate the distribution of four distinct metrics (CBDir, ICVCoh, BCBDir) across various datasets. Each subplot corresponds to one of the four evaluation metrics, and within each subplot, groups of boxplots are organized to represent individual datasets. Within these dataset-specific groups, boxplots are color-coded to differentiate between the RNA velocity models under comparison. All metrics are normalized to a range from − 1 to 1, with higher values indicating superior model performance
Fig. 7
Fig. 7
Radar chart of all models for the SCI1 dataset. The four directions of the radar chart correspond to four metrics. Each subplot specifies the area covered by the corresponding radar chart showm in the subtitle

Similar articles

Cited by

References

    1. Griffiths JA, Scialdone A, Marioni JC. Using single-cell genomics to understand developmental processes and cell fate decisions. Mol Syst Biol. 2018;14(4): e8046. - PMC - PubMed
    1. Saelens W, Cannoodt R, Todorov H, Saeys Y. A comparison of single-cell trajectory inference methods. Nat Biotechnol. 2019;37(5):547–54. - PubMed
    1. La Manno G, Soldatov R, Zeisel A, Braun E, Hochgerner H, Petukhov V, et al. RNA velocity of single cells. Nature. 2018;560(7719):494–8. - PMC - PubMed
    1. Bergen V, Lange M, Peidli S, Wolf FA, Theis FJ. Generalizing RNA velocity to transient cell states through dynamical modeling. Nat Biotechnol. 2020;38(12):1408–14. - PubMed
    1. Lange M, Bergen V, Klein M, Setty M, Reuter B, Bakhti M, et al. Cell Rank for directed single-cell fate mapping. Nat Methods. 2022;19(2):159–70. - PMC - PubMed

LinkOut - more resources