

Machine learning-based prognostic model of lactylation-related genes for predicting prognosis and immune infiltration in patients with lung adenocarcinoma
- PMID: 39696439
- PMCID: PMC11656871
- DOI: 10.1186/s12935-024-03592-y
Machine learning-based prognostic model of lactylation-related genes for predicting prognosis and immune infiltration in patients with lung adenocarcinoma
Abstract
Background: Histone lactylation is a novel epigenetic modification that is involved in a variety of critical biological regulations. However, the role of lactylation-related genes in lung adenocarcinoma has yet to be investigated.
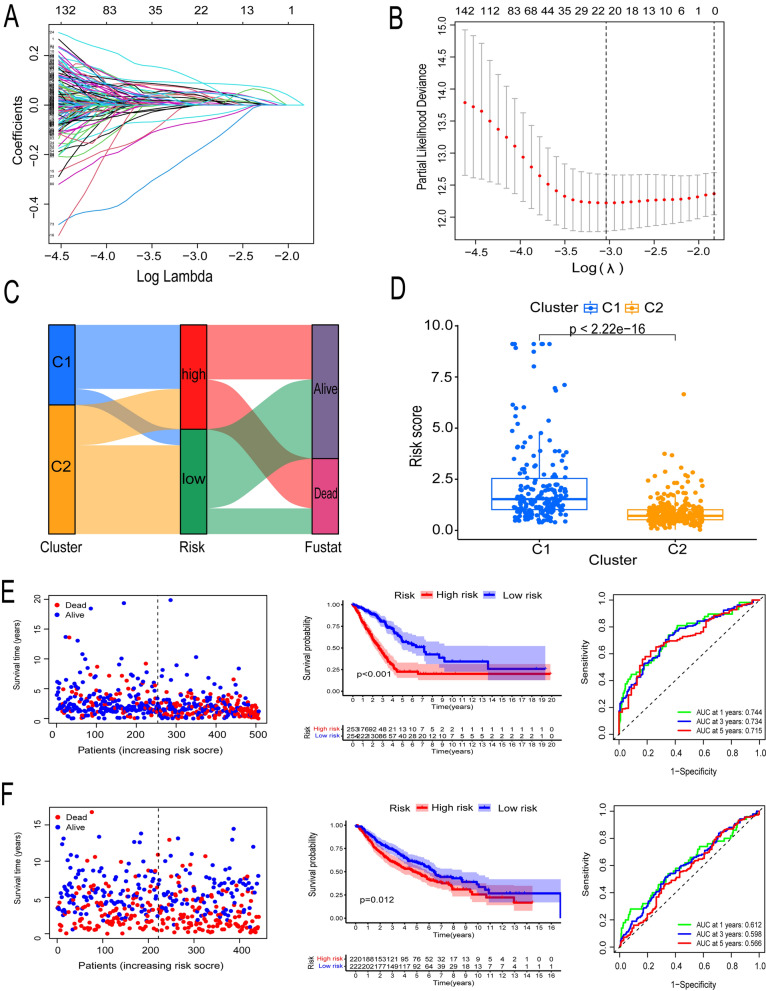
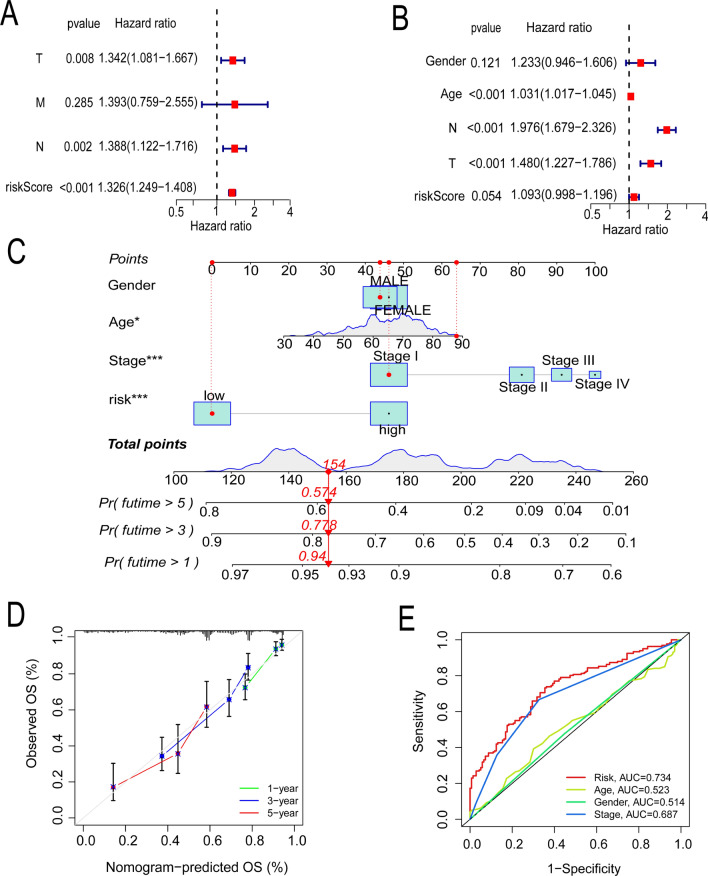
Methods: RNA-seq data and clinical information of LUAD were downloaded from TCGA and GEO datasets. Unsupervised consistent cluster analysis was performed to identify differentially expressed genes (DEGs) between the two clusters, and risk prediction models were constructed by Cox regression analysis and LASSO analysis. Kaplan-Meier (KM) survival analysis, ROC curves and nomograms were used to validate the accuracy of the models. We also explored the differences in risk scores in terms of immune cell infiltration, immune cell function, TMB, TIDE, and anticancer drug sensitivity. In addition, single-cell clustering and trajectory analysis were performed to further understand the significance of lactylation-related genes. We further analyzed lactate content and glucose uptake in lung adenocarcinoma cells and tissues. Changes in LUAD cell function after knockdown of lactate dehydrogenase (LDHA) by CCK-8, colony formation and transwell assays. Finally, we analyzed the expression of KRT81 in LUAD tissues and cell lines using qRT-PCR, WB, and IHC. Changes in KRT81 function in LUAD cells were detected by CCK-8, colony formation, wound healing, transwell, and flow cytometry. A nude mouse xenograft model and a KrasLSL-G12D in situ lung adenocarcinoma mouse model were used to elucidate the role of KRT81 in LUAD.
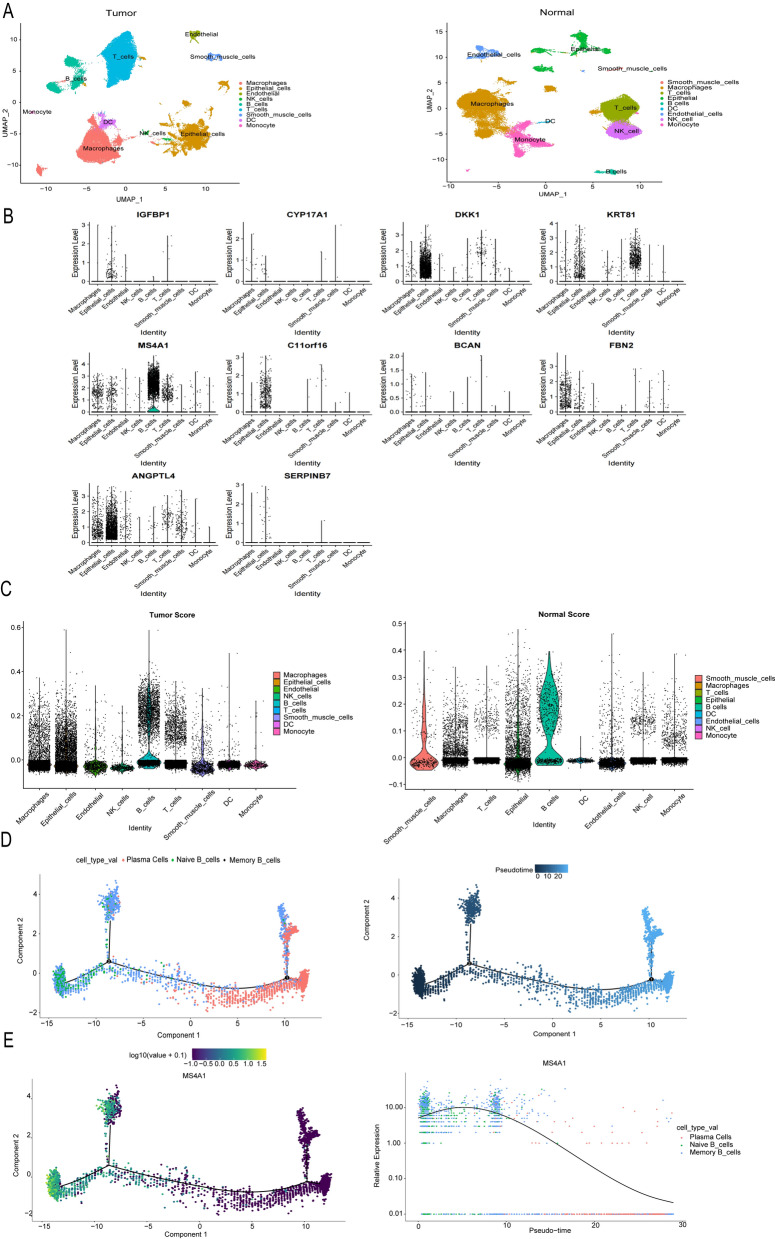
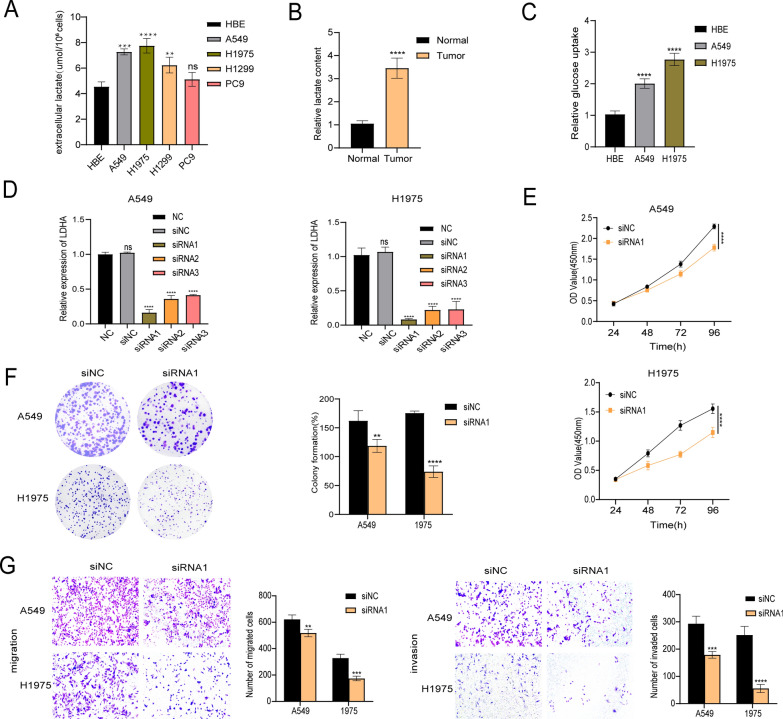
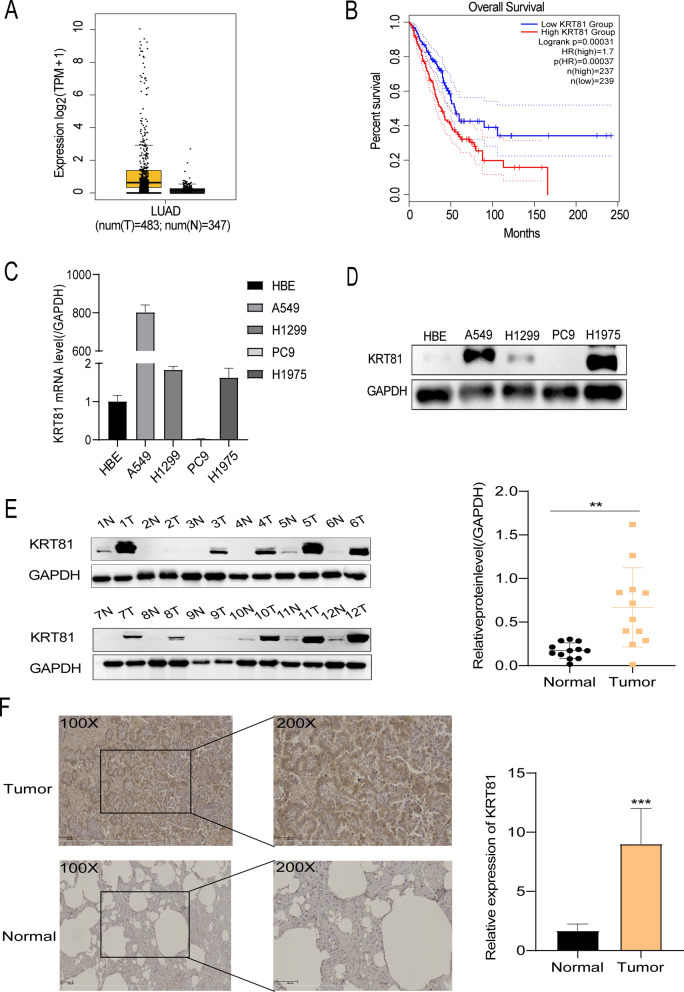
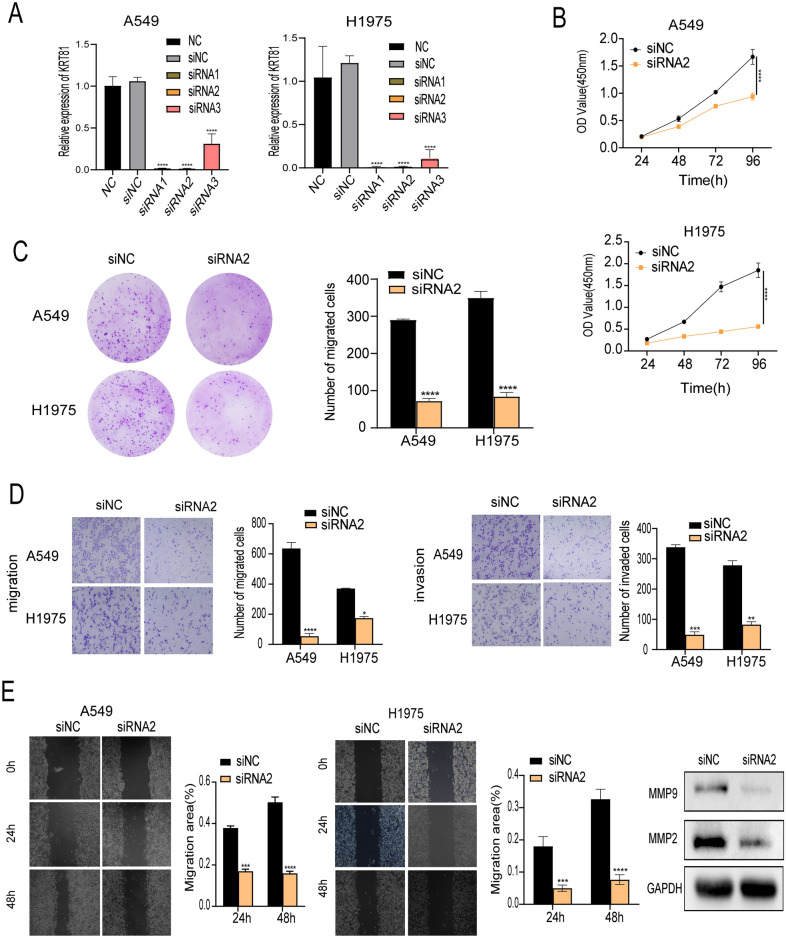
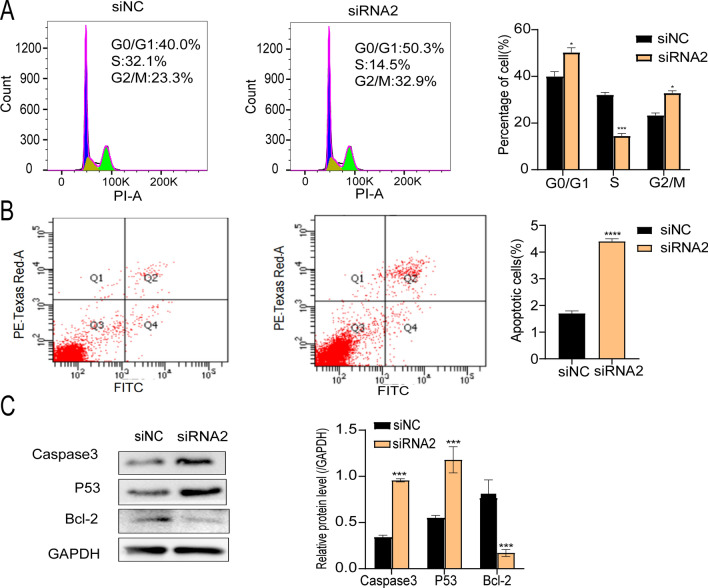
Results: After identifying 26 lactylation-associated DEGs, we constructed 10 lactylation-associated lung adenocarcinoma prognostic models with prognostic value for LUAD patients. A high score indicates a poor prognosis. There were significant differences between the high-risk and low-risk groups in the phenotypes of immune cell infiltration rate, immune cell function, gene mutation frequency, and anticancer drug sensitivity. TMB and TIDE scores were higher in high-risk score patients than in low-risk score patients. MS4A1 was predominantly expressed in B-cell clusters and was identified to play a key role in B-cell differentiation. We further found that lactate content was abnormally elevated in lung adenocarcinoma cells and cancer tissues, and glucose uptake by lung adenocarcinoma cells was significantly increased. Down-regulation of LDHA inhibits tumor cell proliferation, migration and invasion. Finally, we verified that the model gene KRT81 is highly expressed in LUAD tissues and cell lines. Knockdown of KRT81 inhibited cell proliferation, migration, and invasion, leading to cell cycle arrest in the G0/G1 phase and increased apoptosis. KRT81 may play a tumorigenic role in LUAD through the EMT and PI3K/AKT pathways. In vivo, KRT81 knockdown inhibited tumor growth.
Conclusion: We successfully constructed a new prognostic model for lactylation-related genes. Lactate content and glucose uptake are significantly higher in lung adenocarcinoma cells and cancer tissues. In addition, KRT81 was validated at cellular and animal levels as a possible new target for the treatment of LUAD, and this study provides a new perspective for the individualized treatment of LUAD.
Keywords: Immune; KRT81; Lactylation; Lung adenocarcinoma; PI3K-AKT.
© 2024. The Author(s).
Conflict of interest statement
Declarations. Ethics approval and consent to participate: The study was approved by the ethics committee under the Northern Jiangsu People’s Hospital (2021ky012-1). Obtain informed written consent from each patient prior to enrollment. The utilization and program of animals were approved by the Experimental Animal Ethics Committee of Yangzhou University (Ethics number: yzu-lcyxy-s036). All methods are carried out in accordance with relevant guidelines and regulations. The study was conducted in accordance with ARRIVE guidelines. We thank the TCGA and GEO Database for providing the platform and the contributors for uploading their meaningful datasets. Consent for publication: Not applicable. Competing interests: The authors declare no competing interests.
Figures


References
-
- Chen W, Zheng R, Baade PD, Zhang S, Zeng H, Bray F, et al. Cancer statistics in China, 2015. CA. 2016;66(2):115–32. - PubMed
-
- Little AG, Gay EG, Gaspar LE, Stewart AK. National survey of non-small cell lung cancer in the United States: epidemiology, pathology and patterns of care. Lung Cancer (Amsterdam, Netherlands). 2007;57(3):253–60. - PubMed
Grants and funding
- YZ2021078/Yangzhou City Science and Technology Bureau social development-clinical frontier technology project
- YZ2021078/Yangzhou City Science and Technology Bureau social development-clinical frontier technology project
- YZ2021078/Yangzhou City Science and Technology Bureau social development-clinical frontier technology project
- YZ2021078/Yangzhou City Science and Technology Bureau social development-clinical frontier technology project
- YZ2021078/Yangzhou City Science and Technology Bureau social development-clinical frontier technology project
- YZ2021078/Yangzhou City Science and Technology Bureau social development-clinical frontier technology project
- YZ2021078/Yangzhou City Science and Technology Bureau social development-clinical frontier technology project
- LKZ2022019/Jiangsu Provincial Health Commission Elderly Health Research Project
- LKZ2022019/Jiangsu Provincial Health Commission Elderly Health Research Project
- LKZ2022019/Jiangsu Provincial Health Commission Elderly Health Research Project
- LKZ2022019/Jiangsu Provincial Health Commission Elderly Health Research Project
- LKZ2022019/Jiangsu Provincial Health Commission Elderly Health Research Project
- LKZ2022019/Jiangsu Provincial Health Commission Elderly Health Research Project
- LKZ2022019/Jiangsu Provincial Health Commission Elderly Health Research Project
LinkOut - more resources
Full Text Sources
Miscellaneous
