. 2024 Dec 18;22(1):758.
doi: 10.1186/s12951-024-03049-4.

Osteoblastic ferroptosis inhibition by small-molecule promoting GPX4 activation for peri-prosthetic osteolysis therapy

Affiliations

Osteoblastic ferroptosis inhibition by small-molecule promoting GPX4 activation for peri-prosthetic osteolysis therapy

Xin Liu et al. J Nanobiotechnology. .

Abstract

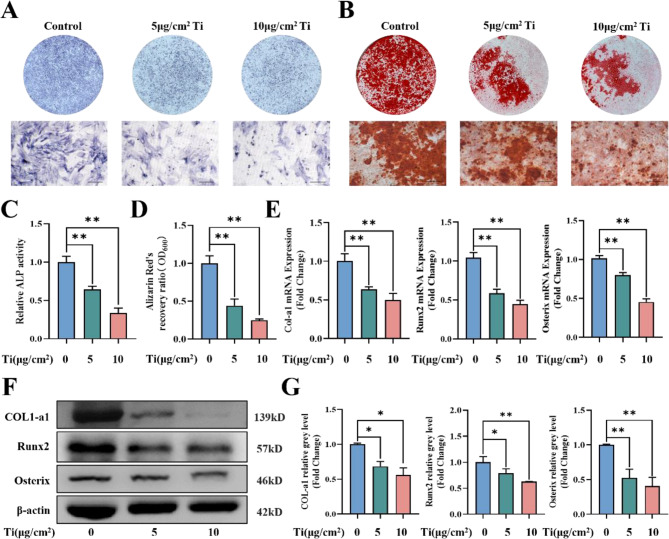
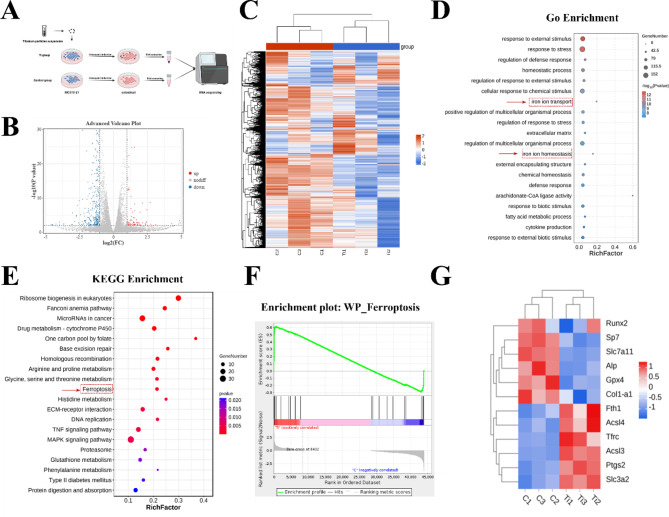
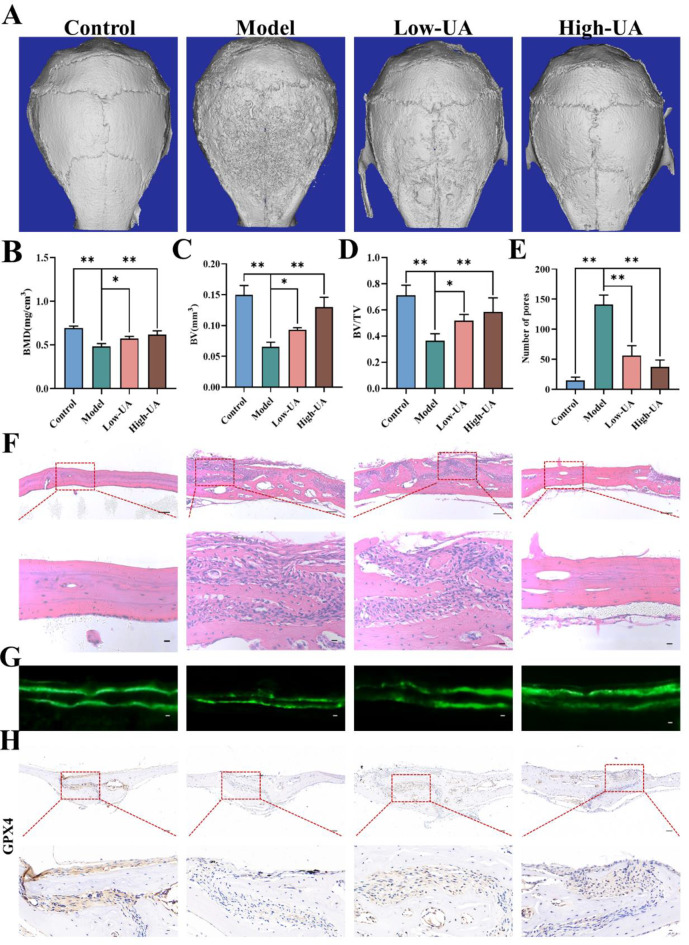
Peri-prosthesis osteolysis (PPO) represents the most severe complication of total joint arthroplasty (TJA) surgery and imposes the primary cause of prosthesis failure and subsequent revision surgery. Antiresorptive therapies are usually prescribed to treat PPO, especially for elderly people. Nevertheless, the efficacy of anti-osteoporotic medications remains constrained. Recent therapeutic strategies to promote periprosthetic osseointegration by restoring osteoblast function are considered more effective approaches. However, the precise mechanism underlying the inhibition of osteogenesis triggered by wear particles remains enigmatic. Herein, we demonstrate that wear particles inhibit osteoblast function by inducing ferroptosis to sabotage extracellular mineralization and arouse periprosthetic osteolysis. The suppression of ferroptosis could significantly rescue osteogenesis thus alleviating PPO. Furthermore, Glutathione Peroxidase 4 (GPX4) has been identified as a key target in regulating osteoblastic ferroptosis. By utilizing virtual screening techniques, we have successfully conducted a comprehensive screening of a natural compound known as Urolithin A (UA), which exhibits remarkable inhibition of osteoblastic ferroptosis while simultaneously promoting the process of osteogenesis through its precise targeting mechanism on GPX4. Meanwhile, UA improves the osteolytic conditions significantly in vivo even when the adjunction of titanium (Ti) nanoparticles. This strategy has great potential in treating peri-prosthesis osteolysis and potentially broadens the scope of clinical therapy.

Keywords: Ferroptosis; GPX4; Osteoblastogenesis; Peri-prosthesis osteolysis; Titanium nanoparticles; Urolithin A.


Conflict of interest statement

Declarations. Ethics approval and consent to participate: Clinical samples were collected with permission of the Ethics Committee of the First Affiliated Hospital of Soochow University. All animal experiments were approved by the Ethics Committee of Soochow University. Consent for publication: All authors agree to be published. Competing interests: The authors declare no competing interests.

Figures

Fig. 1
Fig. 1
Ti nanoparticles suppressed osteogenic differentiation. (A)-(B) Representative images of ALP staining and ARS staining. (scale bar = 100 μm). (C)-(D) Quantitative analysis of relative ALP activity and ARS recovery ratio. (E) The mRNA levels of osteoblast-specific genes with the intervention of Ti nanoparticles. (F) Protein levels of COL1-a1, Runx2 and Osterix. (G) Quantification of osteogenesis-related markers shown in (F). Data are mean ± SD, n = 3; *P < 0.05, **P < 0.01 vs. Control. ns indicates not significant
Fig. 2
Fig. 2
RNA sequencing of osteoblasts under the intervention of Ti nanoparticles. (A) A schematic diagram depicting the experimental design and protocol for sample preparation in RNA sequencing. (B) The volcano plot revealed differentially expressed genes. (C) Heat map depicts genes that were differentially expressed between the Control and Ti groups. Red: upregulated genes. Blue: downregulated genes. (D) Significant pathway of GO Enrichment analysis. (E) KEGG pathway enrichment analysis of the differentially expressed genes. (F) GSEA enrichment plot for the ferroptosis pathway based on RNA sequencing. (G) The heat map revealed the genes significantly regulated in relation to osteogenesis and ferroptosis
Fig. 3
Fig. 3
Ti nanoparticles promote osteoblastic ferroptosis. (A) TEM images of osteoblasts after treatment with Ti nanoparticles (5 and 10 µg/cm2). Scale bar = 5 μm (upper) and 500 nm (lower). (B) Representative images of Ti nanoparticle-induced ROS generation (scale bar = 100 μm), Mitochondrial membrane potential (scale bar: 50 μm) and FerroOrange staining (scale bar = 50 μm) after Ti nanoparticles treatment. (C) The level of MDA. (D) The content of cellular total iron. (E) The mRNA levels of ferroptosis-related genes. (F) Protein levels of 4HNE, COX2, SLC7A11 and GPX4 after the intervention of Ti nanoparticles. (G) Quantification of ferroptosis-related markers in (F). Data are mean ± SD, n = 3; *P < 0.05, **P < 0.01 vs. Control. ns indicates not significant
Fig. 4
Fig. 4
Osteoblastic ferroptosis is involved in peri-prosthesis osteolysis. (A) Protein levels of COL-a1, Runx2 and Osterix in the PTJA and RTJA group. (B) Relative protein quantification of osteogenic markers in (A). (C) Protein levels of COX2, SLC7A11 and GPX4. (D) Relative protein quantification of ferroptosis-related markers in (C). (E) The mRNA levels of osteoblast-specific genes. (F) The mRNA levels of ferroptosis- related genes. (G) The level of MDA. (H) The content of total iron. (I) The content of GSH. Data are mean ± SD, n = 3; *P < 0.05, **P < 0.01 vs. RTJA. ns indicates not significant
Fig. 5
Fig. 5
Suppression of osteoblastic ferroptosis promoted osteogenic differentiation. (A) Protein levels of COX2, SLC7A11 and GPX4 after Ti nanoparticles (10 µg/cm2) and Fer-1 (5µmol/L) treatment. (B) Quantification of ferroptosis-related markers in (A). (C)-(D) Representative images of ALP staining and ARS staining. (scale bar = 100 μm). (E)-(F) Quantitative analysis of relative ALP activity and ARS recovery ratio. (G) Illustrative images of immunofluorescence staining; green (OCN), red (F-actin) and blue (nuclei). (scale bar = 25 μm). Data are mean ± SD, n = 3; *P < 0.05, **P < 0.01 vs. Ti group. ns indicates not significant
Fig. 6
Fig. 6
Fer-1 mitigated Ti nanoparticle-induced osteolysis. The concentration of Ti nanoparticles and Fer-1 in vivo were 40 mg per mouse and 0.1 mg/kg, respectively. (A) Exhibited 3D reconstruction images of Micro CT. (B) BMD (mg/cm3). (C) BV (mm3). (D) BV/TV (%). (E) Number of pores. (F) Representative images of H&E staining. (scale bar = 100 μm and 25 μm). (G) Calcein double labelling. (scale bar = 25 μm). (H) Immunohistochemical analysis of GPX4 protein. (scale bar = 100 μm and 25 μm). Data are mean ± SD, n = 5; *P < 0.05, **P < 0.01 vs. Ti group. ns indicates not significant
Fig. 7
Fig. 7
Identification of natural small molecules targeting GPX4 to suppress ferroptosis. (A) The active site of the GPX4 protein. (B) Screening by GPX4 protein to obtain a 2D map of urolithin A small molecules and forces of action. (C) The binding mode of GPX4 with UA. H-bond (yellow): ASP-21 (2.2 Å), PHE-100 (3.1 Å), VAL-98 (3.2 Å), LYS-90 (2.1 Å). (D) Cellular thermal shift assay between UA and GPX4. (E) The levels of GPX4 protein under different temperatures in the presence of UA and DMSO treatment. (F) Representative TEM images of osteoblasts after UA treatment. Scale bar = 5 μm (upper) and 500 nm (lower). (G) The content of MDA. (H) Representative images of Ti nanoparticles-induced ROS generation (scale bar = 100 μm), Mitochondrial membrane potential (scale bar = 50 μm) and FerroOrange staining (scale bar = 50 μm) after UA treatment. (I) The content of cellular total iron. (J) Protein levels of COX2, SLC7A11, GPX4. (K) The mRNA levels of ferroptosis-related genes. Data are mean ± SD, n = 3; *P < 0.05, **P < 0.01 vs. Ti group. ns indicates not significant
Fig. 8
Fig. 8
Silencing GPX4 reversed UA inhibition of ferroptosis. (A) The mRNA level of Gpx4 after GPX4 silence. (B) The mRNA levels of ferroptosis-specific genes after GPX4 silence in each group. (C) Protein levels of COX2, SLC7A11 and GPX4 after GPX4 silence. (D) Quantification of ferroptosis-related markers shown in (C). Data are mean ± SD, n = 3; *P < 0.05, **P < 0.01 vs. Ti + siGPX4 group. ns indicates not significant
Fig. 9
Fig. 9
UA promoted osteoblast differentiation by the activation of GPX4. (A)-(B) Representative images of ALP and ARS staining during Ti nanoparticles and UA treatment. (scale bar = 100 μm). (C)-(D) Quantitative analysis of ALP activity and ARS recovery ratio. (E) The mRNA levels of osteogenesis-related gene after UA treatment. (F) Protein levels of COL-a1, Runx2 and Osterix. (G) Quantification of osteogenic markers shown in (F). (H) Cellular immunofluorescence of OCN. (scale bar = 25 μm). Data are mean ± SD, n = 3; *P < 0.05, **P < 0.01 vs. Ti group. ns indicates not significant. (I)-(J) Representative images of ALP and ARS staining after GPX4 silence. (scale bar = 100 μm). (K)-(L) Quantitative analysis of ALP activity and ARS recovery ratio. Data are mean ± SD, n = 3; *P < 0.05, **P < 0.01 vs. Ti + UA + siGPX4 group. ns indicates not significant
Fig. 10
Fig. 10
UA attenuated Ti nanoparticle-induced osteolysis. (A) Representative 3D reconstruction images of micro-CT. (B) BMD (mg/cm3). (C) BV (mm3). (D) BV/TV (%). (E) Number of pores. (F) Representative images of H&E staining. (scale bar = 100 μm and 50 μm). (G) Calcein double labelling. (scale bar = 25 μm). (H) Immunohistochemical analysis of GPX4 protein. (scale bar = 100 μm and 50 μm). Data are mean ± SD, n = 5; *P < 0.05, **P < 0.01 vs. Ti group. ns indicates not significant

Similar articles

References

    1. Singh JA, Yu S, Chen L, Cleveland JD. Rates of total joint replacement in the United States: future projections to 2020–2040 using the National Inpatient Sample. J Rheumatol. 2019;46(9):1134–40. - PubMed
    1. Goodman SB, Gallo J. Periprosthetic Osteolysis: mechanisms, Prevention and Treatment. J Clin Med. 2019;8(12). - PMC - PubMed
    1. Quicke JG, Conaghan PG, Corp N, Peat G. Osteoarthritis year in review 2021: epidemiology & therapy. Osteoarthritis Cartilage. 2022;30(2):196–206. - PubMed
    1. Qiu J, Peng P, Xin M, Wen Z, Chen Z, Lin S, et al. ZBTB20-mediated titanium particle-induced peri-implant osteolysis by promoting macrophage inflammatory responses. Biomater Sci. 2020;8(11):3147–63. - PubMed
    1. Li Y, Lin S, Liu P, Huang J, Qiu J, Wen Z, et al. Carnosol suppresses RANKL-induced osteoclastogenesis and attenuates titanium particles-induced osteolysis. J Cell Physiol. 2021;236(3):1950–66. - PubMed

Substances

LinkOut - more resources