. 2024 Dec 18;22(1):759.
doi: 10.1186/s12951-024-03001-6.

Sparstolonin B potentiates the antitumor activity of nanovesicle-loaded drugs by suppressing the phagocytosis of macrophages in vivo

Affiliations

Sparstolonin B potentiates the antitumor activity of nanovesicle-loaded drugs by suppressing the phagocytosis of macrophages in vivo

Yuefeng Zhang et al. J Nanobiotechnology. .

Abstract

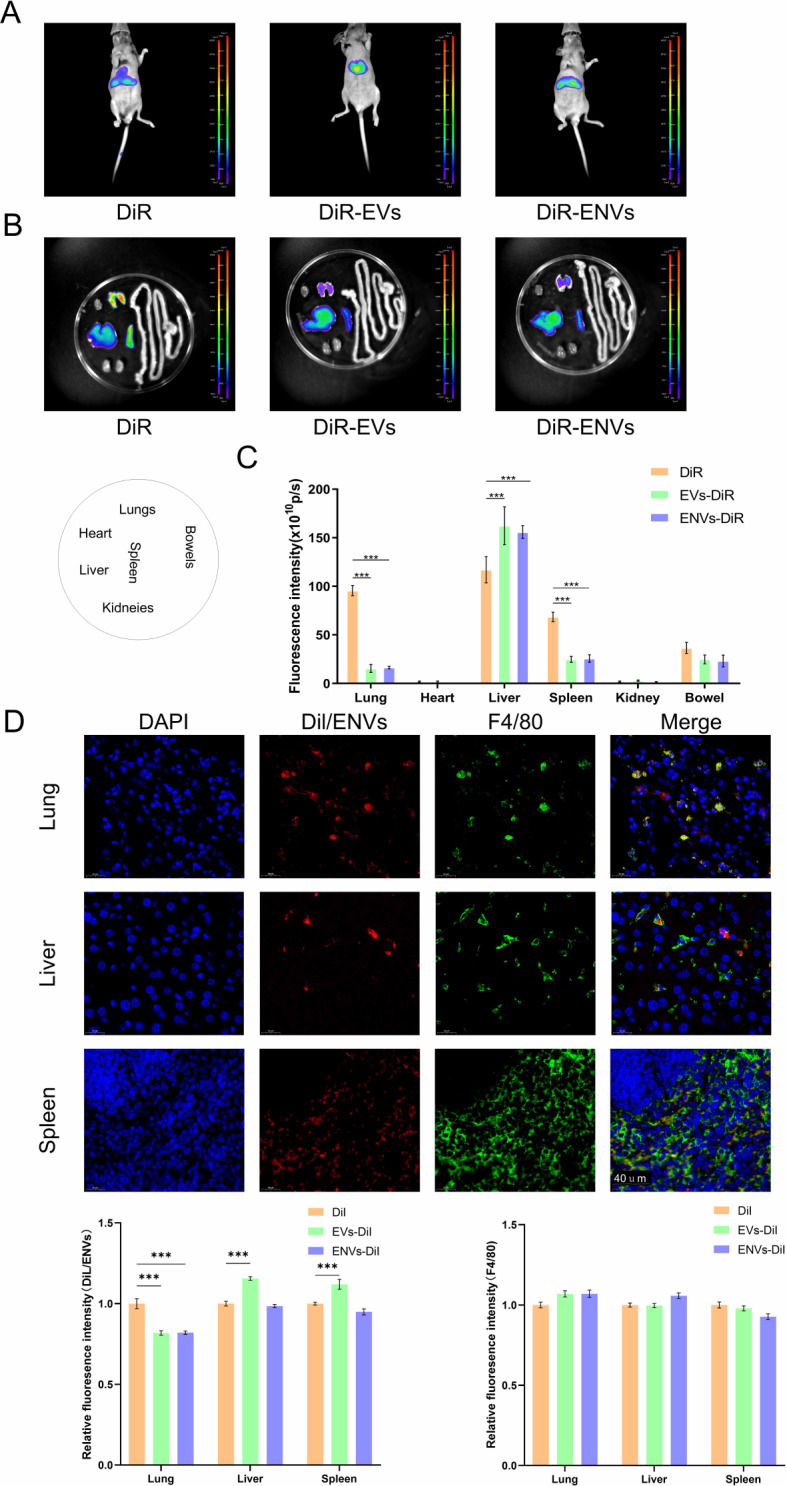
Background: Extracellular vesicles (EVs) and extruded nanovesicles (ENVs) are promising nanovesicles (NVs) for drug delivery. However, the application of these NVs is strongly hindered by their short half-life in the circulation. Macrophages (Mφs) in the liver and spleen contribute to the rapid depletion of NVs, but the underlying mechanism is unclear.

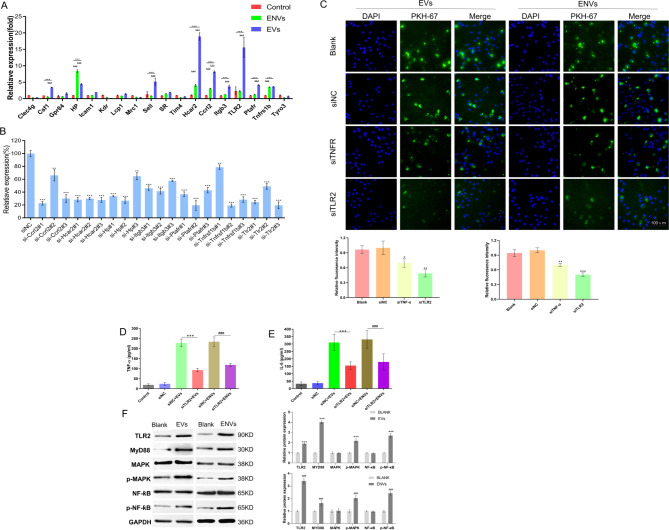
Methods: By collecting the supernatant of PANC-1 cells and squeezing PANC-1 cells, EVs and ENVs derived from PANC-1 cells were prepared via ultracentrifugation. NVs were subsequently identified via western blot, particle size measurement, and electron microscopy. The distribution of NVs in mouse bodies was observed with a live animal imaging system. Liver Mφs were extracted and isolated after NVs were administered, and transcriptome profiling was applied to determine differentially expressed genes (DEGs). siRNAs targeting interested genes were designed and synthesized. In vitro experiments, Mφs were transfected with siRNA or treated with the corresponding inhibitor, after which NV uptake was recorded. Doxorubicin (DOX) was encapsulated in ENVs using an ultrasound method. PANC-1 cell-derived tumors were established in nude mice in vivo, inhibitor pretreatment or no treatment was administered before intravenous injection of ENVs-DOX, and the therapeutic efficacy of ENVs-DOX was evaluated.

Results: NVs derived from PANC-1 cells were first prepared and identified. After intravenous injection, most NVs were engulfed by Mφs in the liver and spleen. Seven genes of interest were selected via transcriptome sequencing and validated via RT‒PCR. These results confirmed that the TLR2 signaling pathway is responsible for phagocytosis. siTLR2 and its inhibitor sparstolonin B (SpB) significantly inhibited the internalization of NVs by Mφs and downregulated the activity of the TLR2 pathway. The accumulation of ENVs-DOX in the liver was inhibited in vivo by pretreatment with SpB 40 min before intravenous injection, ultimately delaying tumor progression.

Conclusion: The TLR2 pathway plays a crucial role in the sequestration of NVs by Mφs. A novel antiphagocytic strategy in which pretreatment of mice with SpB inhibits the clearance of NVs and prolongs their half-life in vivo, thereby improving delivery efficiency, was identified.

Keywords: Drug delivery; Macrophages; Nanovesicles; Phagocytosis; Toll-like receptor 2.


Conflict of interest statement

Declarations. Ethics approval and consent to participate: All experimental designs and protocols involving animals were approved by the Laboratory Animal Welfare and Ethics Committee of Renmin Hospital of Wuhan University. All procedures were conducted in accordance with the Declaration of Helsinki and standard guidelines. Consent for publication: Not applicable. Competing interests: The authors declare no competing interests.

Figures

Fig. 1
Fig. 1
Preparation and characterization of extracellular vesicles (EVs) and extruded nanovesicles (ENVs). (A) Flow diagrams of the differential ultracentrifugation procedures for the isolation of EVs (up) and ENVs (down). (B) Transmission electron microscopy images of EVs and ENVs (68000×). The scale bar is 200 nm. (C) western blot analysis of the classical EV biomarker proteins CD81, Alix and Tsg101; β-actin is a negative marker. (D) The size distributions of EVs and ENVs were determined via dynamic light scattering (DLS) analysis, respectively. (E) The yields of EVs and ENVs derived from 1 × 107 PANC-1 cells (*** p < 0.001)
Fig. 2
Fig. 2
Body distribution of EVs and ENVs. (A) DiR solution (1 µl stock solution was diluted to 100 µl), DiR-labeled EVs and DiR-labeled ENVs (100 µg/100 µl) were injected into nude mice via the caudal vein, respectively (n = 3 each group). After 1 h of intravenous administration, the mice were subjected to live imaging scanning with a NightOWL II Imaging System. The fluorescence signals indicate the body distribution of free DiR (left), DiR-labeled EVs (middle) and DiR-labeled ENVs (right). (B & C) 4 h after injection, the mice were sacrificed, and representative images of various organs, including the bowels, liver, lung, spleen, kidney, and heart, were obtained (C). The fluorescence intensity of each organ was measured via IndiGO™ software (*p < 0.05, **p < 0.01, *** p < 0.001). (D) The representative immunofluorescence images of ENVs group. DiI-labeled EVs and DiI-labeled ENVs (100 µg/100 µl) were injected into nude mice via the caudal vein, respectively (n = 3 each group). The mice were euthanized 4 h later, livers, spleens and lungs were harvested. Frozen liver, spleen and lung sections were stained with F4/80 antibodies. F4/80 (green, he excitation filter/emission filter = 475 ~ 490/505 ~ 535 nm) was used to indicate macrophages, and the red signals (he excitation filter/emission filter = 560 ~ 580/600 ~ 650 nm) indicate free DiI or DiI-labeled NVs. The scale bar represents 40 μm. The images of other groups could be found in Figure S1 (*** p < 0.001)
Fig. 3
Fig. 3
Transcriptome sequencing was performed to identify differentially expressed genes (DEGs) and the biological pathways involved in the phagocytosis of nanovesicles (NVs, including EVs and ENVs). Mice were treated with PBS, EVs or ENVs (n = 3). After 4 h, liver macrophages (Mφs) were isolated and subjected to transcriptome analysis. (A) Statistics of the DEGs; the red column represents the number of upregulated genes, and the green column indicates the number of downregulated genes. (B) Venn diagrams showing the number of genes that were commonly and uniquely changed. (C) Heatmap of more than 1500 annotated genes expressed in liver Mφs after stimulation with PBS or NVs (Table S2). The upregulated mRNAs in the treated group with respect to those in the control group are represented in red, and the downregulated mRNAs are presented in blue. (D) KEGG pathway enrichment analysis of the DEGs. (E-G) Gene Ontology analysis. Gene Ontology analysis of the downregulated and upregulated biological processes (E), cellular components (F) and molecular functions (G) related to the DEGs
Fig. 4
Fig. 4
The TLR2 signaling pathway was demonstrated to be involved in the phagocytosis of NVs by Mφs. (A) Eighteen genes of interest were selected from the prominent pathways that were detected via KEGG analysis, and their expression levels were validated via qRT‒PCR. GAPDH served as an endogenous control. A total of 7/18 candidate genes were more highly expressed in the Mφs treated with NVs than that in the control (*** p < 0.001). (B) Three siRNAs were designed for each of the 7 DEGs, and the silencing efficiency was verified via qRT‒PCR. The most efficient siRNAs were selected for the subsequent experiments (*p < 0.05, **p < 0.01, *** p < 0.001). (C) siTLR2 significantly inhibited the uptake of NVs by liver Mφs. Mφs were transfected with the 7 different siRNAs or siNC and then treated with PKH67-labeled EVs or ENVs, after which the engulfment of NVs was observed. Compared with siNC and other siRNAs, siTNF-α and siTLR2 displayed suppressive effect, and the other siRNAs failed to suppress phagocytosis; these results are not presented. The scale bar represents 100 μm (*p < 0.05, **p < 0.01, *** p < 0.001). (D & E) siTLR2 downregulated the secretion of IL-6 (D) and TNF-α (E) by Mφs. The IL-6 and TNF-α levels in the medium of the Mφs mentioned in (C) were examined via ELISA (*** or ### p < 0.001). (F) Exposure to NVs activated the TLR2/MAPK/NF-κB pathway in liver Mφs. Isolated Mφs were stimulated with 40 µg of EVs or ENVs for 4 h. Then, proteins were extracted for western blot analysis (*** or ### p < 0.001)
Fig. 5
Fig. 5
Pretreatment with SpB significantly blocked the uptake of NVs by Mφs in vitro. Liver Mφs were treated with SpB (200 nM) or oil/DMSO for 30 min and then cultured with EVs or ENVs for 4 h. The untreated the Mφs were served as control group. (A) SpB significantly blocked the uptake of PKH67-labeled NVs by liver Mφs. The scale bar represents 100 μm (*p < 0.05, **p < 0.01, *** p < 0.001). (B & C) SpB strongly suppressed the secretion of IL-6 (B) and TNF-α (C) by liver Mφs (*** or ### p < 0.001). (D) SpB markedly inhibited the activation of the TLR2/MAPK/NF-κB pathway by liver Mφs (** or ## p < 0.01, *** or ### p < 0.001)
Fig. 6
Fig. 6
The combination of doxorubicin (DOX) and ENVs generated enhanced antitumor effects in vitro. (A) Process diagram for the preparation of ENVs-DOX. DOX was encapsulated in ENVs via an ultrasound method. (B) 500 µg ENVs were incubated with different concentration of DOX, the loading efficiency of DOX were determined (*** p < 0.001). (C) DOX was released in vitro in PBS at pH 5.0 and 7.4(*** p < 0.001). (D) Hydrodynamic size distribution of ENVs after DOX loading. (E) The passive uptake of free DOX, ENVs and ENVs-DOX by PANC-1 cells. The scale bar represents 100 μm. In order to observe the DOX signal, the excitation filter/emission filter = 475 ~ 490/580 ~ 620 nm, for the PKH-67 signal, the excitation filter/emission filter = 475 ~ 490/505 ~ 535 nm (*** p < 0.001). (F) Cell viability was determined with a CCK-8 assay. PANC-1 cells were treated with different concentrations of DOX, ENVs or ENVs-DOX (n = 5, ***p < 0.001)
Fig. 7
Fig. 7
Antitumor efficacy of ENVs-DOX in vivo. (A) Schematic illustration of the tumor model establishment and therapeutic process of ENVs-DOX. Group information: (1) oil/DMSO + PBS as a control; (2) oil/DMSO + free DOX; (3) SpB + PBS; (4) oil/DMSO + blank ENVs; (5) oil/DMSO + ENVs-DOX; (6) SpB + ENVs-DOX. 200 µl oil/DMSO or SpB solution was administered through intraperitoneal injection; 40 min later, blank ENVs, DOX or ENVs-DOX were injected via the caudal vein. (B & C) SpB inhibited the non-targeted aggregation of ENVs-DOX (DiR-labeled) in vivo. Tumor-bearing nude mice (n = 3) were pretreated with or without SpB and injected with ENVs-DOX; then, the mice were subjected to live imaging at different time points (*p < 0.05, **p < 0.01, *** p < 0.001). (D & E) SpB promoted the accumulation of ENVs-DOX (DiR-labeled) in tumors. 6 h after injection of DiR/ENVs-DOX, those mice were sacrificed and the enriched DiR signals in the mice mentioned in (B) were detected (*p < 0.05, **p < 0.01, *** p < 0.001). (F) Body weight curves and tumor volume growth curves (G) of the mice (n = 5) (*p < 0.05). (H) Photographs of excised tumors from the mice in each group. Scale: 1 unit = 1 cm (*p < 0.05, **p < 0.01, *** p < 0.001)
Fig. 8
Fig. 8
Evaluating the systemic toxicity of SpB and ENVs-DOX. (A) The histological Sect. (40×) of the organs (liver, spleen, kidney and heart) from the control, SpB and SpB + ENVs-DOX treated groups. Scale bar is 40 μm. The H-E staining of the organs from other groups could be seen in Figure S5. Arrows indicate areas of vacuolization. (B) The test results of CRE, ALT and CK-MB from different groups (n = 5). Statistically analysis was performed using student’s t test and compared to the control group (*p < 0.05, **p < 0.01). (C) F4/80staining of the organs (lung, liver and spleen, 40×) from the control and SpB treated groups. Macrophages were stained with F4/80-specific antibodies (Brown). Scale bar is 40 μm. (D) Serum levels of LPS treated with control and SpB treated groups (n = 5). Data are presented as mean ± SD. No significant difference was found

Similar articles

References

    1. Wu P, Zhang B, Ocansey DKW, Xu W, Qian H. Extracellular vesicles: a bright star of nanomedicine. Biomaterials. 2021;269:120467. 10.1016/j.biomaterials.2020.120467. - PubMed
    1. Tarasov VV, Svistunov AA, Chubarev VN, et al. Extracellular vesicles in cancer nanomedicine. Sem Cancer Biol. 2021;69:212–25. 10.1016/j.semcancer.2019.08.017. - PubMed
    1. Ghadami S, Dellinger K. The lipid composition of extracellular vesicles: applications in diagnostics and therapeutic delivery. Front Mol Biosci. 2023;10:1198044. 10.3389/fmolb.2023.1198044. - PMC - PubMed
    1. Du R, Wang C, Zhu L, Yang Y. Extracellular vesicles as Delivery vehicles for therapeutic nucleic acids in Cancer Gene Therapy: Progress and challenges. Pharmaceutics. 2022;14(10):2236. 10.3390/pharmaceutics14102236. - PMC - PubMed
    1. Li J. A comprehensive review on the composition, biogenesis, purification, and multifunctional role of exosome as delivery vehicles for cancer therapy. Published online 2023. - PubMed

LinkOut - more resources