

High-intensity interval training or lactate administration combined with aerobic training enhances visceral fat loss while promoting VMH neuroplasticity in female rats
- PMID: 39696579
- PMCID: PMC11653782
- DOI: 10.1186/s12944-024-02397-2
High-intensity interval training or lactate administration combined with aerobic training enhances visceral fat loss while promoting VMH neuroplasticity in female rats
Abstract
Background: High-intensity interval training (HIT) does not burn fat during exercise. However, it significantly reduces visceral adipose after long-term training. The underlying mechanism may be related to the elevation of fat consumption during the post-exercise recovery period, which is regulated by the hypothalamus-adipose axis. Lactate is a hallmark metabolite of high-intensity exercise, which could mediate significant neuroplasticity through the brain-derived neurotrophic factor (BDNF) pathway. However, whether HIT could enhance hypothalamus activity and adipose catabolism in the recovery period remains to be elucidated. Also, it is worth exploring whether adding lactate administration to prolonged, continuous submaximal aerobic training (AT) could simulate HIT-induced neuroplastic effects and fat loss.
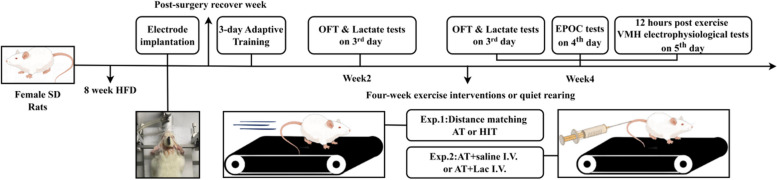
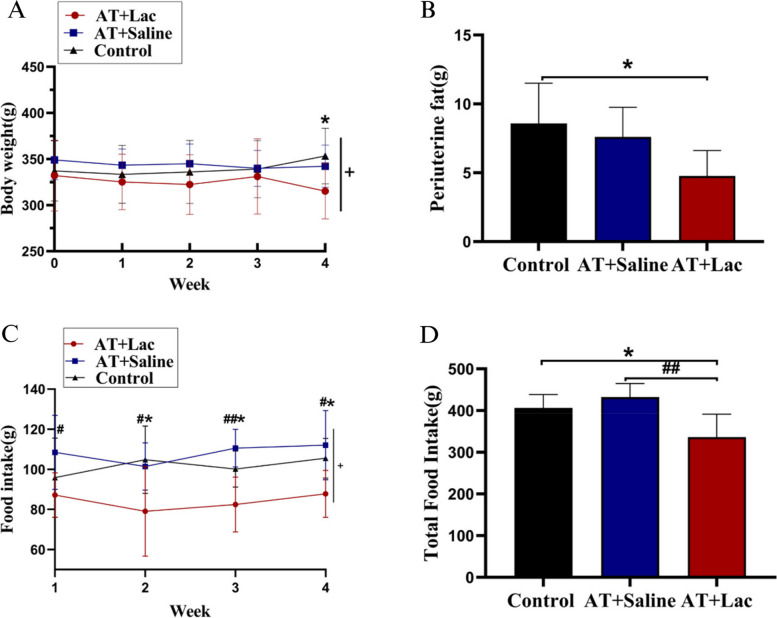
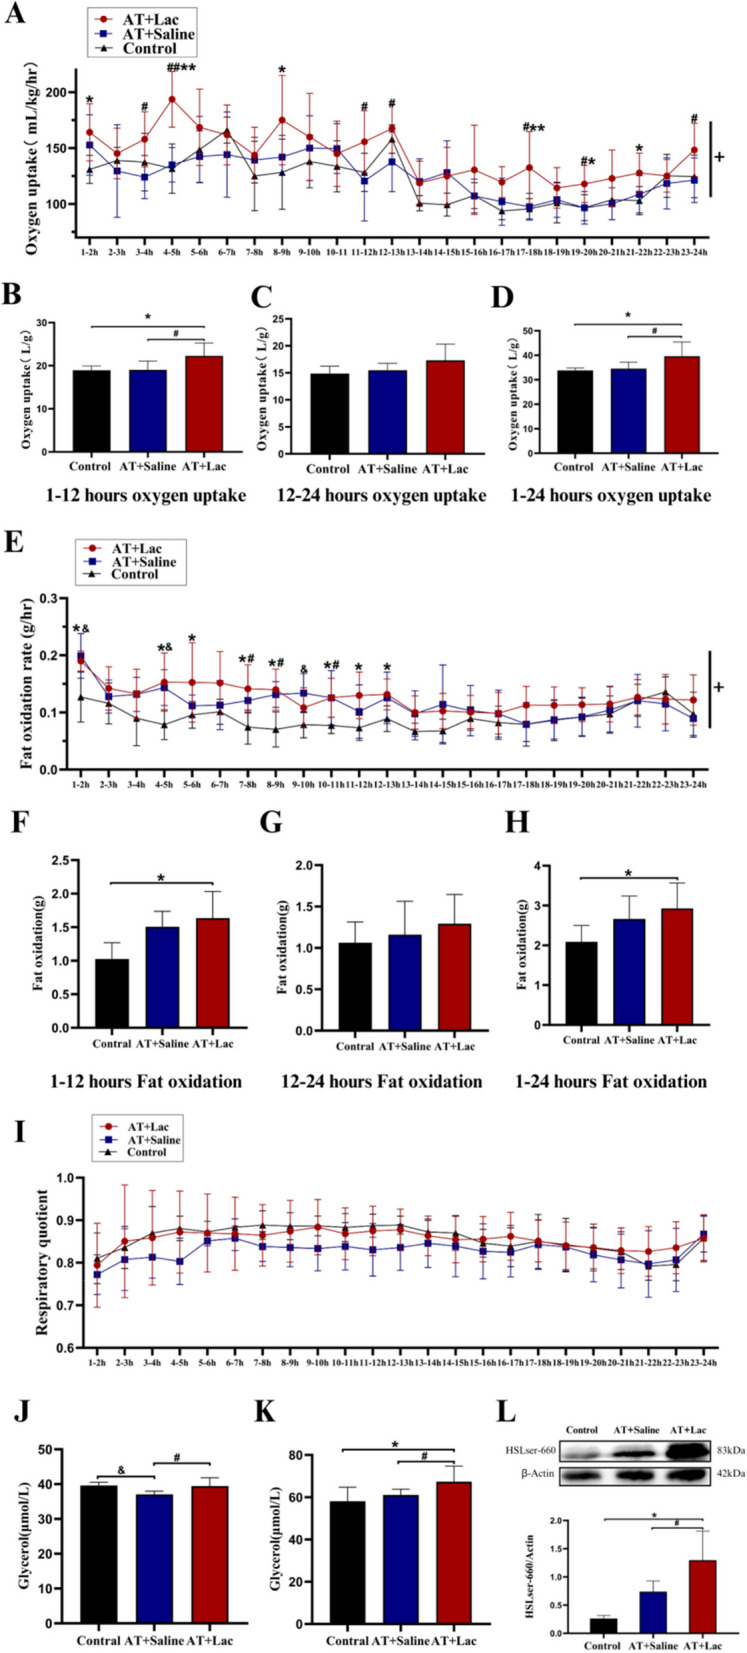
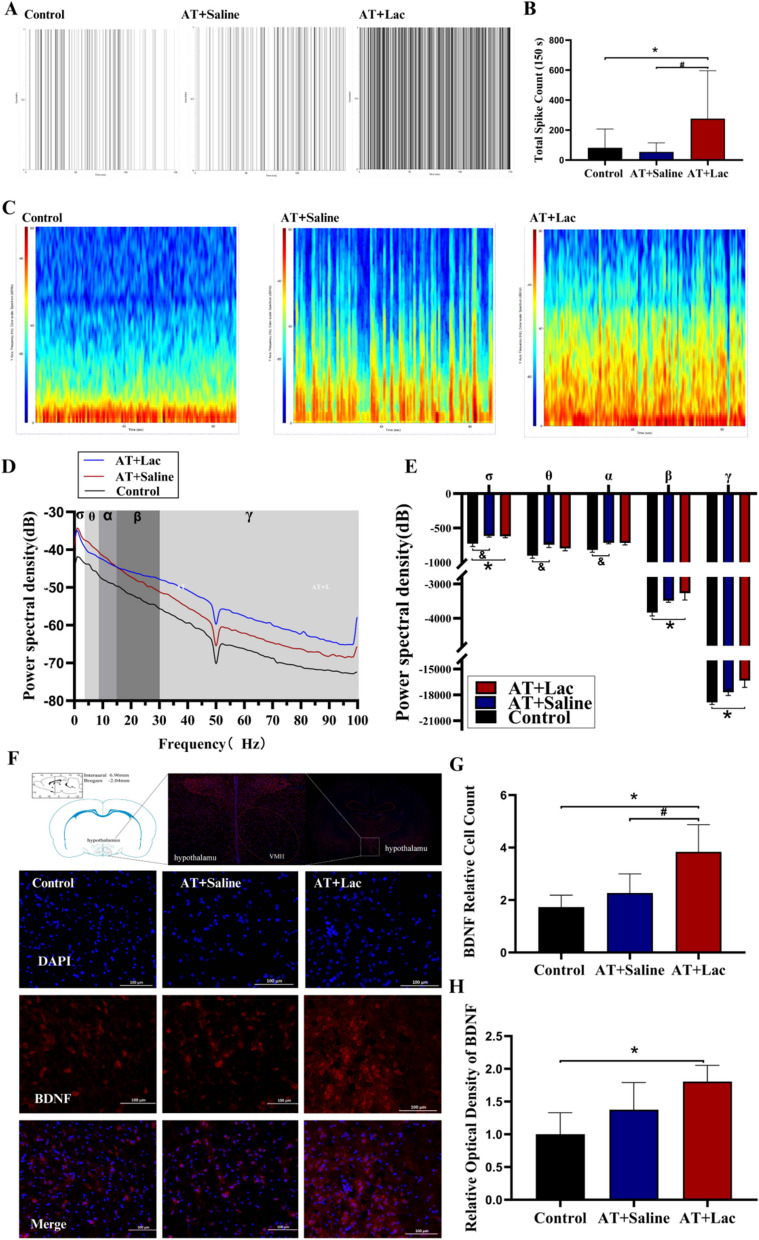
Methods: First, we compared the influence of 4-week HIT and aerobic training (AT) on the electrophysiology of the ventromedial hypothalamus (VMH), which is deeply involved in the regulation of lipolysis, as well as the 24-hour excess post-exercise oxygen consumption (EPOC), the fat oxidation rate and lipolysis. To further confirm whether excess lactate during AT could reproduce the effect of HIT, we also observed the effects of lactate infusion during AT (AT + Lac) on neuroplasticity and metabolism.
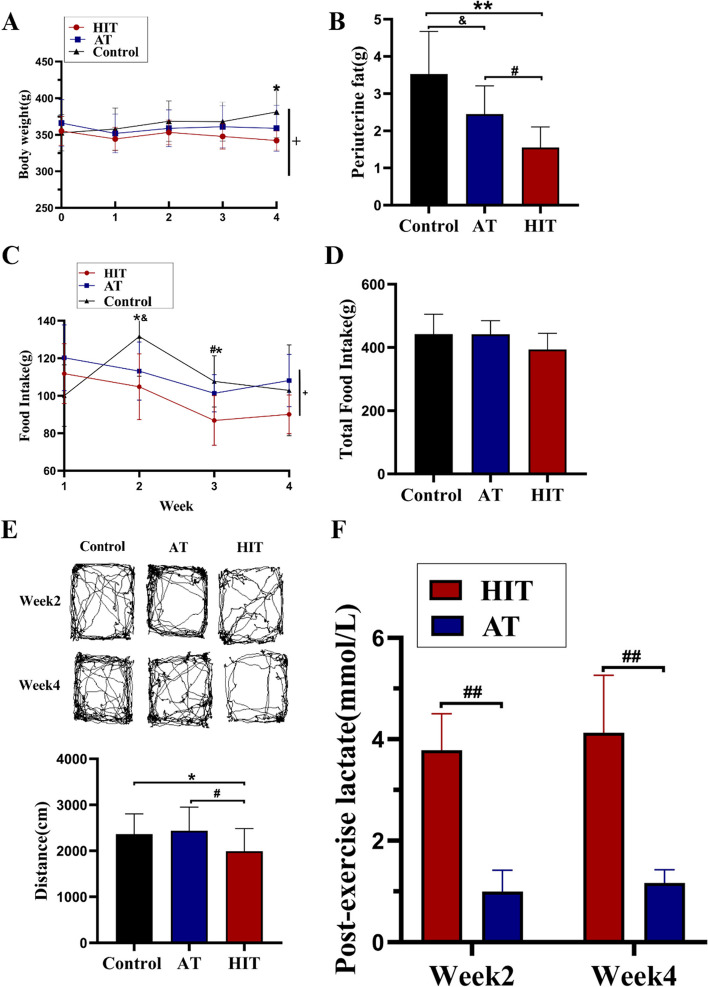
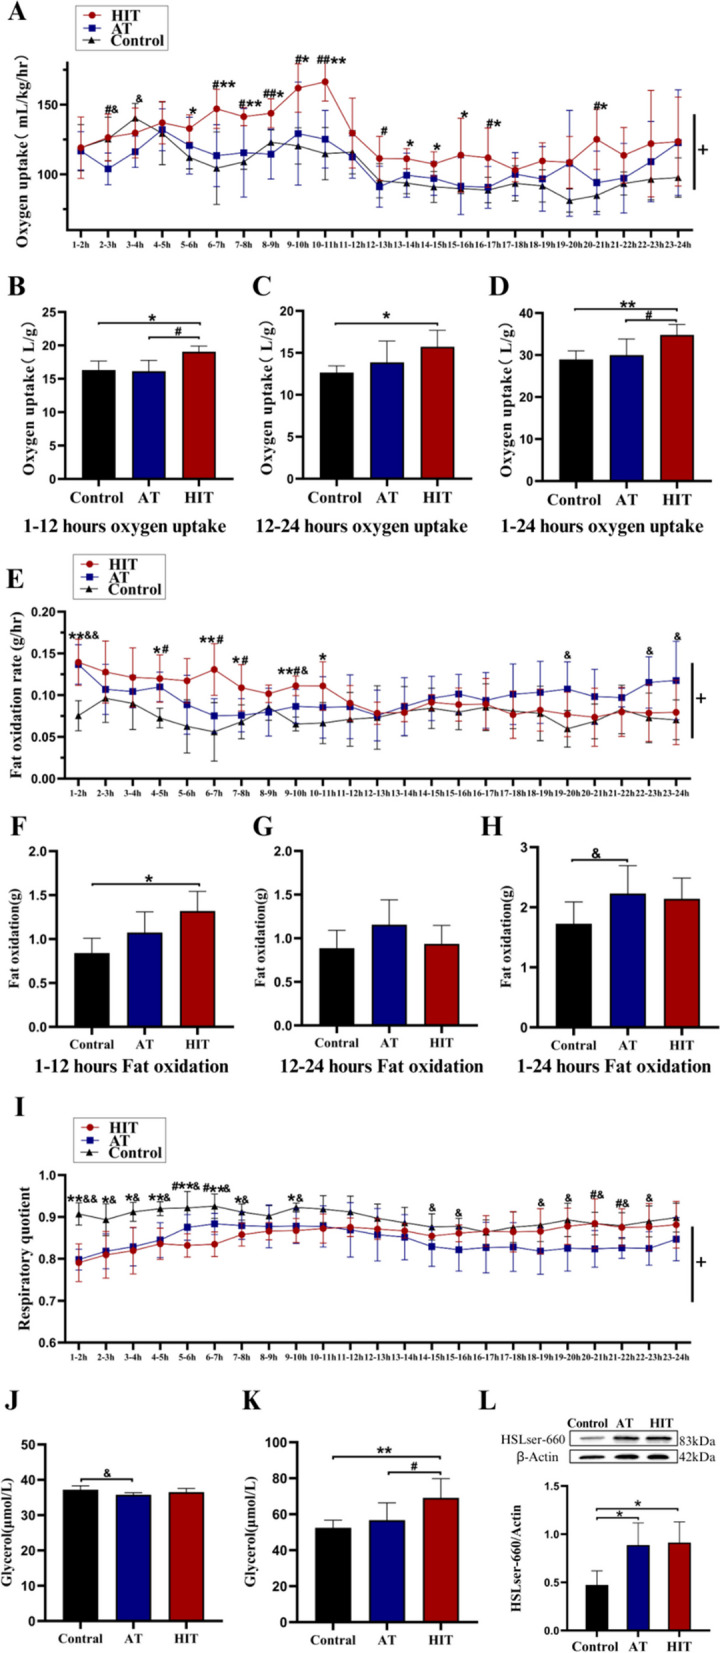
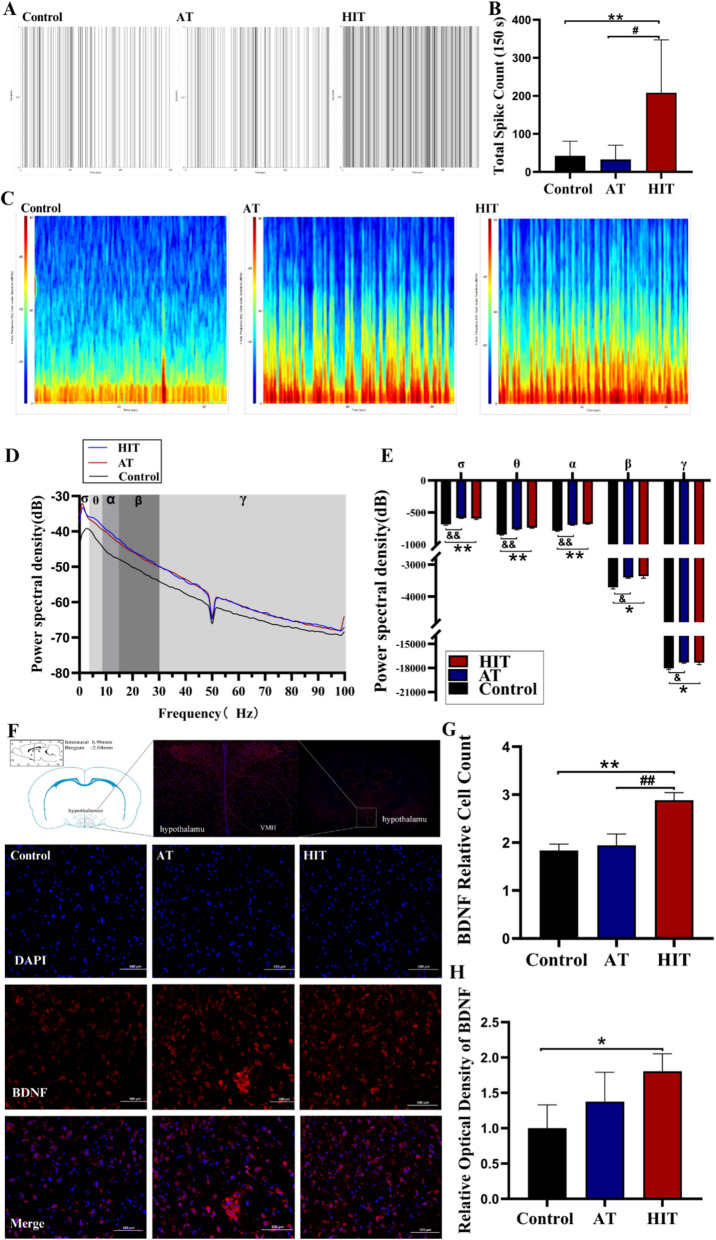
Results: Four-week HIT induced higher BDNF expression and a higher neuronal spike firing rate in VMH than AT, accompanied by elevated EPOC, fat oxidation and visceral fat lipolysis. AT + Lac and HITT could induce similar hypothalamic and metabolic changes. However, power spectral density analysis of local field potentials (LFPs) showed that the AT + Lac group was affected in fewer frequency bands than the HIT group.
Conclusion: HIT-induced reduction of visceral fat was accompanied by increased VMH activity. Adding lactate administration to AT could partially reproduce hypothalamic plasticity and the metabolic effects of HIT. However, different band changes of LFPs implied that the neuronal subpopulations or pathways influenced by these two methods were not entirely consistent.
Keywords: High-intensity interval training; LFPs; Lactate; VMH; Visceral fat.
© 2024. The Author(s).
Conflict of interest statement
Declarations. Ethics approval and consent to participate: Ethics approval and consent to participate in all experimental procedures were approved by the Ethics Committee of Hebei Normal University (No. LLSC2024070). Consent for publication: Not applicable. Competing interests: The authors declare no competing interests.
Figures
Similar articles
-
The hypothalamic estrogen receptor α pathway is involved in high-intensity interval training-induced visceral fat loss in premenopausal rats.Lipids Health Dis. 2025 Mar 27;24(1):118. doi: 10.1186/s12944-025-02533-6. Lipids Health Dis. 2025. PMID: 40148843 Free PMC article.
-
Brain-derived neurotrophic factor (BDNF) in the hypothalamic ventromedial nucleus increases energy expenditure.Brain Res. 2010 Jun 8;1336:66-77. doi: 10.1016/j.brainres.2010.04.013. Epub 2010 Apr 14. Brain Res. 2010. PMID: 20398635 Free PMC article.
-
Effects of caudal fourth ventricular lactate infusion on hypoglycemia-associated MCT2, GLUT3, GLUT4, GCK, and sulfonylurea receptor-1 gene expression in the ovariectomized female rat LHA and VMH: impact of estradiol.J Mol Neurosci. 2008 Feb;34(2):121-9. doi: 10.1007/s12031-007-9020-z. Epub 2007 Dec 15. J Mol Neurosci. 2008. PMID: 18084728
-
The relationship between aerobic fitness and recovery from high intensity intermittent exercise.Sports Med. 2001;31(1):1-11. doi: 10.2165/00007256-200131010-00001. Sports Med. 2001. PMID: 11219498 Review.
-
Promoting neuroplasticity for motor rehabilitation after stroke: considering the effects of aerobic exercise and genetic variation on brain-derived neurotrophic factor.Phys Ther. 2013 Dec;93(12):1707-16. doi: 10.2522/ptj.20130053. Epub 2013 Aug 1. Phys Ther. 2013. PMID: 23907078 Free PMC article. Review.
Cited by
-
The hypothalamic estrogen receptor α pathway is involved in high-intensity interval training-induced visceral fat loss in premenopausal rats.Lipids Health Dis. 2025 Mar 27;24(1):118. doi: 10.1186/s12944-025-02533-6. Lipids Health Dis. 2025. PMID: 40148843 Free PMC article.
References
-
- Schwindling S, Scharhag-Rosenberger F, Kindermann W, et al. Limited benefit of Fatmax-test to derive training prescriptions. Int J Sports Med. 2014;35:280–5. - PubMed
-
- Zhang H, Tong TK, Kong Z, et al. Exercise training-induced visceral fat loss in obese women: the role of training intensity and modality. Scand J Med Sci Sports. 2021;31:30–43. - PubMed
-
- Dupuit M, Maillard F, Pereira B, et al. Effect of high intensity interval training on body composition in women before and after menopause: a meta-analysis. Exp Physiol. 2020;105:1470–90. - PubMed
MeSH terms
Substances
LinkOut - more resources
Full Text Sources
