. 2024 Dec 18;21(1):322.
doi: 10.1186/s12974-024-03306-1.

Impact of noradrenergic inhibition on neuroinflammation and pathophysiology in mouse models of Alzheimer's disease

Affiliations

Impact of noradrenergic inhibition on neuroinflammation and pathophysiology in mouse models of Alzheimer's disease

Andrew K Evans et al. J Neuroinflammation. .

Abstract

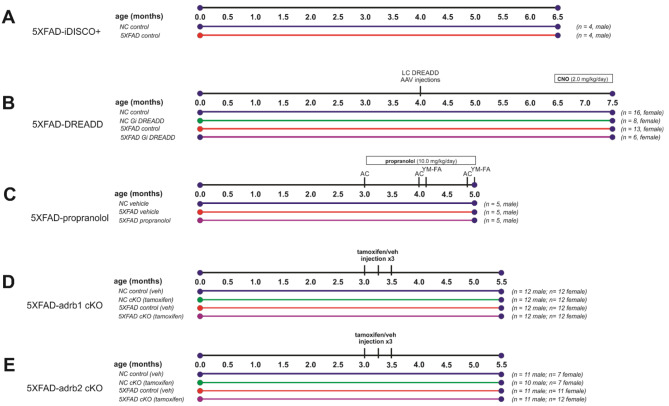
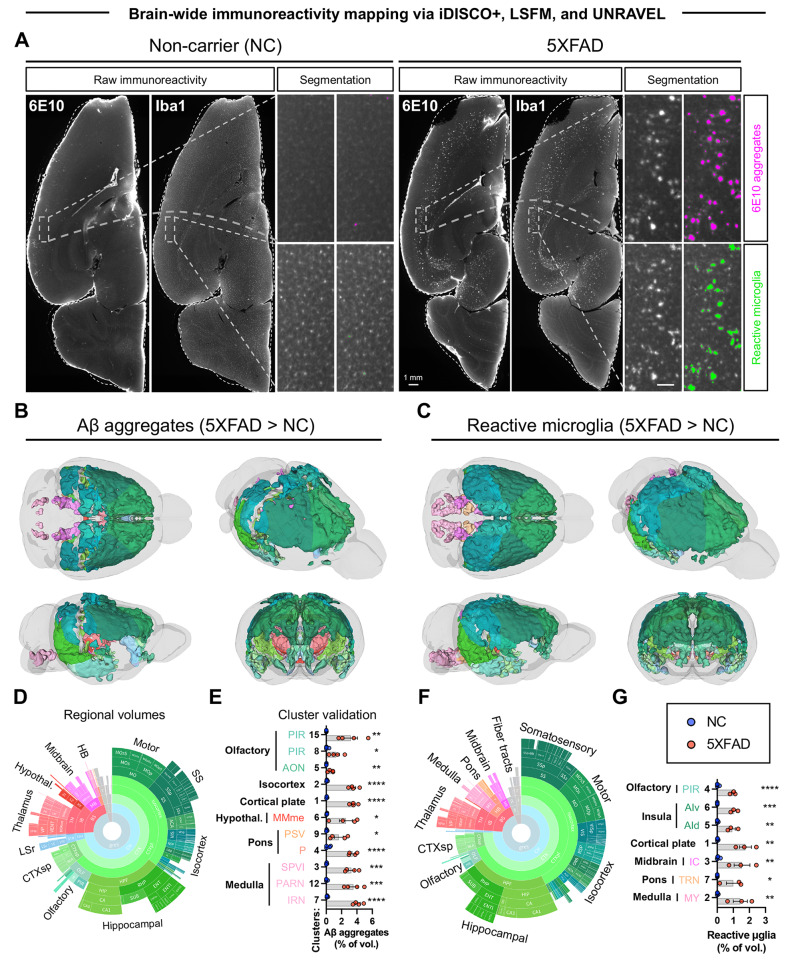
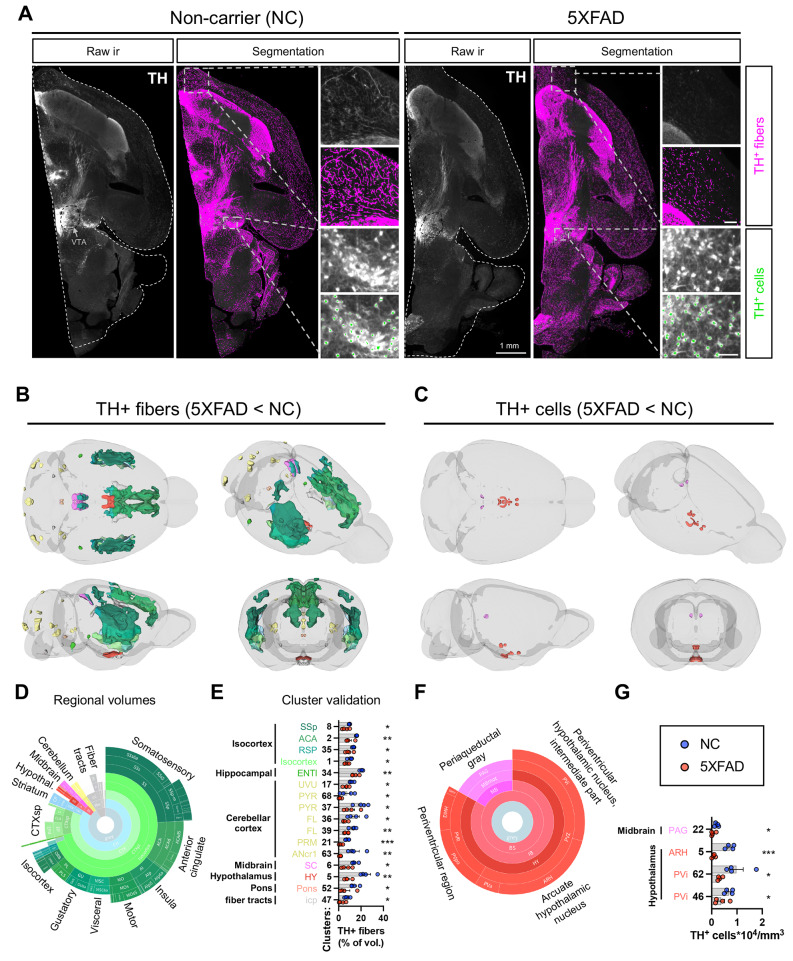
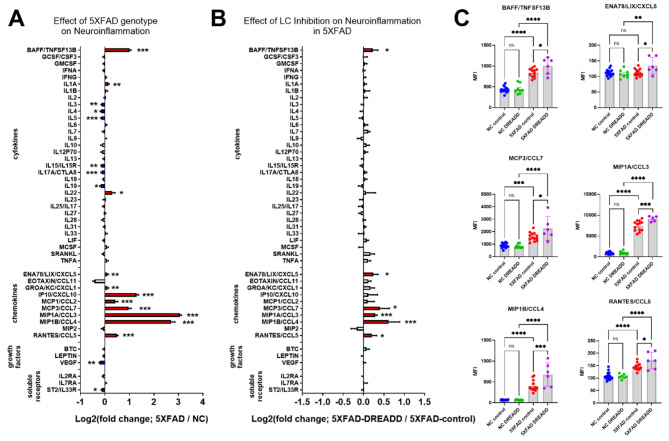
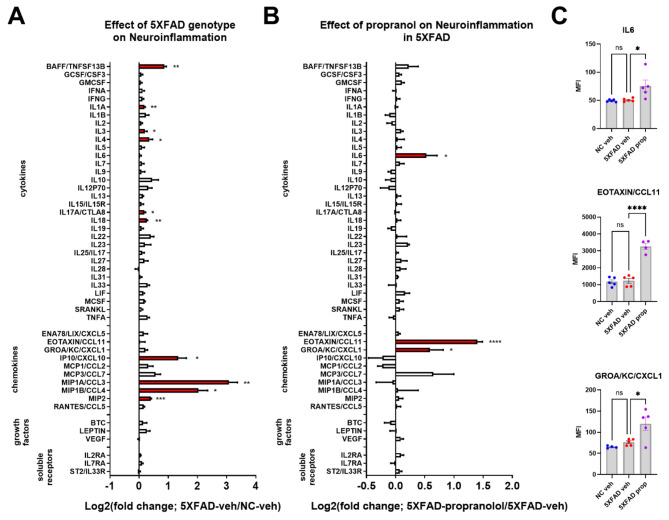
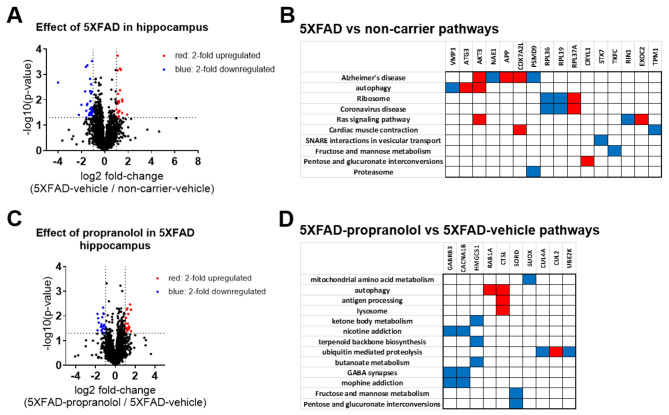
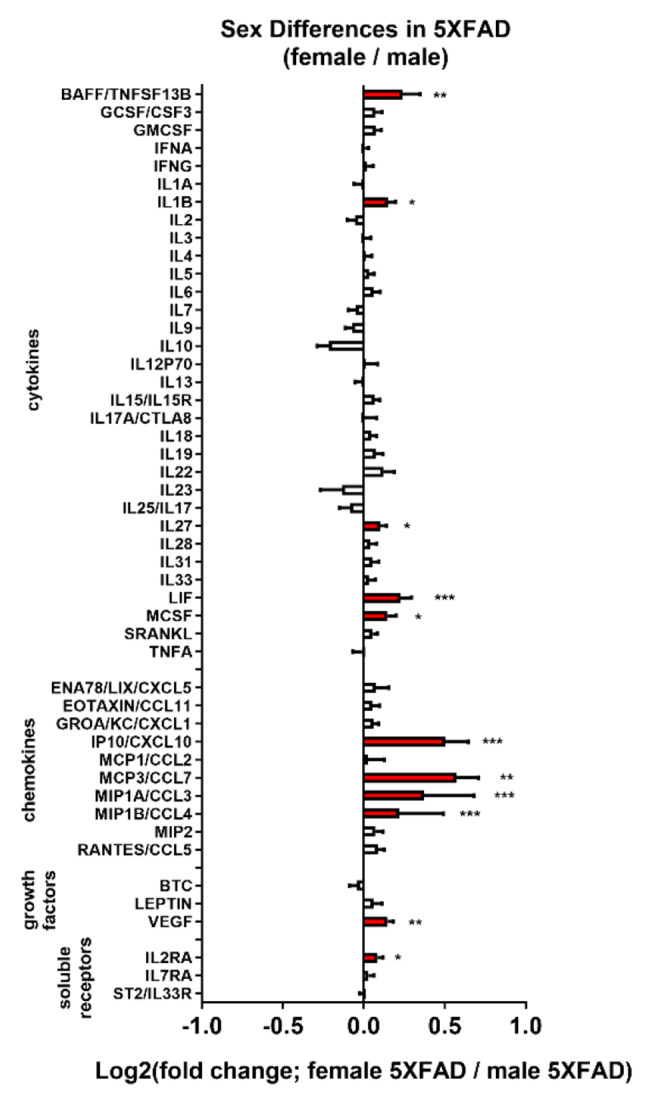
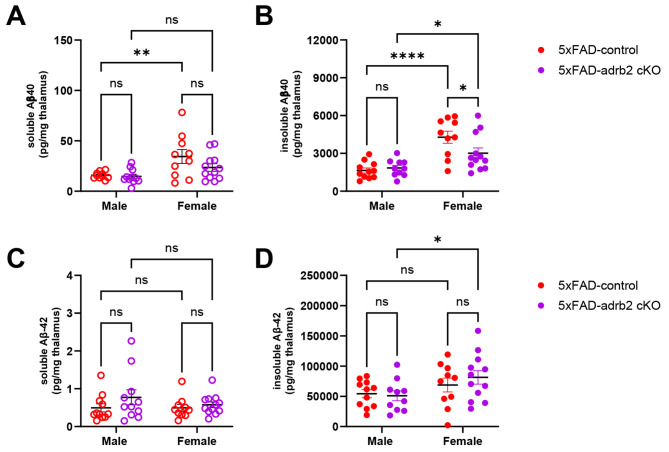
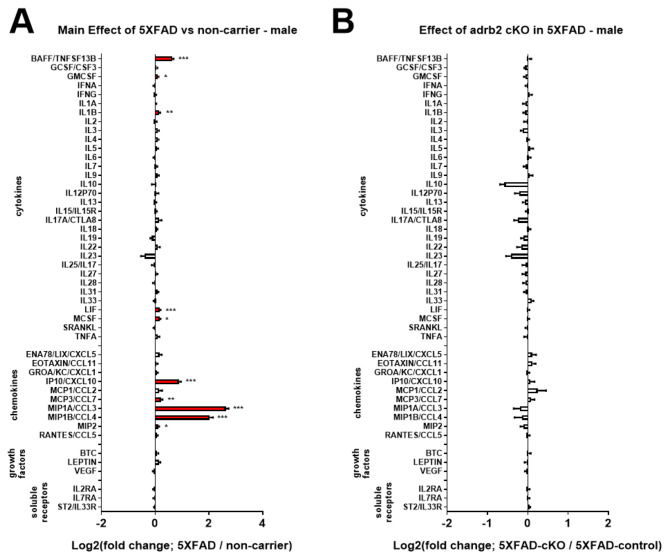
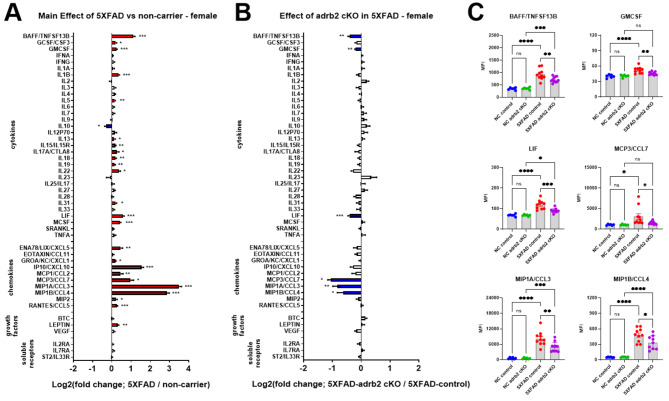
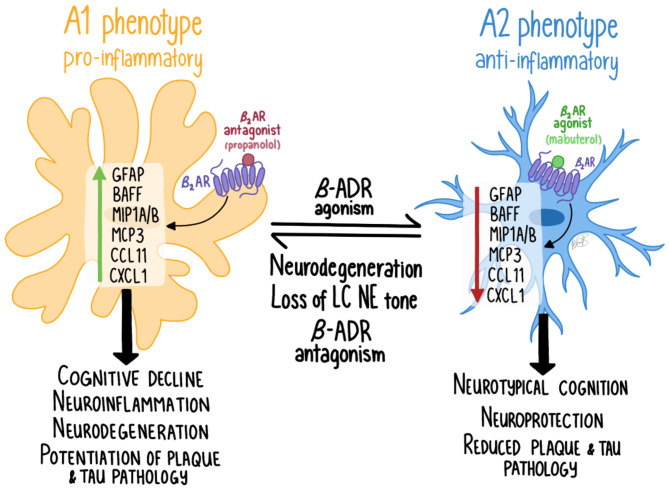
Norepinephrine (NE) modulates cognitive function, arousal, attention, and responses to novelty and stress, and it also regulates neuroinflammation. We previously demonstrated behavioral and immunomodulatory effects of beta-adrenergic pharmacology in mouse models of Alzheimer's disease (AD). The current studies were designed to block noradrenergic signaling in 5XFAD mice through (1) chemogenetic inhibition of the locus coeruleus (LC), (2) pharmacologic blocking of β-adrenergic receptors, and (3) conditional deletion of β1- or β2-adrenergic receptors (adrb1 or adrb2) in microglia.First, brain-wide AD pathology was mapped in 3D by imaging immunolabeled, cleared 5XFAD brains to assess the overlap between amyloid beta (Aβ) pathology, reactive microglia, and the loss of tyrosine hydroxylase (TH) expression in the catecholaminergic system. To examine the effects of inhibiting the LC NE system in the 5XFAD model, inhibitory (Gi) DREADD receptors were expressed specifically in LC NE neurons. LC NE neurons were chronically inhibited through the subcutaneous pump administration of the DREADD agonist clozapine-N-oxide (CNO). Plasma and brains were collected for assessment of neuroinflammation and pathology. A separate cohort of 5XFAD mice was chronically dosed with the beta-adrenergic antagonist propranolol or vehicle and evaluated for behavior, as well as post-mortem neuroinflammation and pathology. Finally, we used 5XFAD mice with conditional deletion of either adrb1 or adrb2 in microglia to assess neuroinflammation and pathology mediated by β-adrenergic signaling.Using iDISCO+, light sheet fluorescence microscopy, and novel analyses, we detected widespread microgliosis and Aβ pathology, along with modest TH downregulation in fibers across multiple brain regions, in contrast to the spatially limited TH downregulation observed in neurons. Both chemogenetic inhibition of LC adrenergic signaling and pharmacological inhibition of beta-adrenergic receptors potentiated neuroinflammation without altering Aβ pathology. Conditional deletion of adrb1 in microglia did not affect neuroinflammation. Conditional deletion of adrb2 in microglia attenuated inflammation and pathology in females but had no effect in males. Overall, these data support previous observations demonstrating the immunomodulatory effects of beta-adrenergic signaling in the pathophysiology of brain disorders and suggest that adrenergic receptors on cell types other than microglia, such as astrocytes, may mediate some of the disease-modifying effects of β-adrenergic agonists in the brain.

Keywords: Alzheimer’s Disease; Amyloid beta; Beta-adrenergic receptor; Beta-blocker; Locus coeruleus; Microglia; Neuroinflammation; Norepinephrine; iDISCO+.


Conflict of interest statement

Declarations. Ethics approval and consent to participate: Not applicable. Consent for publication: Not applicable. Competing interests: MS is a shareholder and founder of CuraSen Therapeutics, a company developing adrenergic drugs for the treatment of neurodegenerative disease. AKE is a shareholder of CuraSen Therapeutics. However, this work was initiated and carried out independently from CuraSen Therapeutics and was not designed, initiated, or funded by CuraSen Therapeutics. BDH is on the scientific advisory boards of Journey Clinical and Osmind, and is a paid consultant to Arcadia Medicine, Inc.

Figures

Fig. 1
Fig. 1
Experimental Designs. (A) 5XFAD mice and non-carrier (NC) controls were aged to 6.5 months old for iDISCO + and light sheet imaging of brain pathology. (B-E) Inhibition of noradrenergic signaling was examined in parallel studies. (B) Immunological effects of the 5XFAD genotype and chemogenetic inhibition of locus coeruleus (LC) noradrenergic neurons with Designer Receptors Exclusively Activated by Designer Drugs (DREADDs) were examined in 5XFAD and NC control mice. DREADD agonist clozapine N-oxide (CNO) was administered for 28 days via a pump to activate an inhibitory (Gi) DREADD expressed on LC noradrenergic neurons. Tissue was collected at 7.5 months of age. (C) Effects of beta-adrenergic receptor blockade with propranolol were examined in 5XFAD mice, and vehicle-treated 5XFAD mice and NC controls were also compared. Propranolol was administered daily for 2 months (10 mg/kg/day; intraperitoneal). Behavior was assessed in activity chamber (AC) and Y-Maze-forced alternation (YM-FA) assays. Tissue was collected at 5 months of age. (D-E) Effects of conditional deletion of adrb1 or adrb2 in microglia were studied in male and female 5XFAD and NC control mice. Three doses of tamoxifen or the vehicle (veh) control were administered to initiate the deletion of ADRB1 or ADRB2 on myeloid lineage cells, including microglia. Gene expression recovers in peripheral myeloid lineage cells with cell turnover but remains absent from microglia in the brain. Tissue was collected at 5.5 months of age
Fig. 2
Fig. 2
Mapping Aβ aggregation and microglial reactivity in 5XFAD mouse brains. Brains from aged 5XFAD mice (6.5 months) and non-carrier (NC) controls were immunostained and cleared with iDISCO+. Aβ plaques (anti-6E10) and microglia (anti-iba1) were labeled in the left hemispheres. Brains were imaged in 3D with LSFM and analyzed using UNRAVEL. (A) Examples of raw immunoreactivity are shown with the dashed outlines representing the surface of the registered atlas (white). The scale bar in the zoomed inset is 100 µm. Ilastik segmentations are shown for Aβ plaques and reactive microglia for 5XFAD mice and NC controls. For voxel-wise analyses, artifacts (edges and capillaries) were masked in the background-subtracted 6E10-immunofluorescence images, and voxels not associated with reactive microglia were masked the background-subtracted iba1-immunofluorescence images. The resulting images were then warped to atlas space, z-scored, and smoothed for intensity-based voxel-wise comparisons, followed by false discovery rate correction (q < 0.2). Clusters of significant voxels were warped back to full-resolution tissue space to measure label densities (the volume of segmented 6E10 aggregates / cluster volume * 100 or the volume of segmented reactive microglia / cluster volume * 100). Clusters were considered valid if unpaired one-tailed t-tests confirmed differences between the groups. (B, C) Valid clusters are shown in 3D brain models with Allen brain atlas coloring. For display purposes, unilateral cluster maps were mirrored. (D and F) The regional composition of valid clusters by volume is shown in sunburst plots (outer rings represent subregions, whereas inner rings correspond to parent regions). (E and G) Bar graphs summarize data for all valid clusters. n = 4 for all groups, except for 5XFAD iba1 where n = 3 (one sample was excluded due to a technical error in sample preparation). Mean ± SEM. *p < 0.05, **p < 0.01, ***p < 0.001, ****p < 0.001. Supplemental Table S9 defines region abbreviations, and Supplemental Table S10 reports the significance, volumes, positions, and regional composition of valid clusters. Numbers ([‘2/3’, ‘5’, ‘6a’]) = cortical layers. Additional abbreviations not defined in Supplemental Table S9 include: {‘c’: ‘central nucleus’, ‘d’: ‘dorsal nucleus or dorsal’, ‘e’: ‘external nucleus’, ‘me’: ‘median’, ‘mot’: ‘motor related’, ‘sen’: ‘sensory related’, ‘v’: ‘ventral’}
Fig. 3
Fig. 3
Fewer TH+ fibers and cells are detected in 5XFAD mouse brains. Tyrosine hydroxylase (TH) was immunolabeled in the right hemispheres. Brains were imaged in 3D with LSFM and analyzed using UNRAVEL. (A) Examples of raw immunoreactivity (ir) are shown for 5XFAD mice and non-carrier (NC) controls, with dashed outlines indicating the registered atlas (white) and the ventral tegmental area (black). Scale bars in insets are 100 µm. Autofluorescence was removed from immunofluorescence images. The resulting images were warped to atlas space, z-scored, and smoothed for intensity-based voxel-wise comparisons, followed by FDR correction (q < 0.4). Clusters of significant voxels were warped back to full-resolution tissue space to measure label densities (the volume of segmented TH+ fibers / cluster volume * 100) or, using the subset of clusters overlapping regions with catecholaminergic neurons, cell densities (TH+ cells / cluster volume). Clusters were considered valid if unpaired one-tailed t-tests confirmed differences in TH+ fiber or cell densities between the groups. (B and C) Valid clusters are shown in 3D brains with Allen brain atlas coloring. For display purposes, unilateral clusters were mirrored. (D and F) The regional composition of valid clusters by volume is shown in sunburst plots. (E and G) Bar graphs summarize data for all valid clusters. n = 4 for both groups. *p < 0.05, **p < 0.01, ***p < 0.001. Supplemental Table S10 summarizes the significance, volumes, positions, and regional composition of valid clusters. Numbers ([‘1’, ‘2/3’, ‘3’, ‘4’, ‘5’]) indicate cortical layers, except ANcr1 stands for Crus 1. Additional abbreviations not defined in Supplemental Table S9 include: {‘agl’: ‘agranular’, ‘l’: ‘lateral’, ‘p’: ‘primary’, ‘p-bfd’: ‘primary (barrel field)’, ‘p-tr’: ‘primary (trunk)’, ‘po’: ‘preoptic’, ‘s’: ‘supplemental’, ‘sg’: ‘superficial gray layer’, ‘v’: ‘ventral’, ‘zo’: ‘zonal layer’}
Fig. 4
Fig. 4
Chemogenetic inhibition of locus coeruleus (LC) noradrenergic neurons with DREADDs potentiates CNS inflammation in the 5XFAD mouse model of amyloidosis. Log2-fold change graphs depict the effects of (A) 5XFAD genotype (5XFAD/non-carrier (NC); n = 19) and (B) LC inhibition (5XFAD-DREADD/5XFAD-control; n = 6) on a panel of inflammation-related markers. (C) Bar graphs display raw data mean fluorescence intensity (MFI) for proteins affected by LC inhibition, as indicated in panel B. For (A) * indicates main effects. For (B) and C), * indicates post-hoc Sidak’s comparison of means following two-way ANOVA (5XFAD x DREADD). *p < 0.05, **p < 0.01, ***p < 0.001, ****p < 0.0001
Fig. 5
Fig. 5
Pharmacological antagonism of beta-adrenergic receptors with propranolol (prop) potentiates CNS inflammation in the 5XFAD mouse model of amyloidosis. Log2-fold change graphs depict the effects of (A) 5XFAD in vehicle (veh)-treated mice (5XFAD-veh/non-carrier (NC)-veh; n = 5) and (B) propranolol in 5XFAD mice (5XFAD-prop/5XFAD-veh; n = 5). (C) Bar graphs show raw data from proteins affected by propranolol, as indicated in panel B. *p < 0.05, **p < 0.01, ***p < 0.001, ****p < 0.0001; Sidak’s post-hoc comparison of means following one-way ANOVA
Fig. 6
Fig. 6
Pharmacological inhibition of beta-adrenergic receptors with propranolol alters the proteome in the 5XFAD mouse model of amyloidosis. Volcano plots depict the effects of 5XFAD and propranolol on the hippocampal proteome, illustrating fold change and significance for detected proteins. Over 3000 proteins were identified in the hippocampus. (A) 58 proteins were upregulated (red) or downregulated (blue) with the 5XFAD genotype (5XFAD-veh/NC-veh), using a fold change of 2 and a p-value cutoff p < 0.05 (-Log10(p-value) > 1.3). (B) Clustergram analysis identified proteins modulated by 5XFAD in specific pathways. Blue indicates downregulation and red indicates upregulation. KEGG analysis revealed that pathways impacted by 5XFAD in the hippocampus include autophagy, metabolic pathways, and neurodegeneration-related pathways. (C) 41 proteins were upregulated (red) or downregulated (blue) by propranolol, using the same thresholds. (D) Clustergram analysis, based on KEGG, identified propranolol-modulated proteins in specific pathways, including metabolic pathways and those related to autophagy and lysosomes
Fig. 7
Fig. 7
Sex differences in 5XFAD neuroinflammation. The log2-fold change graph depicts the effects of sex in 5XFAD mice (female-5XFAD/male-5XFAD) from the adrb2 cKO study on a panel of inflammation-related markers. *p < 0.05, **p < 0.01, ***p < 0.001, ****p < 0.0001; main effect of sex with two-way ANOVA (Sex x Treatment)
Fig. 8
Fig. 8
Conditional knockout of adrb2 in microglia partly reduced insoluble Aβ40 in female 5XFAD mice. Bar graphs depict thalamic concentrations of soluble and insoluble (A, B) Aβ40 and (C, D) Aβ42. *p < 0.05, ** p < 0.01, ***p < 0.001, ****p < 0.0001; Sidak’s post-hoc comparison of means following two-way ANOVA (adrb2 cKO x sex)
Fig. 9
Fig. 9
Effect of conditional knockout of adrb2 in microglia in male 5XFAD and non-carrier mice. Log2-fold change graphs depict the effects of (A) 5XFAD (5XFAD/non-carrier; n = 20) and (B) adrb2 cKO in microglia (5XFAD-cKO/5XFAD-control; n = 10) in male 5XFAD mice on a panel of inflammation-related markers. For (A) * indicates a main effect of 5XFAD. For (B) * indicates post-hoc Sidak’s comparison of means following two-way ANOVA (5XFAD x cKO). *p < 0.05, **p < 0.01, ***p < 0.001, ****p < 0.0001
Fig. 10
Fig. 10
Effect of conditional knockout of adrb2 in microglia in female 5XFAD and non-carrier mice. Log2-fold change graphs depict the effects of (A) 5XFAD (5XFAD/non-carrier; n = 21) and (B) adrb2 cKO in microglia (5XFAD-cKO/5XFAD-control; n = 11) in female mice on a panel of inflammation-related markers. (C) Bar graphs show raw data from proteins affected by adrb2 cKO, as indicated in panel B. For (A) * indicates the main effect of 5XFAD. For (B) and (C) * indicates post-hoc Sidak’s comparison of means following two-way ANOVA (5XFAD x adrb2 cKO). *p < 0.05, ** p < 0.01, *** p < 0.001, **** p < 0.0001
Fig. 11
Fig. 11
The schematic above depicts a model in which beta-adrenergic receptors (adrb, β-ADR) modulate an A1 inflammatory response in astrocytes, which is upregulated in neurodegenerative disorders and with loss of noradrenergic tone. 5XFAD mice have increased levels of A1 inflammatory markers in the brain (Figs. 4A, 5A, 9A and 10A). Chemogenetic inhibition of the LC with inhibitory DREADD receptors (Fig. 4B) and antagonism of β2-ADRs (Fig. 5B) enhance the production of key A1-astrocytic chemokines and cytokines. Notably, conditional deletion of β2-ADR from microglia does not mimic the effect of β2-ADR antagonism or LC inhibition (Figs. 7B and 9B), indicating that NE might operate through ADRs on other cell types (e.g. astrocytes) to control neuroinflammation

Update of

Similar articles

Cited by

References

    1. Thomas SA. Neuromodulatory signaling in hippocampus-dependent memory retrieval. Hippocampus. 2015;25(4):415–31. - PMC - PubMed
    1. Sara SJ, Bouret S. Orienting and reorienting: the locus coeruleus mediates cognition through arousal. Neuron. 2012;76(1):130–41. - PubMed
    1. Sara SJ. The locus coeruleus and noradrenergic modulation of cognition. Nat Rev Neurosci. 2009;10(3):211–23. - PubMed
    1. Matt RA, Martin RS, Evans AK, Gever JR, Vargas GA, Shamloo M et al. Locus Coeruleus and Noradrenergic Pharmacology in Neurodegenerative Disease. Handb Exp Pharmacol. 2023. - PubMed
    1. Verclytte S, Lopes R, Lenfant P, Rollin A, Semah F, Leclerc X, et al. Cerebral hypoperfusion and hypometabolism detected by arterial spin labeling MRI and FDG-PET in early-onset Alzheimer’s Disease. J Neuroimaging. 2016;26(2):207–12. - PubMed

MeSH terms

LinkOut - more resources