. 2025 Feb;12(6):e2409260.
doi: 10.1002/advs.202409260. Epub 2024 Dec 18.

Tubulin-Based Microtentacles Aid in Heterotypic Clustering of Neutrophil-Differentiated HL-60 Cells and Breast Tumor Cells

Affiliations

Tubulin-Based Microtentacles Aid in Heterotypic Clustering of Neutrophil-Differentiated HL-60 Cells and Breast Tumor Cells

Julia A Ju et al. Adv Sci (Weinh). 2025 Feb.

Abstract

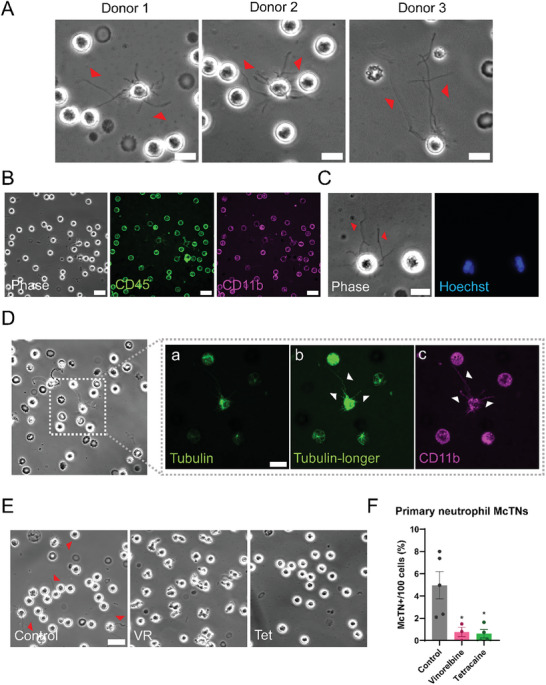
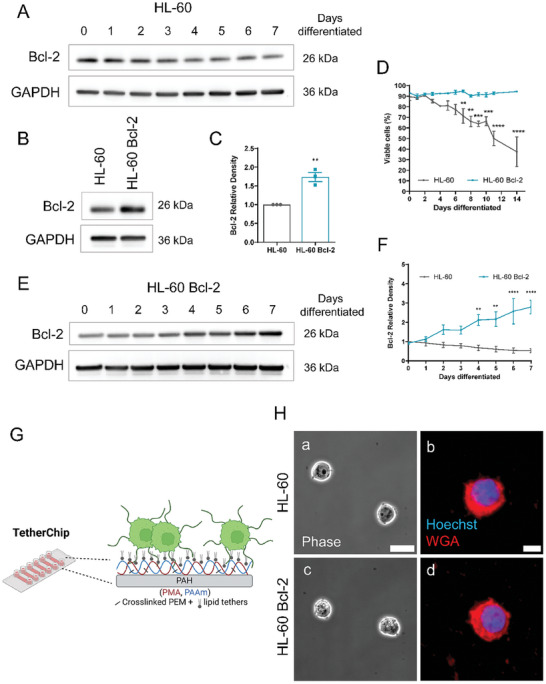
Circulating tumor cells (CTCs) travel through the vasculature to seed secondary sites and serve as direct precursors of metastatic outgrowth for many solid tumors. Heterotypic cell clusters form between CTCs and white blood cells (WBCs) and recent studies report that a majority of these WBCs are neutrophils in patient and mouse models. The lab discovered that CTCs produce tubulin-based protrusions, microtentacles (McTNs), which promote reattachment, retention in distant sites during metastasis and formation of tumor cell clusters. Neutrophil-CTC clusters help CTCs survive the harsh vascular environment to promote successful metastasis, however, the specific mechanism of this interaction is not fully understood. Utilizing TetherChip technology, it is found that primary and differentiated neutrophils produce McTNs composed of detyrosinated and acetylated α-tubulin and vimentin. Neutrophil McTNs aid in cluster formation, migration, and reattachment, which are suppressed with the tubulin-depolymerizing agent, Vinorelbine. Co-culturing differentiated neutrophils and tumor cells formed heterotypic clusters that enhanced migration. CTC-neutrophil clusters have higher metastatic efficiency, and by demonstrating that neutrophils form McTNs, a new possible mechanism for how neutrophils interact with tumor cells is revealed. These findings further support the idea that developing cluster-disrupting therapies can provide a new targeted strategy to reduce the metastatic potential of cancer cells.

Keywords: HL‐60 cells; TetherChip; circulating tumor cells; heterotypic cluster; metastasis; microtentacles; neutrophils.


Conflict of interest statement

The University of Maryland School of Medicine owns patents on the subject of microtentacles and microfluidic cell tethering that list one of the authors on the current manuscript (Stuart S. Martin) as an inventor.

Figures

Figure 1
Figure 1
Primary human neutrophils produce tubulin‐based McTNs. A) Representative phase contrast images of live isolated primary human neutrophils from three separate human donors. Red arrows indicate the presence of McTNs. Scale bar = 10 µm. B) Representative phase contrast (left), CD45‐stained (middle) and CD11b‐stained (right) live primary neutrophils illustrating the cells that were isolated are neutrophils. Scale bar = 20 µm. C) Representative phase contrast (left) and Hoechst‐stained (right) live primary neutrophils displaying that McTNs are not made of DNA. Red arrows indicate microtentacles. Scale bar = 10 µm. D) Representative phase contrast image of isolated live primary human neutrophils with McTNs stained with a) a live tubulin‐tracker, b) the same image as (a) with the majority of the cell necessarily overexposed to reveal the thin, fluorescently labeled McTNs and c) CD11b. Scale bar = 10 µm. E) Representative phase contrast images of control neutrophils (left) or neutrophils treated with 10 µM Vinorelbine (VR, middle) or 250 µM Tetracaine (Tet, right) for 1 hr on TetherChips. Red arrows indicate McTNs. Scale bar = 20 µm. F) McTN quantification of live neutrophils tethered onto TetherChips and treated for 1 hr. Error bars indicate mean ± standard error of mean, n = 3–5 with at least 100 cells counted per condition per replicate. *p < 0.05 versus control (One‐way ANOVA with Bonferroni post‐ test).
Figure 2
Figure 2
Bcl‐2 overexpression in HL‐60 cells prevents apoptosis upon differentiation into neutrophils. A) Protein levels of Bcl‐2 in HL‐60 cells that were differentiated over 7 days were measured via Western blotting analysis. B) Immunoblot of Bcl‐2 in HL‐60 cells or HL‐60 cells stably overexpressing Bcl‐2. C) Densitometric fold change analysis of Bcl‐2 protein expression normalized to GAPDH and fold change over the parental HL‐60 cells. Error bars indicate ± standard error of mean, n = 3. **p < 0.01 versus HL‐60 (Two‐tailed t‐test). D) Cell viability of HL‐60 and HL‐60 Bcl‐2 cells was determined using a trypan blue exclusion assay using an automated cell counter at 0, 1, 2, 3, 4, 5, 6, 7, 8, 9, 10, 11 and 14 days post‐differentiation with 1.3% DMSO. Error bars indicate ± standard error of mean, n = 3. **p < 0.01; ***p < 0.001; ****p < 0.0001 versus HL‐60 (Two‐way ANOVA with Bonferroni post‐test). E) Protein levels of Bcl‐2 in HL‐60 Bcl‐2 overexpressing cells that were differentiated over 7 days were measured via Western blotting analysis. F) Densitometric fold change analysis of Bcl‐2 protein expression from western blot analysis in A and E normalized to GAPDH. Error bars indicate standard error of mean, n = 3–5. **p < 0.01, ****p < 0.0001 versus HL‐60 at the indicated time point (Two‐way ANOVA with Bonferroni post‐test). G). Diagram of TetherChip illustrating how cells can be immobilized by the lipid tether while also not adhering to the surface via the polyelectrolyte multilayers. H‐a,c) Phase contrast images of undifferentiated HL‐60 cells and HL‐60 Bcl‐2 cells, respectively. Images were taken at 60x magnification on a Nikon Ti2‐E inverted microscope. Scale bar = 10 µm. b,d) Immunofluorescent images of HL‐60 and HL‐60 Bcl‐2 cells stained with Hoechst and Wheat Germ Agglutinin AlexaFluor 594 (WGA) taken at 60x magnification using an Olympus IX81 microscope with a Fluoview FV1000 confocal laser scanning system. Scale bar = 5 µm. From here on out only HL‐60 Bcl‐2 cells were used for experiments.
Figure 3
Figure 3
Differentiation of HL‐60 cells into neutrophils induces McTN formation. HL‐60 Bcl‐2 cells were differentiated into a neutrophil‐like state by culturing in 1.3% DMSO media for 7 days. A) Undifferentiated and differentiated cells were stained with an antibody against CD11b, chosen as an early differentiation marker and with B) FLPEP (a fluorescent ligand of FPR1), chosen as a late differentiation marker. Samples were measured by flow cytometry and data was analyzed using FCS Express software. C) Averaged values of CD11b positive cells between 4 and 7 days of differentiation. Error bars indicate mean ± standard deviation, n = 3. ****p < 0.0001 versus the undifferentiated sample for each time point (Two‐tailed t‐test). D) Averaged values of FLPEP positive cells between 4 and 7 days of differentiation. Error bars indicate mean ± standard deviation, n = 3. ***p < 0.001 versus the undifferentiated sample for each time point (Two‐tailed t‐test). E) Immunofluorescent images of tethered and fixed HL‐60 Bcl‐2 cells differentiated over the course of 7 days stained with Hoechst and F). WGA. Images were taken at 60x magnification using an Olympus IX81 microscope with a Fluoview FV1000 confocal laser scanning system. Scale bar = 10 µm. G) McTN quantification of tethered and fixed HL‐60 Bcl‐2 cells differentiated over 7 days. Data represents quantification of McTN frequency from four independent experiments with 100 cells counted for each. Error bars indicate ± standard error of mean, n = 4. **p < 0.01; ***p < 0.001 versus day 0 (One‐way ANOVA with Bonferroni post‐test). H) Immunofluorescent images of tethered and fixed day 7 differentiated neutrophils stained with Hoechst, α‐tubulin, and WGA were taken at 60x magnification using a Nikon Ti2‐E inverted microscope with a Nikon AX‐R confocal system. Images were denoised in a post‐processing step using NIS Elements. Scale bar = 10 µm.
Figure 4
Figure 4
Tubulin post‐translational modifications are enhanced in differentiated neutrophils. A) Western blot analysis of HL‐60 Bcl‐2(N) cells differentiated with 1.3% DMSO over 7 days probed for acetylated α‐tubulin, detyrosinated α‐tubulin, α‐tubulin, vimentin, and GAPDH. B) Densitometry measurements normalized to α‐tubulin levels for acetyl and detyrosinated α‐tubulin and GAPDH levels for vimentin. C) Densitometry statistical analysis for acetylated α‐tubulin protein expression. Error bars indicate mean ± standard error of mean, n = 3. *p < 0.05; **p < 0.01 versus day 0 (One‐way ANOVA with Bonferroni post‐test). D) Densitometry statistical analysis for detyrosinated α‐tubulin protein expression. Error bars indicate mean ± standard error of mean, n = 3. *p < 0.05; **p < 0.01; ***p < 0.001 versus day 0 (One‐way ANOVA with Bonferroni post‐test). E) Densitometry statistical analysis for vimentin protein expression. Error bars indicate mean ± standard error of mean, n = 3. **p < 0.01; ***p < 0.001; ****p < 0.0001 versus day 0 (One‐way ANOVA with Bonferroni post‐test). F) Immunofluorescent images of tethered and fixed day 7 differentiated neutrophils stained with Hoechst, α‐tubulin, WGA and either acetylated α‐tubulin, detyrosinated α‐tubulin or vimentin. Images were taken at 60x magnification using a Nikon Ti2‐E inverted microscope with a Nikon AX‐R confocal system. Images were denoised in a post‐processing step using NIS Elements. Scale bar = 10 µm.
Figure 5
Figure 5
Differentiation into neutrophils induces cluster formation, migration, and attachment. A) Representative images of undifferentiated (top panel) and day 7 differentiated (bottom panel) HL‐60 Bcl‐2 cells that were allowed to cluster for 24 h and then tethered onto TetherChips and stained with Hoechst. Scale bar = 500 µm. B) Clustering efficiency analysis on the number of clusters that formed over 24h. Individual values at t = 0 were divided by respective t = 24 h number of clusters for each condition. Error bars indicate ± standard error of mean, n = 3. ***p < 0.001 versus undifferentiated HL‐60 Bcl‐2 (Two‐tailed t‐test). C) Average cluster size measurements of clusters formed after 24 h. Error bars indicate mean ± standard error of mean, n = 3. **p < 0.01 versus HL‐60 Bcl‐2 (Two‐tailed t‐test). D) Representative image of day 7 differentiated neutrophil cluster stained with Hoechst, WGA, and CD11b. Images were taken at 60x magnification using a Nikon Ti2‐E inverted microscope with a Nikon AX‐R confocal system. Images were denoised in a post‐processing step using NIS Elements. Scale bar = 20 µm. E) Representative graph of migration efficiency of HL‐60 Bcl‐2 cells versus the day 7 differentiated neutrophils (HL‐60(N)) toward fMLP over the course of 8 h on an xCelligence RTCA system. Error bars indicate ± standard deviation, n = 3. ****p < 0.0001 versus HL‐60 Bcl‐2 (from 0.3 to 8 h, two‐way ANOVA with Bonferroni post‐test). F) Representative images of the membrane of an xCelligence transwell cartridge stained with Hoechst and WGA illustrating HL‐60 or HL‐60(N) cells after migration through the pores. Images were taken with a Nikon Ti2‐E inverted microscope at 60x magnification. Scale bar = 50 µm. White arrows represent cells that have migrated through the pores of the membrane and attached to the other side. The small black dots, which can most easily be seen on the WGA channel are the membrane pores that the cells must squeeze through to migrate to the other side of the cartridge. G) Representative graph of reattachment efficiency of HL‐60 cells versus HL‐60(N) cells. Error bars indicate ± standard deviation, n = 3. ****p < 0.0001 versus HL‐60 Bcl‐2 (from 0.5 to 6 h, two‐way ANOVA with Bonferroni post‐test). H) Representative phase contrast still frames of HL‐60 (top panels) or HL‐60(N) (bottom panels) cells attaching onto fibronectin‐coated 24‐well plates at t = 0 (left panels) and t = 1 h (right panels). Images were taken at 60x magnification on a Nikon Ti2‐E inverted microscope with a stage‐top Tokai‐hit incubator chamber. Scale bar = 50 µm.
Figure 6
Figure 6
Vinorelbine treatment of differentiated neutrophils disrupts McTN formation and McTN‐supported phenotypes. A) Immunofluorescence images of tethered and fixed day 7 differentiated neutrophils treated with Vinorelbine (10 µm, VR) for 1 h, stained with WGA. Images were taken at 60x magnification using a Nikon Ti2‐E inverted microscope with a Nikon AX‐R confocal system. Scale bar = 10 µm. B) McTN quantification of day 7 differentiated neutrophils treated with PBS (vehicle) versus 10 µm VR tethered on TetherChip. Data represents quantification of McTN frequency from three independent experiments with 100 cells counted for each. Data are shown as mean ± standard deviation, n = 3. ***p < 0.001 versus PBS (Two‐tailed t‐test). Scale bar = 500 µm. C) Quantification of the perimeter of differentiated neutrophils treated with either PBS or 10 µm VR analyzed by ImageJ. Data are shown as mean ± standard deviation, n = 3. ***p < 0.001 versus PBS (Two‐tailed t‐test). D) Representative images of differentiated neutrophils cells treated with either PBS (left panel) or 10 µm of VR (right panel) that were allowed to cluster for 24 h and then tethered onto TetherChips. Scale bar = 500 µm. E) Clustering efficiency analysis on the number of clusters that formed over 24 h. Individual values at t = 0 were divided by respective t = 24 h number of clusters for each condition. Error bars indicate mean ± standard error of mean, n = 3. ***p < 0.001 versus PBS treated (Two‐tailed t‐test). F) Average cluster size measurements of clusters formed after 24 h. Error bars indicate mean ± standard error of mean, n = 3. G) Representative graph of migration efficiency of day 7 differentiated neutrophils treated with either PBS or 10 µm VR toward fMLP over the course of 8 h. Error bars indicate mean ± standard deviation, n = 3. ****p < 0.0001 versus PBS‐treated (from 0.6 to 8 h, two‐way ANOVA with Bonferroni post‐test). H) Representative images of the membrane of an xCelligence transwell cartridge stained with Hoechst and WGA illustrating PBS‐ or 10 µm Vinorelbine‐treated differentiated neutrophils after migration through the pores. Images were taken with a Nikon Ti2‐E inverted microscope at 60x magnification. Scale bar = 50 µm. White arrows represent cells that have migrated through the pores of the membrane and attached to the other side. The small black dots, within the larger horizontally aligned circles, which can most easily be seen on the WGA channel are the membrane pores that the cells must squeeze through to migrate to the other side of the cartridge. I) Representative graph of reattachment efficiency of day 7 differentiated neutrophils treated with PBS or 10 µm VR. Error bars indicate mean ± standard deviation, n = 3. ****p < 0.0001 versus PBS‐treated (from 1.6 to 8 h, two‐way ANOVA with Bonferroni post‐test). J) Representative phase contrast still frames of differentiated neutrophils treated with PBS (top panels) or 10 µm VR (bottom panels) attaching onto fibronectin‐coated plates at t = 0 (left panels) and t = 1 h (right panels). Images were taken at 60x magnification on a Nikon Ti2‐E inverted microscope with a stage‐top Tokai‐hit incubator chamber. Scale bar = 50 µm.
Figure 7
Figure 7
Differentiated neutrophils and tumor cells form heterotypic clusters that can be inhibited with Vinorelbine. A) Representative images of PBS‐(top panel) versus Vinorelbine (10 µm, bottom panel)‐treated tumor cell‐day 7 differentiated neutrophil heterotypic clusters that were allowed to cluster for 6 h under low‐attach conditions and then tethered onto TetherChips and stained with Hoechst. Scale bar = 300 µm. B) Clustering efficiency analysis on the number of heterotypic clusters that formed over 6 h. Individual values at t = 0 were divided by respective t = 6 h number of clusters for each condition. Error bars indicate mean ± standard error of mean, n = 4. ****p < 0.0001 versus PBS treated (Two‐tailed t‐test). C) Average cluster size measurements of clusters formed after 6 h. Error bars indicate mean ± standard error of mean, n = 4. D) Representative image of heterotypic clusters stained with Hoechst, WGA, and CD11b. Images were taken at 60x magnification using a Nikon Ti2‐E inverted microscope with a Nikon AX‐R confocal system. Images were denoised in a post‐processing step using NIS Elements. Scale bar = 10 µm.
Figure 8
Figure 8
Co‐culturing day 7 differentiated neutrophils with tumor cells enhance migration. A) Diagram of xCelligence co‐culture migration assay. a) Schematic of the migration cartridge with an upper and lower chamber and a microporous membrane in between, which is coated with gold microelectrodes on the underside to sense the cells migrating through. b) Schematic of an individual well in the cartridge where the cells are seeded after co‐culturing and allowed to migrate through the pores over time. c) The top and bottom chamber can be detached following the termination of the experiment and the top chamber can be fixed and mounted with a coverslip to image on the microscope. B) Representative graph of migration efficiency of undifferentiated HL‐60 Bcl‐2 cells only, differentiated neutrophils only, MDA‐MB‐231TD cells only, a 1:1 co‐culture of undifferentiated HL‐60 Bcl‐2 cells and MDA‐MB‐231TD cells and a 1:1 co‐culture of differentiated neutrophils and MDA‐MB‐231TD cells toward 10% FBS (tumor cell attractant) over the course of 24 h. Error bars indicate mean ± SD, each experiment was performed in triplicates. ****, p < 0.0001 of tumors cells only versus differentiated neutrophil: tumor cell co‐culture from 8.5 to 24 h and undifferentiated HL‐60 Bcl‐2 cells: tumor cell co‐culture versus differentiated neutrophil: tumor cell co‐culture from 6 to 24 h (Two‐way ANOVA with Bonferroni post‐test). C) Representative graph of migration efficiency of undifferentiated HL‐60 Bcl‐2 cells only, differentiated neutrophils only, MDA‐MB‐231TD cells only, a 5:1 co‐culture of undifferentiated HL‐60 Bcl‐2 cells and MDA‐MB‐231TD cells and a 5:1 co‐culture of differentiated neutrophils and MDA‐MB‐231TD cells toward 200 nm fMLP (neutrophil attractant) over the course of 8 h. Error bars indicate mean ± SD, each experiment was performed in triplicate. ****, p < 0.0001 of tumors cells only versus differentiated neutrophil: tumor cell co‐culture from 4 to 8 h and differentiated neutrophil: tumor cell coculture versus undifferentiated HL‐60 Bcl‐2 cell: tumor cell co‐culture from 1.5 to 8 h (Two‐way ANOVA with Bonferroni post‐test). D) Fluorescent images of a fibronectin‐coated, formaldehyde‐fixed, Hoechst‐stained xCelligence migration CIM cartridge with GFP‐labeled MDA‐MB‐231TD tumor cells and mCherry‐labeled differentiated neutrophils that migrated through pores toward 200 nm fMLP. Images were taken at 20x magnification using a Nikon Ti2‐E inverted microscope. Scale bar = 100 µm.

References

    1. Anderson R. L., Balasas T., Callaghan J., Coombes R. C, Evans J., Hall J. A., Kinrade S., Jones D., Jones P. S., Jones R., Marshall J. F., Panico M. B., Shaw J. A., Steeg P. S., Sullivan M., Tong W., Westwell A. D., Ritchie J. W. A., Nat. Rev. Clin. Oncol. 2019, 16, 185. - PMC - PubMed
    1. Alix‐Panabieres C., Schwarzenbach H., Pantel K., Annu. Rev. Med. 2012, 63, 199. - PubMed
    1. Masucci M. T., Minopoli M., Carriero M. V, Front. Oncol. 2019, 9, 1146. - PMC - PubMed
    1. Rosales C., Front. Physiol. 2018, 9, 113. - PMC - PubMed
    1. Kolaczkowska E., Kubes P., Nat. Rev. Immunol. 2013, 13, 159. - PubMed

LinkOut - more resources