Review
. 2025 Mar;56(3):794-805.
doi: 10.1161/STROKEAHA.124.049474. Epub 2024 Dec 19.

Socioeconomic Status and Stroke: A Review of the Latest Evidence on Inequalities and Their Drivers

Affiliations
Review

Socioeconomic Status and Stroke: A Review of the Latest Evidence on Inequalities and Their Drivers

Camila Pantoja-Ruiz et al. Stroke. 2025 Mar.

Abstract

The latest research on socioeconomic status (SES) and stroke continues to demonstrate that individuals with low SES are at a higher risk of stroke, receive lower-quality care, and experience poorer outcomes. Despite growing evidence on the impact of SES on stroke, gaps remain in understanding the underlying mechanisms and the influence of SES in different contexts, particularly in low- and middle-income countries. This narrative review builds upon our previous reviews from 2006 to 2015, focusing on studies published since 2015 to update on the influence of SES on stroke. Reports from nationwide or population-based observational studies in the past decade have confirmed that these inequalities persist globally and have provided new evidence on their mechanisms. In high-income countries, inadequate control of cardiovascular risk factors (hypertension, diabetes, obesity, and dyslipidemia) among lower socioeconomic groups has been found to explain much of the inequality in stroke risk. Exposure to particulate air pollution (both environmental and indoor from solid fuel cooking) synergizes with cardiovascular risk factors, especially hypertension, as major causes in low- and middle-income countries. Lower SES is persistently associated with disparities in care and increased poststroke disability and mortality. Lower SES also exacerbates other causes of health inequality among women, ethnic minorities, and migrants. Addressing stroke inequalities requires an interdisciplinary approach. Targeting cardiovascular risk factors, providing equitable quality of acute and rehabilitative stroke care, enacting legislative measures, and implementing societal changes remain leading global priorities.

Keywords: hypertension; mortality; risk factors; social class; stroke.


Conflict of interest statement

None.

Figures

Figure 1.
Figure 1.
Timeline of stroke risk and outcomes: key determinants influencing health inequalities. Stroke risk and outcomes result from a complex, progressive process where an individual’s biopsychosocial characteristics interact with their environment. Factors at various levels of this relationship influence each other in a reciprocal, longitudinal system, where the preceding ones shape each stage. CVRF indicates cardiovascular risk factor; and SES, socioeconomic status.
Figure 2.
Figure 2.
Global distribution of evidence on socioeconomic status (SES) and stroke. Heatmap shows the global distribution of reviewed evidence on the relationship between SES, stroke risk, and outcomes. Darker shades indicate countries with more cohort studies, while lighter shades reflect fewer studies.
Figure 3.
Figure 3.
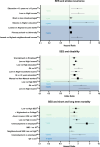
Forest plots illustrating the association between socioeconomic status (SES) and stroke incidence and care. Forest plots illustrate the association between SES and stroke incidence and acute and long-term stroke care outcomes. The upper part compares individual SES factors (eg, income, education) and area-based SES factors (eg, neighborhood deprivation, Area Deprivation Index [ADI]) on stroke incidence, represented as hazard ratios (HRs). The lower part shows the relationship between SES and access to stroke care, with odds ratios (ORs) reflecting disparities in acute and long-term care (eg, admission to stroke units and rehabilitation therapy). Squares represent point estimates, and error bars indicate 95% CIs. The size of each square is proportional to the sample size or weight of the study in the analysis. IMD indicates Index of Multiple Deprivation.
Figure 4.
Figure 4.
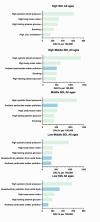
Risk factors for stroke according to Social Development Index (SDI). This figure, based on the GBD study (Global Burden of Disease) data reported by Feigin et al, shows the top stroke-related risk factors (disability-adjusted life-years [DALYs] per 100 000) across different SDI levels. High SDI: stroke burden is mainly driven by high systolic blood pressure, high body mass index, fasting plasma glucose, smoking, and high LDL (low-density lipoprotein) cholesterol. High-middle and middle SDI: in addition to cardiovascular risks like high systolic blood pressure and body mass index, ambient particulate matter pollution becomes a significant factor. Low-middle and low SDI: environmental risks, particularly household air pollution and particulate matter, combine with cardiovascular risks to increase stroke burden. Bar lengths indicate the DALYs contributed by each risk factor in each SDI group.
Figure 5.
Figure 5.
Forest plots illustrating the association between socioeconomic status (SES) and stroke incidence and care. Forest plots illustrate the impact of SES on stroke recurrence, disability, and mortality. In the top part, the hazard ratios depict stroke recurrence across various SES measures over different follow-up periods, ranging from 1 week to 3 years. The middle part shows odds ratios for disability based on SES factors, with follow-up periods spanning from 3 months to 4 years. The bottom part displays hazard ratios for short- and long-term mortality, reflecting the influence of SES at follow-up intervals ranging from 1 month to 17 years. The error bars represent 95% CIs, with larger squares indicating studies that included greater sample sizes. IMD indicates Index of Multiple Deprivation.

References

    1. Cox AM, McKevitt C, Rudd AG, Wolfe CDA. Socioeconomic status and stroke. Lancet Neurol. 2006;5:181–188. doi: 10.1016/S1474-4422(06)70351-9 - PubMed
    1. Marshall IJ, Wang Y, Crichton S, McKevitt C, Rudd AG, Wolfe CDA. The effects of socioeconomic status on stroke risk and outcomes. Lancet Neurol. 2015;14:1206–1218. doi: 10.1016/S1474-4422(15)00200-8 - PubMed
    1. Adler NE, Ostrove JM. Socioeconomic status and health: what we know and what we don’t. Ann NY Acad Sci. 1999;896:3–15. doi: 10.1111/j.1749-6632.1999.tb08101.x - PubMed
    1. Galobardes B, Lynch J, Smith GD. Measuring socioeconomic position in health research. Br Med Bull. 2007;81–82:21–37. doi: 10.1093/bmb/ldm001 - PubMed
    1. Ferrari R. Writing narrative-style literature reviews. Med Writ. 2015;24:230–235. doi: 10.1179/2047480615Z.000000000329