. 2024 Dec 18:7:0554.
doi: 10.34133/research.0554. eCollection 2024.

Pyruvate Abundance Confounds Aminoglycoside Killing of Multidrug-Resistant Bacteria via Glutathione Metabolism

Affiliations

Pyruvate Abundance Confounds Aminoglycoside Killing of Multidrug-Resistant Bacteria via Glutathione Metabolism

Jiao Xiang et al. Research (Wash D C). .

Abstract

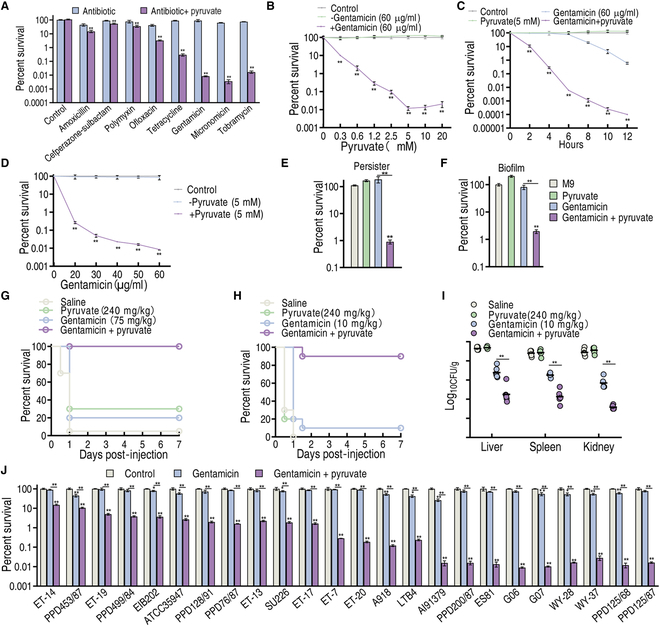
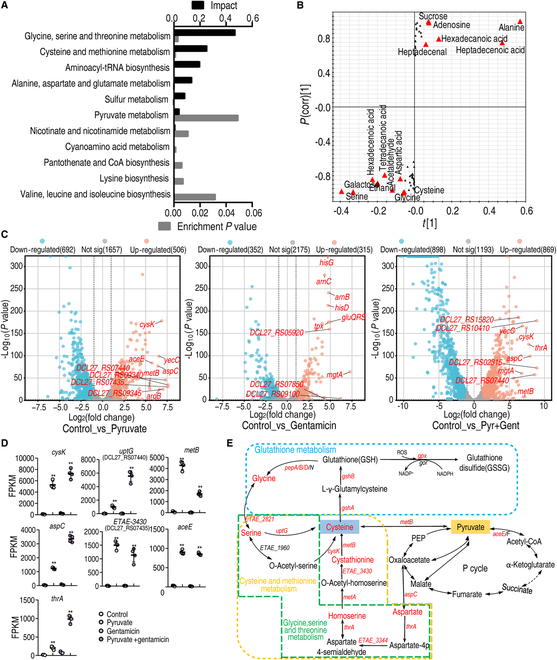
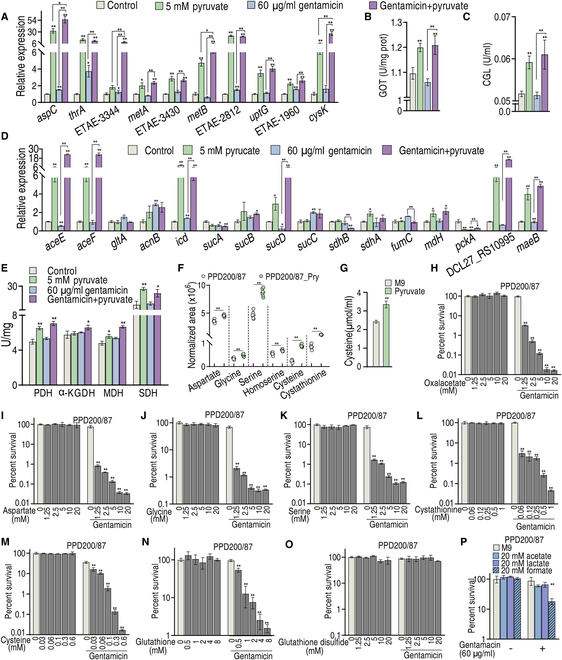
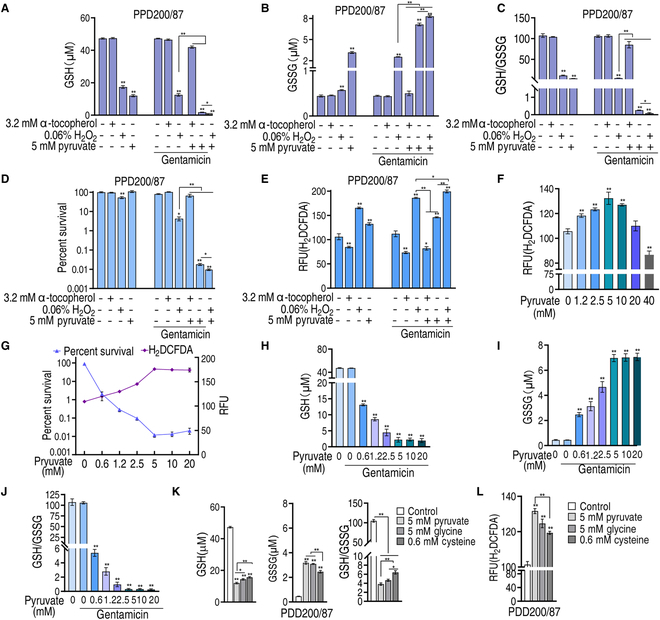
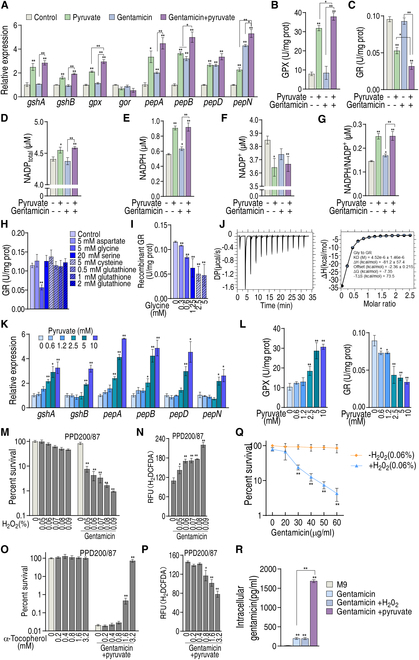
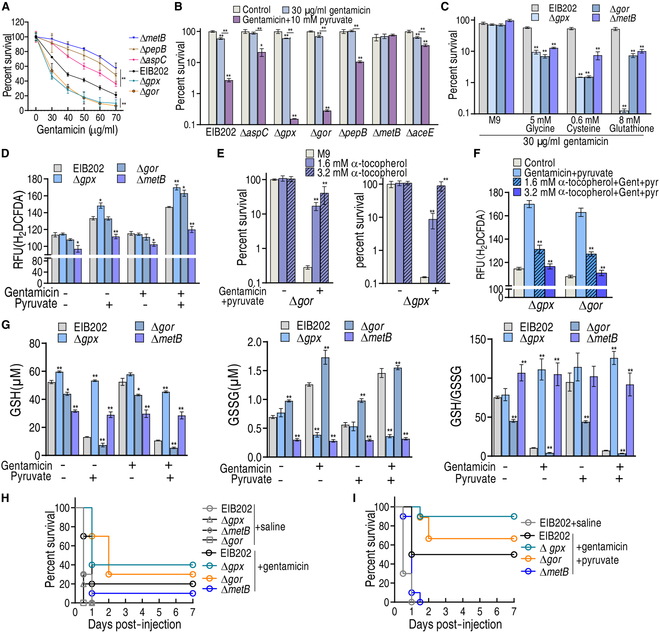
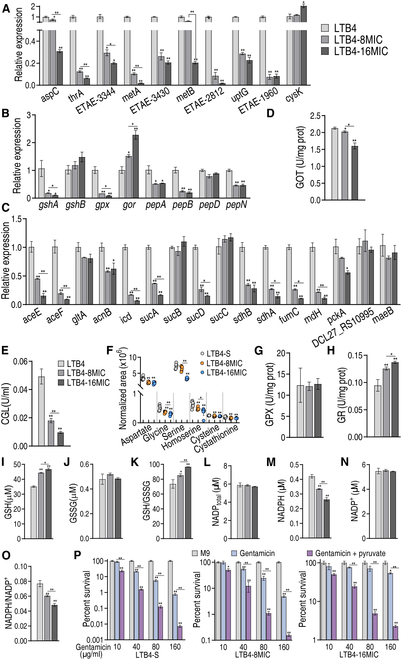
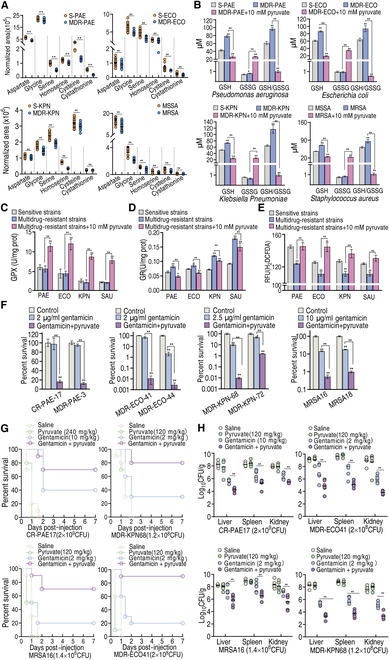
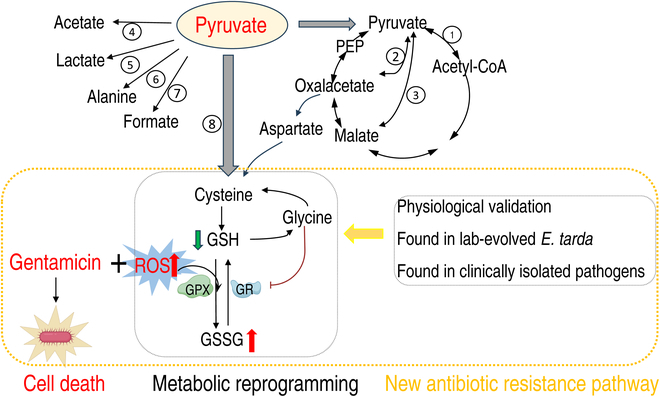
To explore whether the metabolic state reprogramming approach may be used to explore previously unknown metabolic pathways that contribute to antibiotic resistance, especially those that have been neglected in previous studies, pyruvate reprogramming was performed to reverse the resistance of multidrug-resistant Edwardsiella tarda. Surprisingly, we identified a pyruvate-regulated glutathione system that occurs by boosting glycine, serine, and threonine metabolism. Moreover, cysteine and methionine metabolism played a key role in this reversal. This process involved pyruvate-depressed glutathione and pyruvate-promoted glutathione oxidation, which was attributed to the elevated glutathione peroxidase and depressed glutathione reductase that was inhibited by glycine. This regulation inhibited reactive oxygen species (ROS) degradation and thereby elevated ROS to eliminate E. tarda. Loss of metB, gpx, and gor of the metabolic pathways increased and decreased resistance, respectively, both in vitro and in vivo, thereby supporting the hypothesis of a pyruvate-cysteine-glutathione system/glycine-ROS metabolic pathway. The role of this metabolic pathway in drug resistance and reprogramming reversal was demonstrated in laboratory-evolved gentamicin-resistant E. tarda and other clinically isolated multidrug- and carbapenem-resistant pathogens. Thus, we reveal a less studied antibiotic resistance metabolic pathway along with the mechanisms involved in its reversal.


Conflict of interest statement

Competing interests: The authors declare that they have no competing interests.

Figures

Fig. 1.
Fig. 1.
Pyruvate-enabled killing of PPD200/87 by gentamicin. (A) Survival of PPD200/87 (108 CFU/ml) in the synergistic use of 20 mM pyruvate and 100 μg/ml amoxicillin, 200 μg/ml cefperazone-sulbactam, 100 μg/ml polymyxin, 25 μg/ml ofloxacin, 150 μg/ml tetracycline, 50 μg/ml gentamicin, 50 μg/ml micronomicin, or 50 μg/ml tobramycin for 6 h. (B) Survival of PPD200/87 (108 CFU/ml) in the absence or presence of the indicated concentration of pyruvate with and without 60 μg/ml gentamicin. (C) Survival of PPD200/87 (108 CFU/ml) in the indicated incubation time with or without 5 mM pyruvate and/or 60 μg/ml gentamicin. (D) Survival of PPD200/87 (108 CFU/ml) in the indicated dose of gentamicin with or without 5 mM pyruvate for 6 h. (E) Survival of PPD200/87 persisters (108 CFU/ml) in the presence and absence of 5 mM pyruvate and 60 μg/ml gentamicin. (F) Survival of PPD200/87 biofilm (108 CFU/ml) in the presence and absence of 5 mM pyruvate and 60 μg of gentamicin. (G) Survival of tilapia with PPD200/87 (1.1 × 10⁷ CFU) systemic infection in the absence and presence of 240 mg/kg pyruvate, 75 mg/kg gentamicin, or both. (H and I) Survival (H) and organ bacterial number (I) of mice with PPD200/87 (2 × 10⁹ CFU) systemic infection in the absence and presence of pyruvate (10 mg/kg), gentamicin (240 mg/kg), or both. (J) Survival of clinically isolated E. tarda strains (108 CFU/ml) in the presence or absence of 5 mM pyruvate and 30 μg/ml gentamicin. Results are displayed as means ± SD, and statistically significant differences are identified by Kruskal–Wallis followed by Dunn’s multiple comparison post hoc test unless otherwise indicated. *P < 0.05 and **P < 0.01.
Fig. 2.
Fig. 2.
Metabolomic and transcriptional analysis for crucial pathways that are responsible for pyruvate-potentiated gentamicin killing. (A) Metabolic pathways enriched by differentially abundant metabolites. (B) S-plot generated from OPLS-DA illustrates individual metabolites as triangles. Potential biomarkers, indicated in red, are those with an absolute value of covariance P ≥ 0.05 and correlation P(corr) ≥ 0.5. (C) Volcano plots showing DEGs, where the top 10 up-regulated genes are indicated. (D) Expressional abundance of top 10 genes in glycine, serine, and threonine metabolism; cysteine and methionine metabolism; and glutathione metabolism. (E) Diagram showing that pyruvate fluxes into main metabolic pathways and genes and metabolites in glycine, serine, and threonine metabolism, cysteine and methionine metabolism, and glutathione system. Red, up-regulated gene (italics) and metabolite of glycine, serine, and threonine metabolism; cysteine and methionine metabolism; and glutathione metabolism in metabolomics and transcriptional analysis. Results are displayed as the mean ± SD, and statistically significant differences are identified by Kruskal–Wallis followed by Dunn’s multiple comparison post hoc test unless otherwise indicated. *P < 0.05 and **P < 0.01.
Fig. 3.
Fig. 3.
Exogenous pyruvate boosts glutathione metabolism via glycine, serine, and threonine metabolism and cysteine and methionine metabolism. (A) qRT-PCR for expression of genes encoding glycine, serine, and threonine metabolism and cysteine and methionine metabolism in the absence or presence of 5 mM pyruvate and/or 60 μg/ml gentamicin. (B and C) Activity of GOT (B) and CGL (C) in the absence or presence of 5 mM pyruvate and/or 60 μg/ml gentamicin. (D) qRT-PCR for expression of genes encoding the P cycle in the absence or presence of 5 mM pyruvate and/or 60 μg/ml gentamicin. (E) Activity of enzymes of the P cycle in the absence or presence of 5 mM pyruvate and/or 60 μg/ml gentamicin. (F) Abundance of some intermetabolites in glycine, serine, and threonine metabolism, cysteine and methionine metabolism, and glutathione system, quantified by GC-MS. (G) Intracellular level of cysteine in the presence of 5 mM pyruvate in PPD200/87. (H to O) Survival of PPD200/87 (108 CFU/ml) in M9 medium without Mg++ and Ca++ in the presence of oxaloacetate (H) and aspartate (I) of pyruvate to oxaloacetate, glycine (J) and serine (K) of glycine, serine, and threonine, cysteine (L) and cystathione (M) of cysteine and methionine metabolism, and GSH (N) and GSSG (O) of glutathione plus 60 μg/ml gentamicin. (P) Survival of PPD200/87 (108 CFU/ml) in the presence of formate, acetate, or lactic acid with 60 μg/ml gentamicin. Results are displayed as the mean ± SD, and statistically significant differences are identified by Kruskal–Wallis followed by Dunn’s multiple comparison post hoc test unless otherwise indicated. *P < 0.05 and **P < 0.01.
Fig. 4.
Fig. 4.
Redox modulated by exogenous pyruvate affects gentamicin killing. (A) GSH of PPD200/87 in the absence or presence of 5 mM pyruvate and/or 60 μg/ml gentamicin plus 3.2 mM α-tocopherol, or 0.06% H2O2. (B) GSSG of PPD200/87 in the absence or presence of 5 mM pyruvate and/or 60 μg/ml gentamicin plus 3.2 mM α-tocopherol, or 0.06% H2O2. (C) Ratio of GSH/GSSG in (A) and (B). (D) Survival of PPD200/87 (108 CFU/ml) in the presence of 60 μg/ml gentamicin and 5 mM pyruvate plus 3.2 mM α-tocopherol, or 0.06% H2O2. (E) ROS content in (D). (F) ROS of PPD200/87 in the indicated concentration of pyruvate. (G) Relationship between survival and ROS of PPD200/87 (107 CFU) in the presence of the indicated concentrations of pyruvate and 60 μg/ml gentamicin. (H) GSH of PPD200/87 in the indicated concentration of pyruvate and 60 μg/ml gentamicin. (I) GSSG of PPD200/87 in the indicated concentration of pyruvate and 60 μg/ml gentamicin. (J) GSH/GSSG in (H) and (I). (K) GSH, GSSG, and their ratio of PPD200/87 in the absence or presence of 5 mM pyruvate, 5 mM glycine, or 0.6 mM cysteine. (L) ROS of PPD200/87 (107 CFU) in the absence or presence of 5 mM pyruvate, 5 mM glycine, or 0.6 mM cysteine. Results are displayed as the mean ± SD, and statistically significant differences are identified by Kruskal–Wallis followed by Dunn’s multiple comparison post hoc test unless otherwise indicated. *P < 0.05 and **P < 0.01.
Fig. 5..
Fig. 5..
Glutathione metabolism and relationship between ROS and gentamicin killing. (A) qRT-PCR for expression of genes encoding glutathione metabolism in PPD200/87. (B and C) Activity of GPX (B) and GR (C) of PPD200/87 in the absence or presence of 60 μg/ml gentamicin and/or 5 mM pyruvate. (D to G) NADPtotal (D), NADPH (E), NADP+ (F), and NADPH/NADP+ (G) of PPD200/80 in the absence or presence of 60 μg/ml gentamicin and/or 5 mM pyruvate. (H) Activity of GR in the presence of the indicated concentrations of the indicated metabolites. (I) Activity of recombinant GR in the presence of the indicated concentrations of glycine. (J) ITC for identifying the binding of glycine with recombinant GR. (K) qRT-PCR for expression of genes encoding cysteine to GSH and GSH to glycine in the presence of the indicated concentrations of pyruvate. (L) Activity of GPX and GR in the presence of the indicated concentrations of pyruvate. (M) Survival of PPD200/87(108 CFU/ml) in the presence of the indicated concentration of H2O2 plus 60 μg/ml gentamicin. (N) ROS of PPD200/87 in the presence of the indicated concentration of H2O2 plus 60 μg/ml gentamicin. (O) Survival of PPD200/87 (108 CFU/ml) in the presence of the indicated concentration of α-tocopherol plus 60 μg/ml gentamicin and 5 mM pyruvate. (P) ROS of PPD200/87 in the presence of the indicated concentration of α-tocopherol plus 60 μg/ml gentamicin and 5 mM pyruvate. (Q) Survival of PPD200/87 in the presence of H2O2 and the indicated concentrations of gentamicin. (R) Intracellular gentamicin of PPD200/87 in the presence of pyruvate or H2O2. Results are displayed as the mean ± SD, and statistically significant differences are identified by Kruskal–Wallis followed by Dunn’s multiple comparison post hoc test unless otherwise indicated. *P < 0.05 and **P < 0.01.
Fig. 6.
Fig. 6.
Physiological validation of pyruvate–aspartate–glycine–glutathione–ROS pathway. (A) Percent survival of EIB202 (108 CFU/ml) and its mutants ΔmetB (108 CFU/ml), ΔaspC (108 CFU/ml), ΔpepB (108 CFU/ml), Δgor (108 CFU/ml), and Δgpx (108 CFU/ml) in the indicated dose of gentamicin. (B) Percent survival of EIB202 (108 CFU/ml) and its mutants ΔmetB (108 CFU/ml), ΔaspC (108 CFU/ml), ΔpepB (108 CFU/ml), Δgor (108 CFU/ml), Δgpx (108 CFU/ml), ΔmetB (108 CFU/ml), and ΔaceE (108 CFU/ml) in the absence or presence of 10 mM pyruvate and/or 30 μg/ml gentamicin. (C) Percent survival of EIB202 (108 CFU/ml) and its mutants ΔmetB (108 CFU/ml), Δgor (108 CFU/ml), and Δgpx (108 CFU/ml) in the absence or presence of 5 mM glycine, 0.625 mM cysteine, or 8 mM glutathione and/or 30 μg/ml gentamicin. (D) ROS of EIB202 and its mutants ΔmetB, Δgor, and Δgpx (all 108 CFU) in the absence or presence of 10 mM pyruvate and/or 30 μg/ml gentamicin. (E) Percent survival of Δgor (108 CFU/ml) and Δgpx (107 CFU/ml) in the absence or presence of 10 mM pyruvate and 30 μg/ml gentamicin with or without the indicated concentration of α-tocopherol. (F) ROS of Δgor and Δgpx in the presence of 10 mM pyruvate and/or 30 μg/ml gentamicin with or without the indicated concentration of α-tocopherol. (G) GSH and GSSG and their ratio of EIB202 and their mutants ΔmetB, Δgor, and Δgpx in the absence or presence of 10 mM pyruvate and/or 30 μg/ml gentamicin. (H and I) Survival of mice infected with EIB202 and their mutants Δgpx, Δgor, and ΔmetB (4 × 10⁸ CFU, each strain). Mice were infected separately with EIB202 and its mutants ΔmetB, Δgpx, and Δgpx (n = 10 per group) and then treated with 10 mg/kg gentamicin (H) plus 120 mg/kg pyruvate (I). Results are displayed as the mean ± SD, and statistically significant differences are identified by Kruskal–Wallis followed by Dunn’s multiple comparison post hoc test unless otherwise indicated. *P < 0.05 and **P < 0.01.
Fig. 7.
Fig. 7.
Detection of the pyruvate–glycine–glutathione system–ROS metabolic pathway in LTB4-R8MIC and LTB4-R16MIC. (A to C) qRT-PCR for expression of genes encoding glycine, serine, and threonine metabolism, cysteine and methionine metabolism (A), glutathione metabolism (B), and the P cycle (C). (D and E) Activity of GOT (D) and CGL (E). (F) Abundance of some intermetabolites in glycine, serine, and threonine metabolism, cysteine and methionine metabolism, and glutathione system, quantified by GC-MS. (G and H) Activity of GPX and GR. (I to K) GSH (I), GSSG (J), and GSH/GSSG ratio (K). (L to O) NADPtotal (L), NADP+ (M), NADPH (N), and NADP+/NADPH (O). (P) Survival of LTB4-S, LTB4-R8MIC, and LTB4-R16MIC (106 CFU/ml) in the presence of the indicated gentamicin with or without pyruvate. Results are displayed as the mean ± SD, and statistically significant differences are identified by Kruskal–Wallis followed by Dunn’s multiple comparison post hoc test unless otherwise indicated. *P < 0.05 and **P < 0.01.
Fig. 8.
Fig. 8.
Pyruvate-potentiated killing and mechanisms in other clinical isolated pathogens. (A) Metabolomics of multidrug-resistant P. auroginosa, E. coli, K. pneumonia, and MRSA, showing changes in the pyruvate–aspartate–glycine–glutathione pathway. (B) GSH and GSSG and their ratio in 6 sensitive and 6 multidrug-resistant P. auroginosa, E. coli, K. pneumonia, and MRSA. (C and D) GPX (C) and GR (D) in 6 sensitive and 6 multidrug-resistant P. auroginosa, E. coli, K. pneumonia, and MRSA. (E) ROS in 6 sensitive and 6 multidrug-resistant P. auroginosa, E. coli, K. pneumonia, and MRSA. Strains were listed as follows: P. auroginosa, S-PAE643, S-PAE644, S-PAE645, S-PAE646, S-PAE647, S-PAE648, MDR-PAE3, MDR-PAE11, MDR-PAE12, MDR-PAE14, MDR-PAE16, CR-PAE17; E. coli, S-ECO61, S- ECO62, S-ECO63, S-ECO64, S-ECO65, S-ECO66, MDR-ECO41, MDR-ECO44, MDR-ECO45, MDR-ECO46, MDR-ECO47,MDR-ECO48; K. pneumonia, S-KPN100, S-KPN101, S-KPN102, S-KPN104, S-KPN106, S-KPN107, MDR-KPN68, MDR-KPN72, MDR-KPN76, MDR-KPN77, MDR-KPN78, MDR-KPN81; MRSA, MSSA1, MSSA2, MSSA3, MSSA4, MSSA5, MSSA6, MRSA11, MRSA12, MRSA13, MRSA14, MRSA16, MRSA18. Their MIC was listed in Fig. S7. (F) Survival of clinically isolated multidrug-resistant and/or carbapenem-resistant pathogens (108 CFU/ml) in the presence or absence of 10 mM pyruvate and the indicated concentration of gentamicin. (G and H) Survival (G) and organ bacterial number (H) of mice systemically infected with the indicated pathogens in the absence and presence of the indicated concentration of pyruvate, gentamicin, or both. Results are displayed as the mean ± SD, and statistically significant differences are identified by Kruskal–Wallis followed by Dunn’s multiple comparison post hoc test unless otherwise indicated. *P < 0.05 and **P < 0.01.
Fig. 9.
Fig. 9.
Proposed model. Pyruvate as a metabolic state reprogramming metabolite was used to potentiate gentamicin killing to multidrug-resistant E. tarda, which was involved in ROS dependence. This metabolic reprogramming leads to the finding on pyruvate–cysteine–glutathione system/glycine–ROS metabolic pathway. Specifically, the conversion of pyruvate to cysteine facilitates the synthesis of glutathione (GSH). The elevated GSH is subsequently metabolized into glycine to inhibit the activity of GR, thereby diminishing the availability of GSH. The decreased GSH reduces the GSSG/GSH ratio and thus compromises the capacity to scavenge intracellular ROS. The resulting ROS accumulation effectively potentiates the bactericidal effects of gentamicin. Furthermore, the metabolic pathway was physically demonstrated and determined as an antibiotic resistance mechanism in laboratory-evolved and other clinically isolated multidrug- and carbapenem-resistant pathogens.

Similar articles

Cited by

References

    1. Larsson DGJ, Flach CF. Antibiotic resistance in the environment. Nat Rev Microbiol. 2022;20(5):257–269. - PMC - PubMed
    1. Peng B, Li H, Peng XX. Proteomics approach to understand bacterial antibiotic resistance strategies. Expert Rev Proteomics. 2019;16:829–839. - PubMed
    1. Chowdhury FR, Findlay BL. Fitness costs of antibiotic resistance impede the evolution of resistance to other antibiotics. ACS Infect Dis. 2023;9(10):1834–1845. - PMC - PubMed
    1. Luepke KH, Mohr JF. The antibiotic pipeline: Reviving research and development and speeding drugs to market. Expert Rev Anti-Infect Ther. 2017;15(5):425–433. - PubMed
    1. Allison KR, Brynildsen MP, Collins JJ. Metabolite-enabled eradication of bacterial persisters by aminoglycosides. Nature. 2011;473(7346):216–220. - PMC - PubMed

LinkOut - more resources