

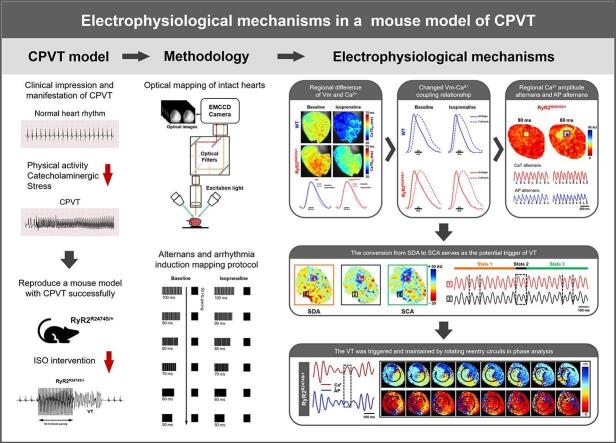
Dual calcium-voltage optical mapping of regional voltage and calcium signals in intact murine RyR2-R2474S hearts
- PMID: 39697246
- PMCID: PMC11649530
- DOI: 10.1016/j.jmccpl.2024.100121
Dual calcium-voltage optical mapping of regional voltage and calcium signals in intact murine RyR2-R2474S hearts
Abstract
Abnormal regional variations in electrical and calcium homeostasis properties have been implicated in catecholaminergic polymorphic ventricular tachycardias (CPVT) attributable to abnormal RyR2-mediated store Ca2+ release, but their underlying mechanism have not been well explored in intact hearts.
Methods: We performed in vivo and ex vivo studies including high throughput mapping of Ca2+ transients (CaT) and transmembrane voltage (Vm) in murine wild-type (WT) and heterozygous RyR2-R2474S/+ hearts, before and during isoprenaline (ISO) challenge.
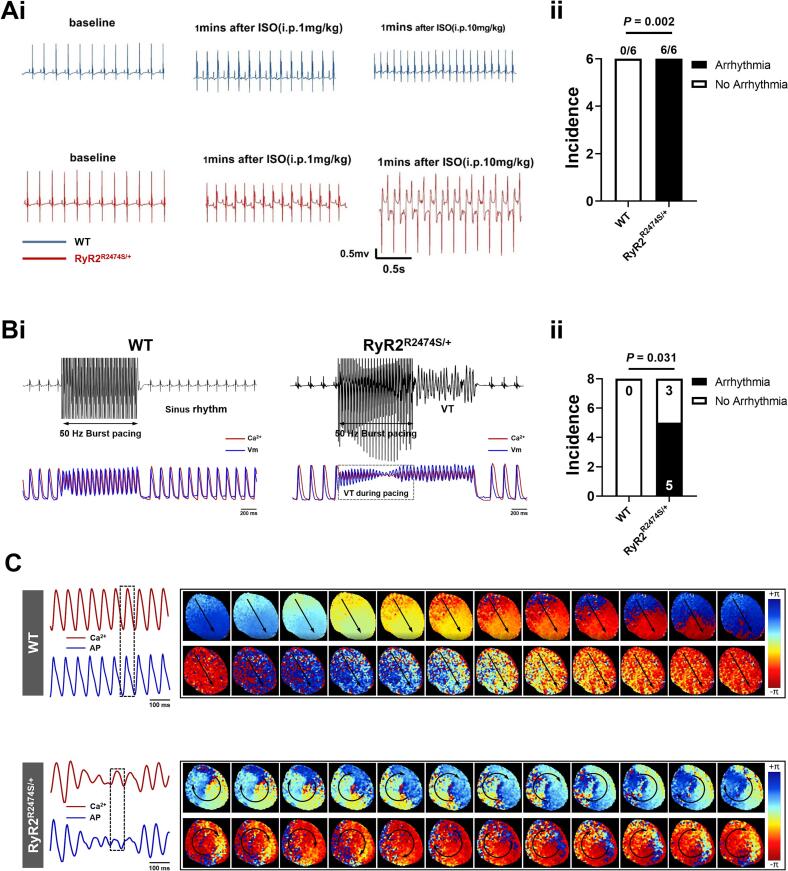
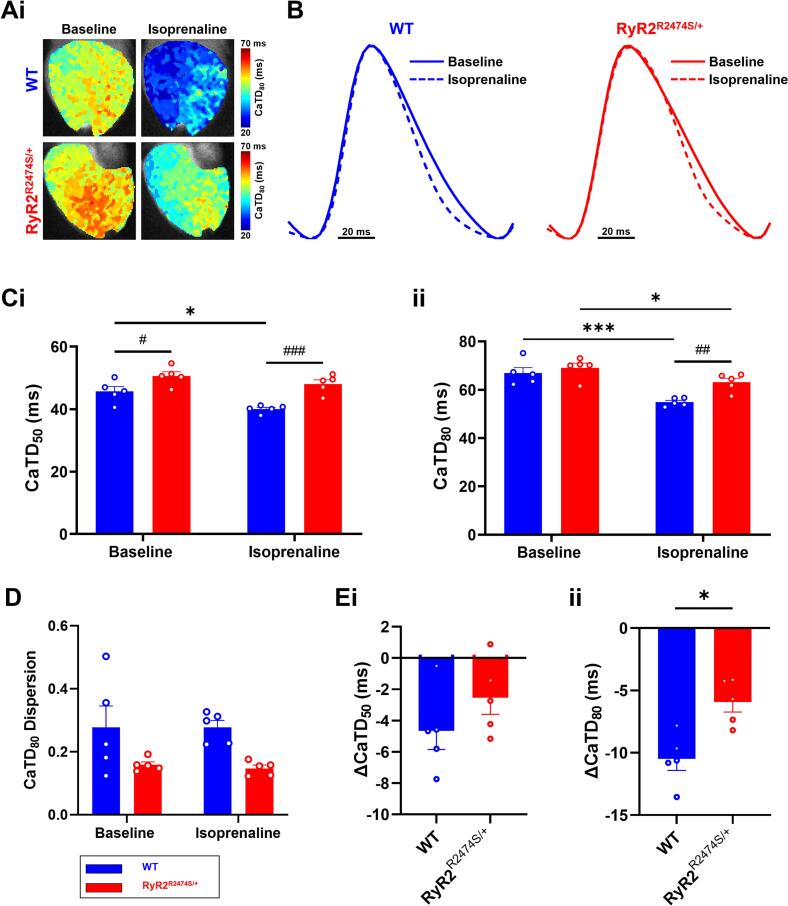
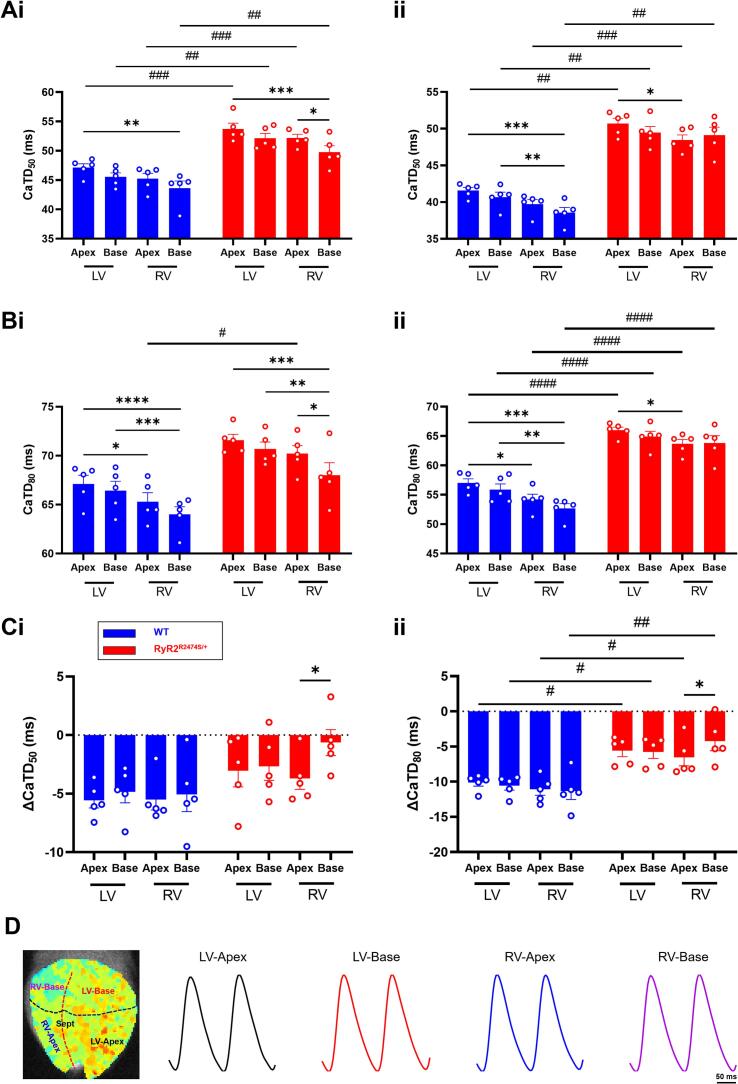
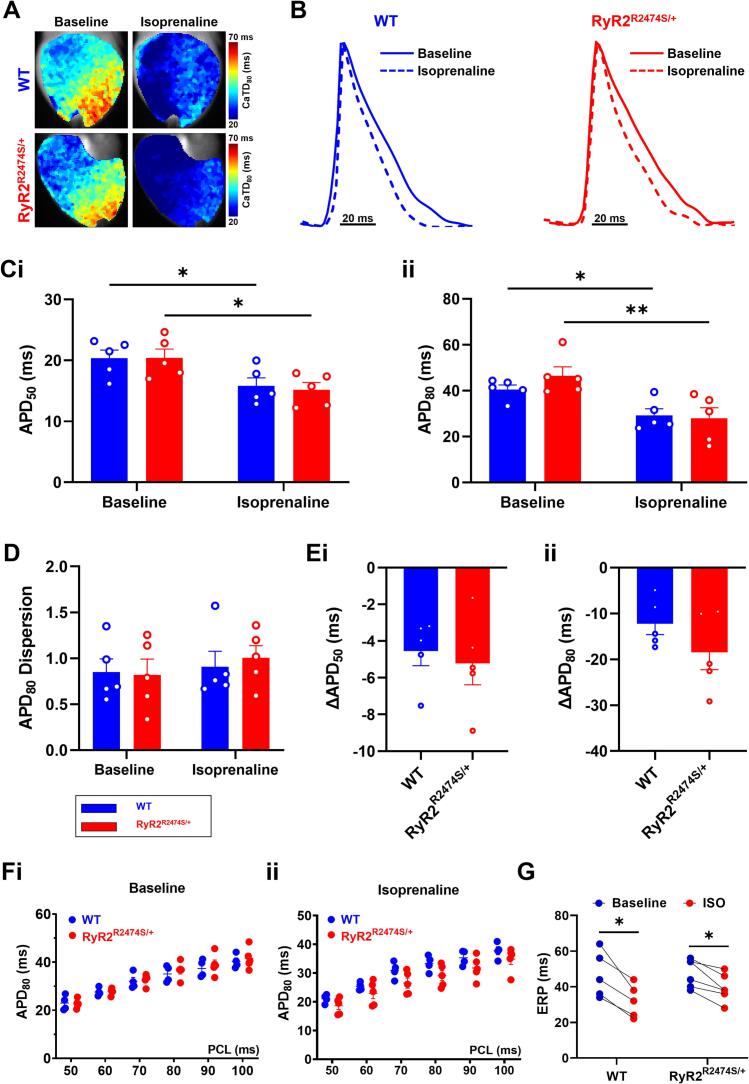
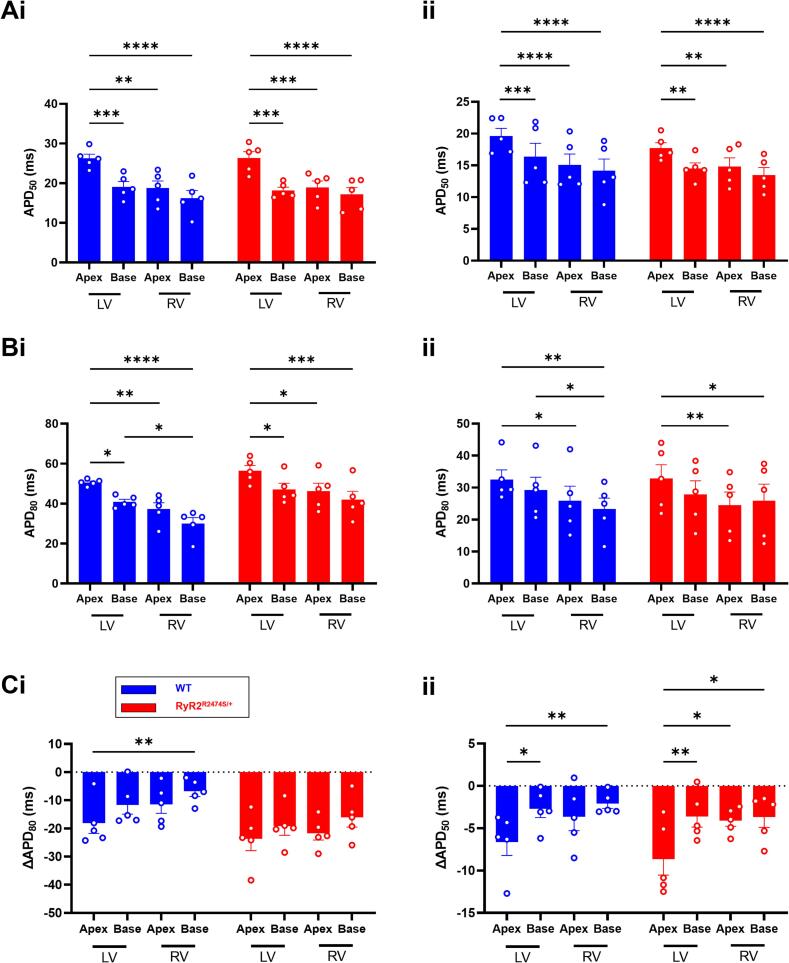
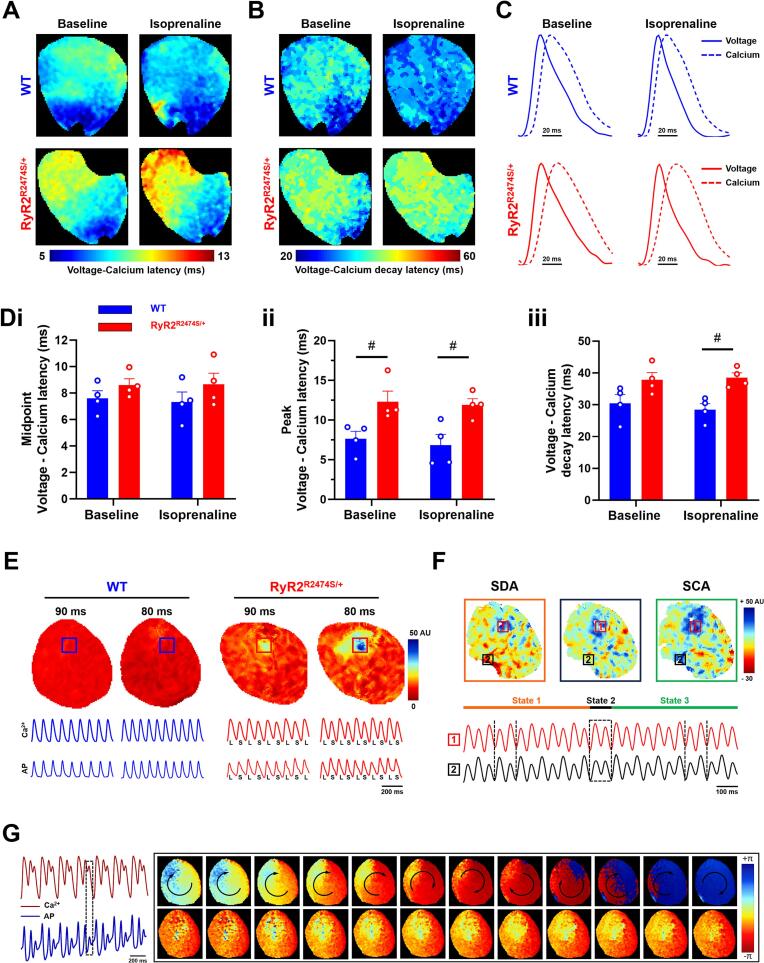
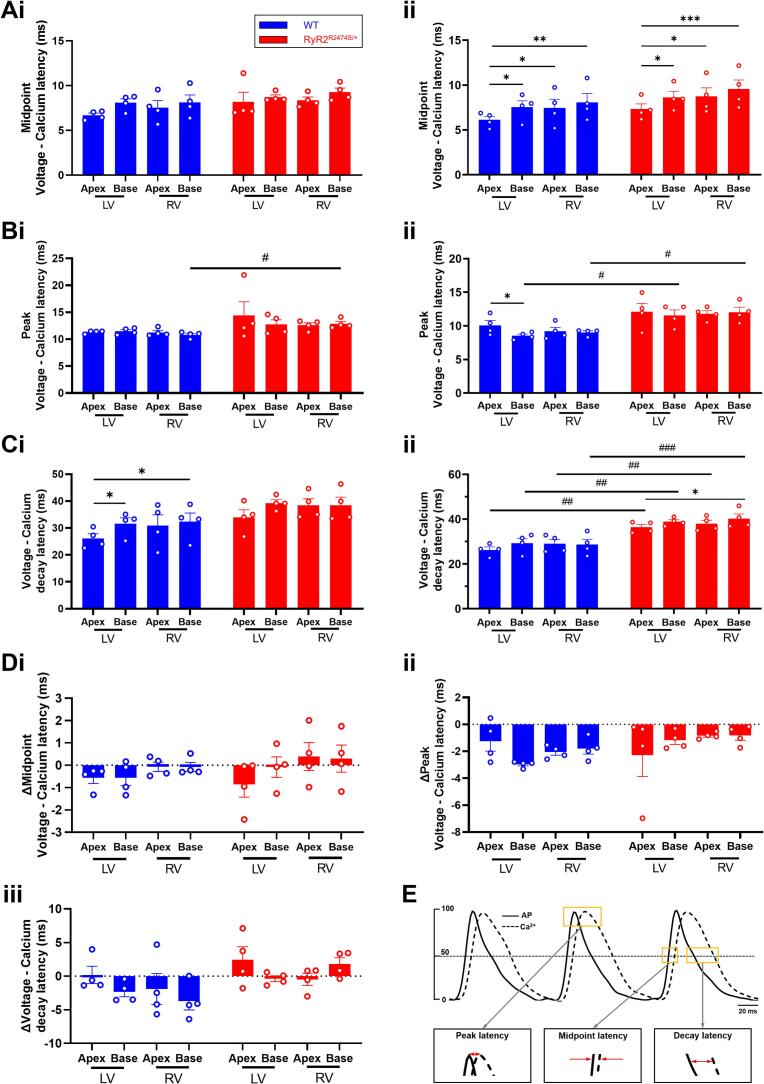
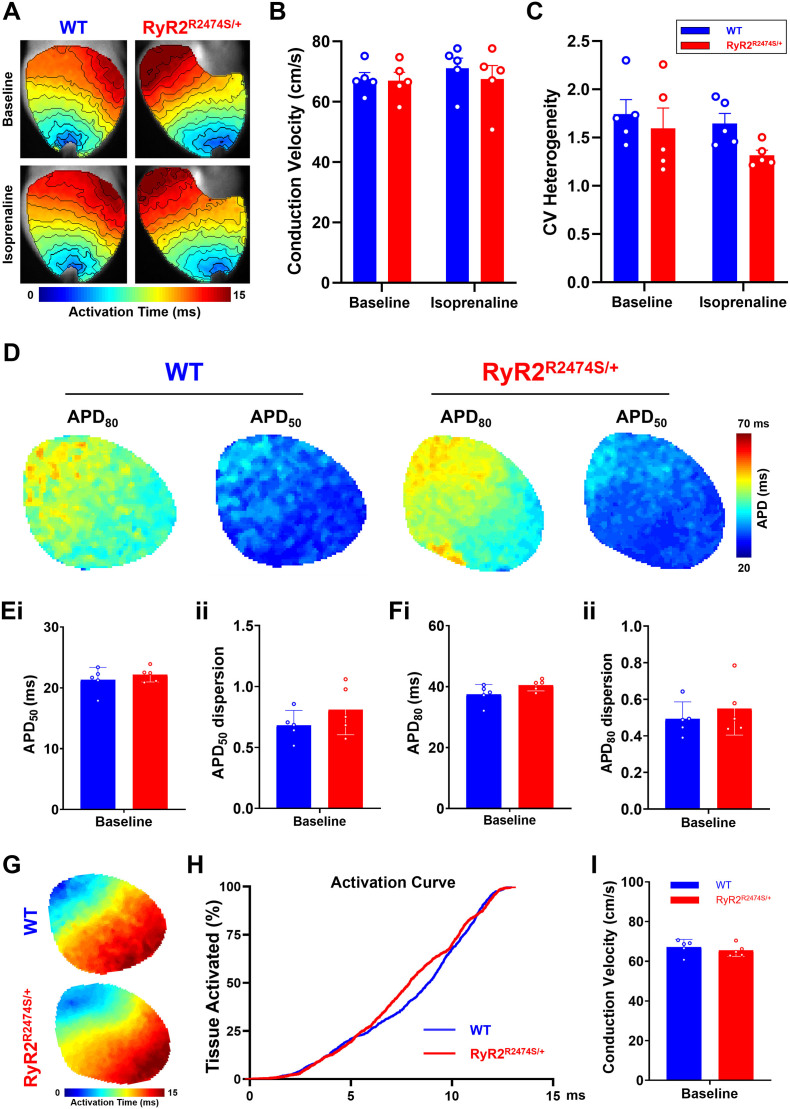
Results: ISO-challenged RyR2-R2474S/+ showed increased incidence of arrhythmia accompanied by abnormal Ca2+ transients compared to WT. CaT duration (CaTD) in the LV apex amongst regions studied both before and during ISO challenge in both WT and RyR2-R2474S/+ ventricles. RyR2-R2474S/+ ventricles showed prolonged CaTD, both before and during isoprenaline (ISO) challenge. Conversely, action potential durations (APD) were the same in WT and RyR2-R2474S/+ ventricles and identically reduced by ISO challenge. RyR2-R2474S/+ showed V m-CaT latencies at time to half decay, but not rise time to peak, which were significantly prolonged compared to WT in all ventricular regions examined with ISO challenge. Following burst pacing, ventricular localized concordant alternans in CaT and APD were readily observed in RyR2-R2474S/+ but not in WT mice. Such CaT and APD alternans occurred mostly semiannually in specific regions of the ventricular pre-occurrence of VT.
Conclusion: The pro-arrhythmic RyR2-R2474S/+ phenotype in intact hearts thus directly parallels delayed regional CaT recovery properties and alteration of V m-CaT latencies. Studies suggest that discordant localized calcium alternans are mechanistically responsible for action potential duration alternans and occurrence of VT in RyR2-R2474S/+ mice.
Keywords: Action potentials; Ca2+ transients; Catecholaminergic polymorphic ventricular tachycardia; Murine cardiac models; RyR2.
© 2024 The Authors.
Conflict of interest statement
The authors declare that the research was conducted in the absence of any commercial or financial relationships that could be construed as a potential conflict of interest.
Figures
References
-
- Leenhardt A., Lucet V., Denjoy I., Grau F., Ngoc D.D., Coumel P. Catecholaminergic polymorphic ventricular tachycardia in children. A 7-year follow-up of 21 patients. Circulation. 1995;91:1512–1519. - PubMed
LinkOut - more resources
Full Text Sources
Miscellaneous
