. 2024 Dec 4:15:1486251.
doi: 10.3389/fimmu.2024.1486251. eCollection 2024.

Integrative analysis of PANoptosis-related genes in diabetic retinopathy: machine learning identification and experimental validation

Affiliations

Integrative analysis of PANoptosis-related genes in diabetic retinopathy: machine learning identification and experimental validation

Han Chen et al. Front Immunol. .

Abstract

Background: Diabetic retinopathy (DR) is a major complication of diabetes, leading to severe vision impairment. Understanding the molecular mechanisms, particularly PANoptosis, underlying DR is crucial for identifying potential biomarkers and therapeutic targets. This study aims to identify differentially expressed PANoptosis-related genes (DE-PRGs) in DR, offering insights into the disease's pathogenesis and potential diagnostic tools.

Methods: DR datasets were obtained from the Gene Expression Omnibus (GEO) database, while PANoptosis-related genes were sourced from the GeneCards database. Differentially expressed genes (DEGs) were identified using the DESeq2 package, followed by functional enrichment analysis through DAVID and Metascape tools. Three machine learning algorithms-LASSO regression, Random Forest, and SVM-RFE-were employed to identify hub genes. A diagnostic nomogram was constructed and its performance assessed via ROC analysis. The CIBERSORT algorithm analyzed immune cell infiltration. Hub genes were validated through RT-qPCR, Western blotting, immunohistochemistry, and publicly available datasets. Additionally, the impact of FASN and PLSCR3 knockdown on HUVECs behavior was validated through in vitro experiments.

Results: Differential expression analysis identified 1,418 DEGs in the GSE221521 dataset, with 39 overlapping DE-PRGs (29 upregulated, 10 downregulated). Functional enrichment indicated that DE-PRGs are involved in apoptosis, signal transduction, and inflammatory responses, with key pathways such as MAPK and TNF signaling. Machine learning algorithms identified six PANoptosis-related hub genes (BEX2, CASP2, CD36, FASN, OSMR, and PLSCR3) as potential biomarkers. A diagnostic nomogram based on these hub genes showed high diagnostic accuracy. Immune cell infiltration analysis revealed significant differences in immune cell patterns between control and DR groups, especially in Activated CD4 Memory T Cells and Monocytes. Validation confirmed the diagnostic efficiency and expression patterns of the PANoptosis-related hub genes, supported by in vitro and the GSE60436 dataset analysis. Furthermore, experiments demonstrated that knocking down FASN and PLSCR3 impacted HUVECs behavior.

Conclusion: This study provides valuable insights into the molecular mechanisms of DR, particularly highlighting PANoptosis-related pathways, and identifies potential biomarkers and therapeutic targets for the disease.

Keywords: PANoptosis; bioinformatics analysis; biomarkers; diabetic retinopathy; differentially expressed genes; machine learning.


Conflict of interest statement

The authors declare that the research was conducted in the absence of any commercial or financial relationships that could be construed as a potential conflict of interest.

Figures

Figure 1
Figure 1
Flowchart of the research. (ns indicates no significance, *p < 0.05, **p < 0.01, ***p < 0.005, ****p < 0.0001).
Figure 2
Figure 2
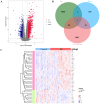
Analysis of differentially expressed PANoptosis-related genes (DE-PRGs) in DR. (A) Volcano plot showing DEGs in the GSE221521 dataset. Red dots indicate upregulated genes, blue dots indicate downregulated genes, and gray dots indicate non-significant genes. (B) Venn diagram illustrating the overlap between DEGs and PANoptosis-related genes from the GeneCards database. A total of 39 DE-PRGs were identified (29 upregulated, 10 downregulated). (C) Heatmap displaying the expression levels of the 39 overlapping DE-PRGs in the GSE221521 dataset. Red indicates upregulation, and blue indicates downregulation.
Figure 3
Figure 3
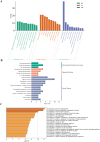
Functional enrichment analysis of DE-PRGs in DR. (A) GO enrichment analysis of DE-PRGs. The bar plot shows the top enriched GO terms across three categories: Biological Processes (BP), Cellular Components (CC), and Molecular Functions (MF). (B) KEGG pathway analysis of DE-PRGs. (C) Supplementary GO enrichment analysis performed using the Metascape online tool.
Figure 4
Figure 4
Identification of key hub genes for PANoptosis-related genes in DR using machine learning algorithms. (A-C) LASSO regression analysis: (A) Coefficient profiles of the 14 potential hub genes, (B) Tuning parameter (lambda) selection in the LASSO model using 10-fold cross-validation, and (C) ROC curve with an AUC of 0.93. (D, E) Random Forest (RF) algorithm: (D) Error rate of the RF model as a function of the number of trees, and (E) Variable importance plot ranking the genes based on their importance. (F-H) Support Vector Machine-Recursive Feature Elimination (SVM-RFE) method: (F) Bar plot of the 17 candidate biomarkers, (G) Cross-validation error curve for the SVM-RFE model, and (H) ROC curve with an AUC of 0.939. (I) Venn diagram showing the intersection of hub genes identified by RF, RF, and SVM-RFE methods, resulting in six key hub genes (BEX2, CASP2, CD36, FASN, OSMR, and PLSCR3).
Figure 5
Figure 5
Nomogram-based diagnostic evaluation for DR using six identified hub genes. (A) Nomogram developed for predicting the probability of DR based on the six hub genes (BEX2, CASP2, CD36, FASN, OSMR, and PLSCR3). (B) Calibration curve of the nomogram, showing the agreement between predicted probabilities and actual observed outcomes. (C) Decision curve analysis (DCA) demonstrating the clinical utility of the nomogram for DR diagnosis. (D-J) ROC curves for the nomogram and each of the six hub genes: (D) Nomogram, (E) BEX2, (F) CASP2, (G) CD36, (H) FASN, (I) OSMR, and (J) PLSCR3.
Figure 6
Figure 6
Gene Set Variation Analysis (GSVA) of PANoptosis-related genes. (A-F) GSVA results showing the correlation between specific PANoptosis-related genes and various signaling pathways: (A) BEX2, (B) CASP2, (C) CD36, (D) FASN, (E) PLSCR3, and (F) OSMR. The bar plots display the t-values of GSVA scores between DR and control samples.
Figure 7
Figure 7
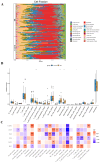
Immune cell infiltration analysis in diabetic retinopathy (DR). (A) Stacked bar plot showing the proportion of 22 types of immune cells in DR and control samples. (B) Box plot illustrating the significant differences in the proportions of Activated CD4 Memory T Cells, Monocytes, and M0 Macrophages between DR and control samples. Activated CD4 Memory T Cells were significantly downregulated in DR patients, while Monocytes and M0 Macrophages were significantly upregulated. (C) Heatmap displaying the correlation between the six hub genes (BEX2, CASP2, CD36, FASN, OSMR, and PLSCR3) and the 22 types of immune cells. *p < 0.05, **p < 0.01, ***p < 0.001.
Figure 8
Figure 8
Validation of six hub genes in diabetic retinopathy (DR) through multiple approaches. (A) RT-qPCR validation of six hub genes in clinical blood samples from DR patients compared to healthy controls. (B) IHC validation in proliferative membrane samples from PDR patients. The images show the protein expression levels of CD36, FASN and PLSCR3 in the proliferative membranes (Scale bar: 100 μm or 50 μm). (C) RT-qPCR validation of six hub genes in HUVECs exposed to high glucose conditions compared to controls. (D) The protein levels of CD36, FASN, and PLSCR3 in HUVECs were evaluated by western blot after exposure to high glucose conditions compared to controls. (E) Validation using public dataset GSE60436. (ns indicates no significance, *p < 0.05, **p < 0.01, ***p < 0.005, ****p < 0.0001).
Figure 9
Figure 9
Knockdown of FASN and PLSCR3 inhibits HUVECs proliferation and migration. (A, B) The knockdown efficiency of FASN were detected by RT-qPCR and western-blot in HUVECs. (C, D) The knockdown efficiency of PLSCR3 were detected by RT-qPCR and western-blot in HUVECs. (E) EdU assays were performed on HUVECs transfected with negative control (siNC), siRNA-FASN, and siRNA-PLSCR3 to assess cell proliferation (Scale bar: 50 μm). (F) CCK8 assays were performed on HUVECs transfected with negative control, siRNA-FASN, and siRNA-PLSCR3 to assess cell proliferation. (G) Cell migration was assessed with a wound-healing assay. Representative images and wound closure analysis at 0 and 36 h are shown (Scale bar: 200 μm). **p < 0.01; ***p < 0.001; ****p < 0.0001.

References

    1. Saeedi P, Petersohn I, Salpea P, Malanda B, Karuranga S, Unwin N, et al. . Global and regional diabetes prevalence estimates for 2019 and projections for 2030 and 2045: Results from the International Diabetes Federation Diabetes Atlas, 9th edition. Diabetes Res Clin Pract. (2019) 157:107843. doi: 10.1016/j.diabres.2019.107843 - DOI - PubMed
    1. Yau JWY, Rogers SL, Kawasaki R, Lamoureux EL, Kowalski JW, Bek T, et al. . Global prevalence and major risk factors of diabetic retinopathy. Diabetes Care. (2012) 35:556–64. doi: 10.2337/dc11-1909 - DOI - PMC - PubMed
    1. Chen L, Magliano DJ, Zimmet PZ. The worldwide epidemiology of type 2 diabetes mellitus—present and future perspectives. Nat Rev Endocrinol. (2012) 8:228–36. doi: 10.1038/nrendo.2011.183 - DOI - PubMed
    1. Cheung N, Mitchell P, Wong TY. Diabetic retinopathy. Lancet. (2010) 376:124–36. doi: 10.1016/S0140-6736(09)62124-3 - DOI - PubMed
    1. Kollias AN, Ulbig MW. Diabetic retinopathy: Early diagnosis and effective treatment. Dtsch Arztebl Int. (2010) 107:75–83; quiz 84. doi: 10.3238/arztebl.2010.0075 - DOI - PMC - PubMed

Publication types

MeSH terms