. 2024 Dec 4:15:1441028.
doi: 10.3389/fimmu.2024.1441028. eCollection 2024.

Machine learning-based diagnostic model of lymphatics-associated genes for new therapeutic target analysis in intervertebral disc degeneration

Affiliations

Machine learning-based diagnostic model of lymphatics-associated genes for new therapeutic target analysis in intervertebral disc degeneration

Maoqiang Lin et al. Front Immunol. .

Abstract

Background: Low back pain resulting from intervertebral disc degeneration (IVDD) represents a significant global social problem. There are notable differences in the distribution of lymphatic vessels (LV) in normal and pathological intervertebral discs. Nevertheless, the molecular mechanisms of lymphatics-associated genes (LAGs) in the development of IVDD remain unclear. An in-depth exploration of this area will help to reveal the biological and clinical significance of LAGs in IVDD and may lead to the search for new therapeutic targets for IVDD.

Methods: Data sets were obtained from the Gene Expression Omnibus (GEO) database. Following quality control and normalization, the datasets (GSE153761, GSE147383, and GSE124272) were merged to form the training set, with GSE150408 serving as the validation set. LAGs from GeneCards, MSigDB, Gene Ontology, and KEGG database. The Venn diagram was employed to identify differentially expressed lymphatic-associated genes (DELAGs) that were differentially expressed in the normal and IVDD groups. Subsequently, four machine learning algorithms (SVM-RFE, Random Forest, XGB, and GLM) were used to select the method to construct the diagnostic model. The receiver operating characteristic (ROC) curve, nomogram, and Decision Curve Analysis (DCA) were used to evaluate the model effect. In addition, we constructed a potential drug regulatory network and competitive endogenous RNA (ceRNA) network for key LAGs.

Results: A total of 15 differentially expressed LAGs were identified. By comparing four machine learning methods, the top five genes of importance in the XGB model (MET, HHIP, SPRY1, CSF1, TOX) were identified as lymphatics-associated gene diagnostic signatures. This signature was used to predict the diagnosis of IVDD with strong accuracy and an area under curve (AUC) value of 0.938. Furthermore, the diagnostic model was validated in an external dataset (GSE150408), with an AUC value of 0.772. The nomogram and DCA further prove that the diagnosis model has good performance and predictive value. Additionally, drug regulatory networks and ceRNA networks were constructed, revealing potential therapeutic drugs and post-transcriptional regulatory mechanisms.

Conclusion: We developed and validated a lymphatics-associated genes diagnostic model by machine learning algorithms that effectively identify IVDD patients. These five key LAGs may be potential therapeutic targets for IVDD patients.

Keywords: diagnostic model; intervertebral disc degeneration; lymphatic-associated gene; machine learning; therapeutic target.


Conflict of interest statement

The authors declare that the research was conducted in the absence of any commercial or financial relationships that could be construed as a potential conflict of interest.

Figures

Figure 1
Figure 1
Examination of immune cell infiltration in the normal group and IVDD group in the training set. (A) A bar chart of the proportion of 22 immune cells in the normal group and the IVDD group; (B) The relationship between immune infiltrating cells in the training set. Red indicates a positive relationship, blue indicates a negative relationship, with darker colors representing a stronger relationship; (C) A violin diagram of the difference in the content of 22 immune cells between the normal group and the IVDD group. Statistically significant when p < 0.05. IVDD, intervertebral disc degeneration.
Figure 2
Figure 2
Identification and analysis of DEGs in the training set. (A) The bar chart of the expression matrix of 30 samples in the training set before normalization; (B) The bar chart of the expression matrix in 30 samples in the training set after normalization; (C) Volcano plot of DEGs expression. Red indicates genes with increased expression, grey is non-significant, and green indicates genes with decreased expression; (D) Heatmap of DEGs expression. Red is the high expression and green is the low expression. DEGs, differentially expressed genes; IVDD, intervertebral disc degeneration.
Figure 3
Figure 3
Identification and functional analysis of DELAGs. (A) Veen diagram shows the intersection of DEGs and LAGs; (B) Heat map of DELAGs differential expression in normal group and IVDD group; (C) The bubble diagram of GO enrichment analysis of DELAGs, including BP, CC and MF; (D) Bubble diagram of KEGG enrichment analysis of DELAGs; (E) Description of DO enrichment analysis results of DELAGs; (F) GSEA analysis results of DELAGs in the normal group; (G) GSEA analysis results of DELAGs in the IVDD group. DEGs, differentially expressed genes; LAGs, lymphatics-associated genes; DELAGs, differentially expressed lymphatics-associated genes; GO, gene ontology; BP, biological process; CC, cellular component; MF, molecular function; KEGG, Kyoto Encyclopedia of Genes and Genomes; DO, disease ontology; GSEA, gene set enrichment analysis.
Figure 4
Figure 4
Screening of key DELAGs. (A) The box plots of residuals for the XGB, RF, SVM, and GLM models; (B) Reverse cumulative distribution of residuals in XGB, RF, SVM, and GLM models; (C) The ROC curve evaluates the diagnostic effect of XGB, RF, SVM and GLM models; (D) Feature Importance created for the GLM, RF, SVM, XGB model. XGB, Extreme Gradient Boosting; RF, Random Forest; SVM, Support vector machines; GLM, Generalized linear model.
Figure 5
Figure 5
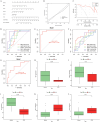
Construction and diagnostic value of the diagnostic model. (A) Model gene nomogram for the diagnosis of IVDD; (B) Calibration curve evaluation of the nomogram model; (C) DCA curves of the nomogram prediction; (D) ROC curves evaluating the diagnostic effect of five model genes in the training set; (E) The entire ROC curve for the five model genes in the training set; (F) ROC curves evaluating the diagnostic effect of five model genes in the validation set; (G) The entire ROC curve for the five model genes in the validation set; (H–L) Differential expression of model genes in the training set, MET (p = 0.0045), SPRY1 (p = 0.012) and TOX (p = 3.2 × 10⁻⁵) were lowly expressed in the IVDD group, and CSF1 (p = 0.0018) and HHIP (p = 0.049) were highly expressed in the IVDD group, p < 0.05 was statistically significant. DCA, Decision Curve Analysis; ROC, Receiver operating characteristic.
Figure 6
Figure 6
GSVA of model genes in the training set and their correlation with 28 immune cells. (A, B) GO and KEGG analysis in GSVA of MET; (C, D) GO and KEGG analysis in GSVA of HHIP; (E, F) GO and KEGG analysis in GSVA of SPRY1; (G, H) GO and KEGG analysis in GSVA of CSF1; (I, J) GO and KEGG analysis in GSVA of TOX; (K) Correlation between five model genes and 28 immune cells, red represents positive correlation, blue represents negative correlation, the darker the color the stronger the correlation. *p<0.05, **p<0.01, ***p<0.001.
Figure 7
Figure 7
Drug regulatory network and ceRNA network. (A) Prediction of drug-gene interactions for model genes, orange represents model genes, purple represents predicted drugs; (B) ceRNA network, orange circle represents model gene, green hexagon represents miRNA, and blue diamond represents lncRNA.

References

    1. GBD 2019 Diseases and Injuries Collaborators . Global burden of 369 diseases and injuries in 204 countries and territories, 1990-2019: a systematic analysis for the Global Burden of Disease Study 2019. Lancet. (2020) 396:1204–22. doi: 10.1016/S0140-6736(20)30925-9 - DOI - PMC - PubMed
    1. Peng BG. Pathophysiology, diagnosis, and treatment of discogenic low back pain. World J Orthop. (2013) 4:42–52. doi: 10.5312/wjo.v4.i2.42 - DOI - PMC - PubMed
    1. Oliver G. Lymphatic vasculature development. Nat Rev Immunol. (2004) 4:35–45. doi: 10.1038/nri1258 - DOI - PubMed
    1. Randolph GJ, Ivanov S, Zinselmeyer BH, Scallan JP. The lymphatic system: integral roles in immunity. Annu Rev Immunol. (2017) 35:31–52. doi: 10.1146/annurev-immunol-041015-055354 - DOI - PMC - PubMed
    1. Padera TP, Meijer EF, Munn LL. The lymphatic system in disease processes and cancer progression. Annu Rev BioMed Eng. (2016) 18:125–58. doi: 10.1146/annurev-bioeng-112315-031200 - DOI - PMC - PubMed

LinkOut - more resources