Clinical Trial
. 2024 Dec 4:15:1440530.
doi: 10.3389/fimmu.2024.1440530. eCollection 2024.

Dendritic cell effector mechanisms and tumor immune microenvironment infiltration define TLR8 modulation and PD-1 blockade

Affiliations
Clinical Trial

Dendritic cell effector mechanisms and tumor immune microenvironment infiltration define TLR8 modulation and PD-1 blockade

Daniel A Ruiz-Torres et al. Front Immunol. .

Abstract

The potent immunostimulatory effects of toll-like receptor 8 (TLR8) agonism in combination with PD-1 blockade have resulted in various preclinical investigations, yet the mechanism of action in humans remains unknown. To decipher the combinatory mode of action of TLR8 agonism and PD-1 blockade, we employed a unique, open-label, phase 1b pre-operative window of opportunity clinical trial (NCT03906526) in head and neck squamous cell carcinoma (HNSCC) patients. Matched pre- and post-treatment tumor biopsies from the same lesion were obtained. We used single-cell RNA sequencing and custom multiplex staining to leverage the unique advantage of same-lesion longitudinal sampling. Patients receiving dual TLR8 agonism and anti-PD-1 blockade exhibited marked upregulation of innate immune effector genes and cytokines, highlighted by increased CLEC9A+ dendritic cell and CLEC7A/SYK expression. This was revealed via comparison with a previous cohort from an anti-PD-1 blockade monotherapy single-cell RNA sequencing study. Furthermore, in dual therapy patients, post-treatment mature dendritic cells increased in adjacency to CD8+ T-cells. Increased tumoral cytotoxic T-lymphocyte densities and expanded CXCL13+CD8+ T-cell populations were observed in responders, with increased tertiary lymphoid structures (TLSs) across all three patients. This study provides key insights into the mode of action of TLR8 agonism and anti-PD-1 blockade immune targeting in HNSCC patients.

Keywords: cancer; checkpoint blockade; dendritic cells; immune response; immunotherapy.


Conflict of interest statement

Authors AP and CL were employed by company Bristol Myers Squibb.The remaining authors declare that the research was conducted in the absence of any commercial or financial relationships that could be construed as a potential conflict of interest. This study received funding from Bristol Myers Squibb. The funder was involved in the study design and sample collection, but was not involved in data collection, analysis, interpretation of data, the writing of this article or the decision to submit it for publication.

Figures

Figure 1
Figure 1
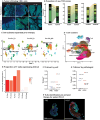
Overview of TLR8 agonism and anti-PD-1 blockade workflow and cell types identified. (A) Schematic representation of treatment and biopsy collection created with BioRender.com. The tables show the number of cells recovered after scRNAseq processing, patient biopsy site, patient response, and antibodies used for multi-immunofluorescence (mIF) imaging. (B) UMAP shows the clustering of all 41,985 cells collected in this study. (C) UMAP shows the patient contribution to the twenty-two clusters identified in (B, D) Representative image showing the mIF image of post-treatment biopsy of Pt2_R. (E, F) Cell proportions found by mIF imaging (E) and by scRNAseq (F) for all patients pre- and post-treatment. NKT, Natural Killer T cell; pDC, plasmacytoid Dendritic Cells.
Figure 2
Figure 2
TLR8 agonism and anti-PD-1 blockade increase TCR clones and Tertiary Lymphoid Structures (A) Representative image showing tumor infiltrating CD8 T cells (green) before and after anti-PD-1 blockade and TLR8 agonism for each patient. (B) An alluvial plot depicts the proportion of new TCR clones post-treatment per patient; only the top thirty clones are represented per patient. (C) A UMAP of each patient’s pre-treatment biopsy with the density of cells with a TCR expansion >10 depicts which cell subsets expanded prior to TLR8 agonism and anti-PD-1 blockade. (D) UMAP displays the 13 T cell clusters identified after isolation and sub-setting of prior recognized T and NKT clusters. (E) A bar plot with varied colors reveals the average gene expression and percentage of CXCL13-expressing cells across T cells. (F) Number of TLS/mm2 identified by mIF. (G) Number of TLS/mm2 identified by the pathologist. (H) Representative image of tertiary lymphoid structures in pre- and post-treatment biopsies from Pt2_R.
Figure 3
Figure 3
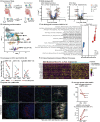
Dendritic cells effector activation in combinatorial treatment compared to monotherapy and spatial dendritic cell proximity to T cells. (A) Schematic representation of data processing and comparison between our (top) and Luoma et al. (bottom) single-cell RNA datasets, created with BioRender.com. (B) A UMAP displays the clustering and annotation of selected myeloid cells after merging the two myeloid cells from the two cohorts. (C) Percent of mature LAMP3+, conventional CD1C+, and CLEC9+XRC1+ dendritic cells. (D) A volcano plot displays the differentially expressed genes of non-plasmacytoid dendritic cells pre- vs. post-treatment in the MGH and Luoma et al. cohorts. (E) Gene Set Enrichment Analysis from the gene ontology biological processes of differentially expressed genes in non-plasmacytoid dendritic cells from the MGH cohort in pre- and post-treatment cells was performed, and a dot-plot displays the enrichment score with color representing the direction of expression for the gene sets, and size represents the number of genes involved in the analysis. (F) Heatmap display of the relative expression of selected genes from the humoral immune response gene sets for non-plasmacytoid dendritic cells pre- and post-treatment for our cohort. (G) Representative image of Pt_2_R showing the spatial behavior of CD8+ T cells (green) and LAMP3+ DC (red) pre-and post-treatment. (H) Average distance of CD8+ T cells to LAMP3+ dendritic cells (upper plot) and LAMP3+ dendritic cell density in the peritumoral area (lower plot).

Update of

References

    1. Sung H, Ferlay J, Siegel RL, Laversanne M, Soerjomataram I, Jemal A, et al. . Global cancer statistics 2020: GLOBOCAN estimates of incidence and mortality worldwide for 36 cancers in 185 countries. CA Cancer J Clin. (2021) 71:209–49. doi: 10.3322/caac.21660 - DOI - PubMed
    1. Sturgis EM, Miller RH. Second primary Malignancies in the head and neck cancer patient. Ann Otol Rhinol Laryngol. (1995) 104:946–54. doi: 10.1177/000348949510401206 - DOI - PubMed
    1. Posner MR, Hershock DM, Blajman CR, Mickiewicz E, Winquist E, Gorbounova V, et al. . Cisplatin and fluorouracil alone or with docetaxel in head and neck cancer. N Engl J Med. (2007) 357:1705–15. doi: 10.1056/NEJMoa070956 - DOI - PubMed
    1. Gooden MJ, de Bock GH, Leffers N, Daemen T, Nijman HW. The prognostic influence of tumour-infiltrating lymphocytes in cancer: a systematic review with meta-analysis. Br J Cancer. (2011) 105:93–103. doi: 10.1038/bjc.2011.189 - DOI - PMC - PubMed
    1. Uppaluri R, Campbell KM, Egloff AM, Zolkind P, Skidmore ZL, Nussenbaum B, et al. . Neoadjuvant and adjuvant pembrolizumab in resectable locally advanced, human papillomavirus-unrelated head and neck cancer: A multicenter, phase II trial. Clin Cancer Res. (2020) 26:5140–52. doi: 10.1158/1078-0432.CCR-20-1695 - DOI - PMC - PubMed

Publication types

MeSH terms