. 2024 Dec 4:15:1483887.
doi: 10.3389/fimmu.2024.1483887. eCollection 2024.

Heterogeneous immune landscapes and macrophage dynamics in primary and lung metastatic adenoid cystic carcinoma of the head and neck

Affiliations

Heterogeneous immune landscapes and macrophage dynamics in primary and lung metastatic adenoid cystic carcinoma of the head and neck

Xuelian Wang et al. Front Immunol. .

Abstract

Introduction: Recurrent or metastatic adenoid cystic carcinoma (ACC) of the head and neck is rare and highly aggressive. Due to the ineffectiveness of immune checkpoint therapies, this study aims to investigate the tumor immune microenvironment of primary tumor tissues and lung metastatic tissues and to comprehend the challenges of immunotherapy.

Methods: We analyzed RNA sequencing data and constructed immune landscapes from 25 primary tumors and 34 lung metastases. The data were then validated by immunohistochemistry and single-cell sequencing analysis.

Results: Compared to adjacent normal tissues, both primary and lung metastatic ACC showed low immune infiltration. Lung metastases had higher immune infiltration levels and antigen presentation scores but also higher T cell exclusion and dysfunction scores. Single-cell sequencing data and immunohistochemistry revealed abundant immunosuppressive tumor-associated macrophages in lung metastases. Patients with high M2 macrophage infiltration had shorter lung metastasis-free survival.

Discussion: Primary and lung metastatic ACC exhibit heterogeneous tumor immune microenvironments. Higher immune cell infiltration in lung metastases is countered by the presence of suppressive tumor-associated macrophages, which may limit effective anti-tumor responses.

Keywords: adenoid cystic carcinoma; immune evasion; lung metastasis; tumor immune microenvironment; tumor-associated macrophage.


Conflict of interest statement

The authors declare that the research was conducted in the absence of any commercial or financial relationships that could be construed as a potential conflict of interest. The author(s) declared that they were an editorial board member of Frontiers, at the time of submission. This had no impact on the peer review process and the final decision.

Figures
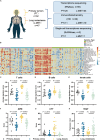
Figure 1
Figure 1
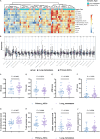
Study overview and overall immune infiltration analysis based on RNA-seq data. (A) A cohort of 79 patients with adenoid cystic carcinomas and available tumor was interrogated for immune landscapes characterization. (B) Heatmap of 28 types immune cell scores based on ssGSEA in different samples, and all cell types are defined by known marker genes (see Supplementary Table S2 ). (C, D) The statistical plots showing the average T cells (C), B cells (D) and innate cells (E) signature score in the adjacent non-tumor primary tissues (black), primary ACCs (blue), lung tissues (yellow) and lung metastases (green). (F, G) The statistical plots showing the antigen presenting machinery (APM) score (F), cytolytic activity (CYT) score (G). (H) The statistical plot showing the mRNA expression level of TIGIT. The p values in (C-H) were calculated using the two-tailed Mann–Whitney U test. Data are presented as the mean ± SEM.
Figure 2
Figure 2
Heterogeneity immune landscapes between primary ACCs and lung metastases. (A) Heatmap showing indicators that characterize the activation and suppression of immune function in primary ACCs and lung metastases. (B) Box-plot of the relative proportion of 28 types of infiltrating immune cells. (C-F) The statistical plots showing the IIS (C), TIS (D), APM (E), CYT (F) score between primary ACCs and lung metastases. (G, H) The statistical plots show the T cell dysfunction (G) and exclusion (H) score. (I, J) The mRNA expression level of CD274 (I) and CTLA4 (J) between primary ACCs and lung metastases. The p values in (B-J) were calculated using the two-tailed Mann–Whitney U test. Data are presented as the mean ± SEM. P<0.05 (*), P<0.01 (**), P<0.001 (***), P<0.0001 (****), and P>0.05 (ns).
Figure 3
Figure 3
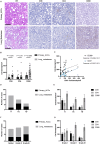
IHC confirmed that macrophages infiltration was dominant in lung metastases. (A) The typical histopathological features of the primary ACCs and lung metastases. (B) The statistical plot showing the CD8+, CD4+, CD68+ cell density per mm2. (C) Correlation between the cell density of CD8 positive cells and the cell density of CD4 and CD68 positive cells. (D) TIME classification of primary ACCs and lung metastases. (E) The cell density of CD8, CD4 and CD68 positive cells in different TIME type tumor tissues. (F) Histopathologic classification of primary ACCs and lung metastases. (G) The cell density of CD8, CD4 and CD68 positive cells in different histopathologic type tumor tissues. The p values were calculated using the two-tailed Mann–Whitney U test and Spearman correlation analysis. Data are presented as the mean ± SEM.
Figure 4
Figure 4
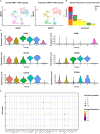
Subpopulation analysis of macrophages based on single-sell sequencing. (A) UMAP plot of 964 macrophages from primary ACC (A), adjacent primary tissue (AP), lung metastases (A1, B1, C1), and normal lung tissues (F). (B) Proportions of each sample type within each cell cluster. (C) Violin plots displaying the expression of specific genes in each cell type cluster. (D) Bubble plot displaying the top 5 highly expressed genes in each cell type cluster.
Figure 5
Figure 5
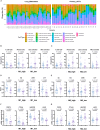
Immune landscape differences among subgroup populations grouped by TAMs. (A) Relative proportions of 22 immune cell types in each sample based on the CIBERSORT algorithm. (B) Proportions of CD8 T cells, plasma cells, activated DCs, and activated NK cells grouped by the median proportion of M1 macrophages. (C) Proportions of CD8 T cells, plasma cells, activated DCs, and activated NK cells grouped by the median proportion of M2 macrophages. (D) Scores for IIS, TIS, APM, and CYT grouped by the median proportion of M1 macrophages. (E) Scores for IIS, TIS, APM, and CYT grouped by the median proportion of M2 macrophages. (F) Expression levels of CD274, CTLA4, HAVCR2, and LAG3 grouped by the median proportion of M1 macrophages. (G) Expression levels of CD274, CTLA4, HAVCR2, and LAG3 grouped by the median proportion of M2 macrophages. The p values were calculated using the two-tailed Mann–Whitney U test. Data are presented as the mean ± SEM.
Figure 6
Figure 6
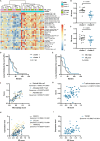
Immune phenotype and prognostic differences of lung metastases in ACC. (A) Heatmap showing unsupervised clustering analysis of lung metastasis samples based on 28 immune cell types. (B) Differences in IIS scores between Cluster I and Cluster II. (C) Differences in TIS scores between Cluster I and Cluster II. (D) Kaplan-Meier curves for lung metastasis-free survival between Cluster I and Cluster II. (E) Kaplan-Meier curves for lung metastasis-free survival between M2_high and M2_low groups. (F) Correlation analysis between macrophage scores and the scores of NK cell, activated CD8 T cell, and activated DC. (G) Correlation analysis between IIS scores and T cell exclusion scores. (H) Correlation analysis between IIS scores and the expression of CD274, CTLA4, and HAVCR2. (I) Correlation analysis between IIS scores and TGFB1 expression. The p values were calculated using the two-tailed Mann–Whitney U test in (B, C), Log-rank test in (D, E) and Spearman correlation analysis in (F–I). Data are presented as the mean ± SEM.

Similar articles

References

    1. Coca-Pelaz A, Rodrigo JP, Bradley PJ, Vander Poorten V, Triantafyllou A, Hunt JL, et al. . Adenoid cystic carcinoma of the head and neck–An update. Oral Oncol. (2015) 51:652–61. doi: 10.1016/j.oraloncology.2015.04.005 - DOI - PubMed
    1. van Weert S, Bloemena E, van der Waal I, de Bree R, Rietveld DH, Kuik JD, et al. . Adenoid cystic carcinoma of the head and neck: a single-center analysis of 105 consecutive cases over a 30-year period. Oral Oncol. (2013) 49:824–9. doi: 10.1016/j.oraloncology.2013.05.004 - DOI - PubMed
    1. Bhayani MK, Yener M, El-Naggar A, Garden A, Hanna EY, Weber RS, et al. . Prognosis and risk factors for early-stage adenoid cystic carcinoma of the major salivary glands. Cancer. (2012) 118:2872–8. doi: 10.1002/cncr.v118.11 - DOI - PubMed
    1. Imamura Y, Kiyota N, Tahara M, Hanai N, Asakage T, Matsuura K, et al. . Systemic therapy for salivary gland Malignancy: current status and future perspectives. Japanese J Clin Oncol. (2022) 52:293–302. doi: 10.1093/jjco/hyac008 - DOI - PubMed
    1. Sahara S, Herzog AE, Nör JE. Systemic therapies for salivary gland adenoid cystic carcinoma. Am J Cancer Res. (2021) 11:4092–110. - PMC - PubMed

MeSH terms