Review
. 2024 Dec 17;16(3):1017-1035.
doi: 10.1039/d4sc05188b. eCollection 2025 Jan 15.

Unravelling complex mechanisms in materials processes with cryogenic electron microscopy

Affiliations
Review

Unravelling complex mechanisms in materials processes with cryogenic electron microscopy

Minyoung Lee et al. Chem Sci. .

Abstract

Investigating nanoscale structural variations, including heterogeneities, defects, and interfacial characteristics, is crucial for gaining insight into material properties and functionalities. Cryogenic electron microscopy (cryo-EM) is developing as a powerful tool in materials science particularly for non-invasively understanding nanoscale structures of materials. These advancements bring us closer to the ultimate goal of correlating nanoscale structures to bulk functional outcomes. However, while understanding mechanisms from structural information requires analysis that closely mimics operation conditions, current challenges in cryo-EM imaging and sample preparation hinder the extraction of detailed mechanistic insights. In this Perspective, we discuss the innovative strategies and the potential for using cryo-EM for revealing mechanisms in materials science, with examples from high-resolution imaging, correlative elemental analysis, and three-dimensional and time-resolved analysis. Furthermore, we propose improvements in cryo-sample preparation, optimized instrumentation setup for imaging, and data interpretation techniques to enable the wider use of cryo-EM and achieve deeper context into materials to bridge structural observations with mechanistic understanding.


Conflict of interest statement

There are no conflicts to declare.

Figures
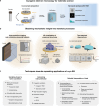
Fig. 1
Fig. 1. An overview of the use of cryo-EM for applications in materials science, and the necessary improvements for cryo-EM use as a standard technique for materials analysis. (a) Scheme for cryo-EM use in materials science. The first step is sample preparation, which involves depositing the sample onto a TEM grid, where the excess liquid can either be completely dried, or can be blotted away with a filter paper, leaving a thin liquid film that can be vitrified with the samples. The samples are then cooled using a cryogen. The cooled samples are then transferred to a TEM, where the morphologies, phases, and elemental compositions can be analyzed. (b) Obtaining mechanistic insights from cryo-EM with (1) high-resolution imaging and correlative elemental analysis such as battery processes, (2) 3D visualization of complex structures such as a PEMFC fuel cell catalyst, and (3) time-resolved observations such as ice nanocrystal growth. (c) A list of the necessary improvements for using cryo-EM as a standardized analytical tool for conventional materials science analysis.
Fig. 2
Fig. 2. High-resolution cryo-EM and correlative elemental analysis of battery materials for understanding operation mechanisms. (a) High-resolution imaging of a Li dendrite at the region of a kink, revealing local crystallographic properties of the Li dendrite (reproduced with permission from ref. , copyright 2017 AAAS). (b) Images of the SEI revealing areas with local crystallinity, in which the crystallographic phases are determined using fast Fourier transform patterns. (c) Composition profile of C, O, N along the depth of the SEI. (d) Predicted morphologies and composition of the SEI based on cryo-EM analysis (reproduced from ref. , copyright 2024 ACS Publications). (e) Scheme for an example of SEI engineering for improving battery performance. (f) Characterization of the SEI for revealing the role of SEI on performance (reproduced from ref. , copyright 2020 Nature Publishing Group).
Fig. 3
Fig. 3. High-resolution, low temperature imaging of atomic columns of quantum materials. (a–c) Models of the structure of 1T′-TaTe2 at (a) room temperature and (b) low temperatures. (c) Lattice model indicating the monoclinic unit cell. (d and e) STEM image at (d) 293 K and (e) 95 K. The insets at the top right are magnified views of images, and the insets at the bottom right are multislice simulations of HAADF-STEM images. The inset at the top left of (e) is the intensity difference map. (f and g) Fourier transforms of the STEM images at (f) 293 K and (g) 95 K. Blue circles represent superlattice peaks. (h–j) Picometer-scale mapping of charge order of Nd1/2Sr1/2Mn2O3 with (h) HAADF-STEM image at 95 K, (i) corresponding fast Fourier transform image, and (j) map of the periodic lattice displacements. (k) Atomically-resolved EELS of La0.8Sr0.2MnO3/SrTiO3 (reproduced with permission from ref. , copyright 2021 ACS Publications).
Fig. 4
Fig. 4. Techniques for associating 3D morphology with functional outcomes for preserved structures enabled by cryo-EM. (a) Schematic of the ultramicrotomy sectioning process of SSZ-13 to visualize PdO clusters embedded within the pores of the support. (b) Cryo-STEM images of sections according to different H2 treatment times (reproduced with permission from ref. , copyright 2021 Royal Society of Chemistry). (c) Schematic of a cryo-ET experiment. (d) 3D map of a catalyst obtained using cryo-ET, and analysis of 3D distribution of ionomers enabled by cryo-ET. (e) Map of local thickness of ionomers on the catalyst. (f) Distribution of the ionomer thickness plotted for different sampling and calculation methods. (Reproduced with permission from ref. , copyright 2023 Nature Publishing Group). (g) Schematic for production of the polyamide membranes. (h) 3D maps of polyamide membranes with different monomer concentrations obtained with cryo-ET. (i) Schematic for quantification of 3D morphologies of crumples (reproduced with permission from ref. , copyright 2022 AAAS).
Fig. 5
Fig. 5. Time-resolved imaging of self-assembly processes. (a–d) Cryo-EM images of structures observed during self-assembly of cyclosporin A nanoparticles after (a) 48 h, (b) 52 h, (c) 56 h, and (d) 60 h after initiation (reproduced with permission from ref. , copyright 2022 ACS Publications). (e) Schematic of the proposed crystallization pathway. (f–k) Crystallization of perylene diimides (f) observed immediately, (g) observed after 30–50 min, (h) exhibiting faceted intermediate showing crystallinity, (i) with ruptured aggregate, (j) showing growth of fibrous crystals, and (k) fully developed. (l) Schematic of the proposed crystallization pathway (reproduced with permission from ref. , copyright 2018 ACS Publications).
Fig. 6
Fig. 6. Direct observation of in situ ice growth via individual particle tracking. (a and b) High-resolution TEM images and the corresponding FFTs for (a) nucleation of cubic ice from residual water vapor within the TEM column on a graphene surface and (b) a cubic ice nanocrystal with defined facets. (Reproduced with permission from ref. , copyright 2023 Nature Publishing Group). (c) Schematic for the observation of ice crystallization in amorphous ice films. (d) Snapshots of ice crystallization of a free-standing amorphous ice film at different annealing time periods at different locations. (e) Individual particle tracking of growth over time and (f) plots of particle growth over time (reproduced with permission from ref. , copyright 2023 Nature Publishing Group).
Fig. 7
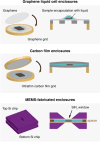
Fig. 7. Types of liquid cell enclosures that are used for encapsulating solvent and samples prior to cryogenic cooling to maintain solvated states. (Top) Graphene liquid cell enclosures, which involves the encapsulation of the sample and the surrounding solvent by sandwiching the sample between two sheets of graphene. (Middle) Carbon film enclosures, which encapsulates the sample and the solvent between two carbon grids. (Bottom) MEMS-fabricated enclosures made of Si chips and SiNx windows, designated to seal liquids between two chips.
Fig. 8
Fig. 8. Investigation and benchmarking of electron-beam effects on different samples. (a) Li dendrite image before high-resolution imaging attempt using conventional, room temperature TEM. (b) Li dendrite after beam damage caused by high electron doses after attempting high-resolution (reproduced with permission from ref. , copyright 2017 AAAS). (c) Example of heating-induced crystallization of ice, which is the intended process to be observed. (d) Example of beam-induced crystallization of ice from continuous irradiation, which produces artifacts that are different from the crystallization process observed by heating (reproduced with permission from ref. , copyright 2023 Nature Publishing Group). (e–l) Aligned and summed images of the protein hemoglobin embedded in vitreous ice, in which (a and e) are low-flux, (b and f) are medium-flux, (c and g) are high-flux, and (d and h) are high-flux short-exposure. (a–d) are 50 e Å−2 and (e–h) are 250 e Å−2. (m) Plots of FRPR and FRC according to different dose rates calculated in MGy, providing information on the changes in low-resolution information according to accumulated dose. The threshold value of 45 deg for FRPR and 0.5 for FRC can be used to benchmark imaging dose rates (reproduced with permission from ref. , copyright 2011 IUCr Journals).
Fig. 9
Fig. 9. Large-scale data acquisition and analysis for addressing heterogeneity in nanoscale structures. In this workflow, a sample of interest loaded on a TEM grid is scanned with automated imaging, acquiring a large number of images from multiple areas of the TEM grid to achieve a sufficient sample size. The large number of images are then fed through a neural network for segmentation of features. Then, depending on the features observed, morphological parameters can be extracted and classified using machine learning.

Similar articles

References

    1. Pfeifer M. A. Williams G. J. Vartanyants I. A. Harder R. Robinson I. K. Nature. 2006;442:63–66. doi: 10.1038/nature04867. - DOI - PubMed
    1. Azubel M. Koivisto J. Malola S. Bushnell D. Hura G. L. Koh A. L. Tsunoyama H. Tsukuda T. Pettersson M. Häkkinen H. Kornberg R. D. Science. 2014;345:909–912. doi: 10.1126/science.1251959. - DOI - PMC - PubMed
    1. Kim B. H. Heo J. Kim S. Reboul C. F. Chun H. Kang D. Bae H. Hyun H. Lim J. Lee H. Han B. Hyeon T. Alivisatos A. P. Ercius P. Elmlund H. Park J. Science. 2020;368:60–67. doi: 10.1126/science.aax3233. - DOI - PubMed
    1. Jeon S. Heo T. Hwang S.-Y. Ciston J. Bustillo K. C. Reed B. W. Ham J. Kang S. Kim S. Lim J. Lim K. Kim J. S. Kang M.-H. Bloom R. S. Hong S. Kim K. Zettl A. Kim W. Y. Ercius P. Park J. Lee W. C. Science. 2021;371:498–503. doi: 10.1126/science.aaz7555. - DOI - PubMed
    1. Wietfeldt H. Meana-Pañeda R. Machello C. Reboul C. F. Van C. T. S. Kim S. Heo J. Kim B. H. Kang S. Ercius P. Park J. Elmlund H. Commun. Chem. 2024;7:4. doi: 10.1038/s42004-023-01087-x. - DOI - PMC - PubMed

LinkOut - more resources