. 2024 Dec 4:15:1475582.
doi: 10.3389/fneur.2024.1475582. eCollection 2024.

Integrative multi-omics approach using random forest and artificial neural network models for early diagnosis and immune infiltration characterization in ischemic stroke

Affiliations

Integrative multi-omics approach using random forest and artificial neural network models for early diagnosis and immune infiltration characterization in ischemic stroke

Ling Lin et al. Front Neurol. .

Abstract

Background: Ischemic stroke (IS) is a significant global health issue, causing high rates of morbidity, mortality, and disability. Since conventional Diagnosis methods for IS have several shortcomings. It is critical to create new Diagnosis models in order to enhance existing Diagnosis approaches.

Methods: We utilized gene expression data from the Gene Expression Omnibus (GEO) databases GSE16561 and GSE22255 to identify differentially expressed genes (DEGs) associated with IS. DEGs analysis using the Limma package, as well as GO and KEGG enrichment analyses, were performed. Furthermore, PPI networks were constructed using DEGs from the String database, and Random Forest models were utilized to screen key DEGs. Additionally, an artificial neural network model was developed for IS classification. Use the GSE58294 dataset to evaluate the effectiveness of the scoring model on healthy controls and ischemic stroke samples. The effectiveness of the scoring model was evaluated through AUC analysis, and CIBERSORT analysis was conducted to estimate the immune landscape and explore the correlation between gene expression and immune cell infiltration.

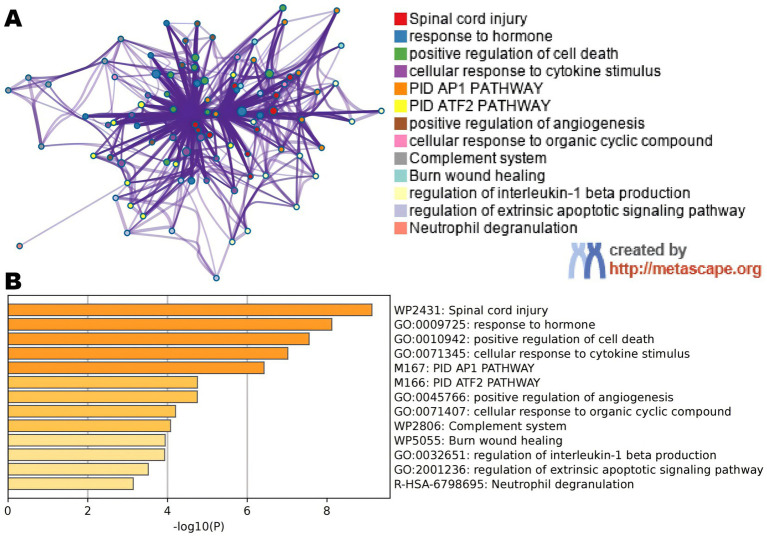
Results: A total of 26 significant DEGs associated with IS were identified. Metascape analysis revealed enriched biological processes and pathways related to IS. 10 key DEGs (ARG1, DUSP1, F13A1, NFIL3, CCR7, ADM, PTGS2, ID3, FAIM3, HLA-DQB1) were selected using Random Forest and artificial neural network models. The area under the ROC curve (AUC) for the IS classification model was found to be near 1, indicating its high accuracy. Additionally, the analysis of the immune landscape demonstrated elevated immune-related networks in IS patients compared to healthy controls.

Conclusion: The study uncovers the involvement of specific genes and immune cells in the pathogenesis of IS, suggesting their importance in understanding and potentially targeting the disease.

Keywords: artificial neural network; diagnosis model; differentially expressed genes; ischemic stroke; random forest.


Conflict of interest statement

The authors declare that the research was conducted without any commercial or financial relationships that could be seen as a potential conflict of interest.

Figures

Figure 1
Figure 1
Flowchart.
Figure 2
Figure 2
(A) A volcano plot displaying the findings of differential expression. Black dots represent the remaining functioning genes. (B) A heatmap in degrees. The colors on the chart vary from red to green, indicating strong to low expressiveness. The red bars in the heatmap’s top half reflect sick samples, whereas the blue bars represent healthy samples.
Figure 3
Figure 3
(A) An improved term network. Notes are colored using cluster IDs, and notes with the same cluster ID are frequently near to one other. (B) Colored bar plot of p-value for enlarged DEGs phrases.
Figure 4
Figure 4
Graph displaying the results of the enrichment analysis. A bar graph is produced as a result of GO enrichment. The log 10 (adj p) values are represented on the y-axis, while the z-scores are plotted on the x-axis.
Figure 5
Figure 5
Graph displaying the results of the enrichment analysis. Gene clustering circles, with the inner circles representing DEGs, the red circles representing up-regulated genes, the blue circles representing down-regulated genes, and the outside circles representing GO keywords.
Figure 6
Figure 6
Graph displaying the results of the enrichment analysis. GO enrichment circle map. On the left are DEGs, with red bands indicating up-regulated genes and blue bands representing down-regulated genes. The various colored ribbons on the right indicate various GO ideas. Connecting lines represent genes that are included in GO terms.
Figure 7
Figure 7
Graph displaying the results of the enrichment analysis. A bar graph displaying the findings of KEGG pathway enrichment. The log 10 (adj p) values are represented on the y-axis, while the z-scores are plotted on the x-axis. A bar graph represents the KEGG pathway, and the size of the histogram shows the number of genes in the route.
Figure 8
Figure 8
Graph displaying the results of the enrichment analysis. Gene clustering circles: the red circles represent up-regulated genes, the blue circles represent down-regulated genes, and the outside circles represent KEGG elements.
Figure 9
Figure 9
Graph displaying the results of the enrichment analysis. Diagram of KEGG pathway enrichment. DEGs are depicted on the left, with red bands representing up-regulated genes and blue bands representing down-regulated genes. On the right, different colored ribbons represent different pathways. Connecting lines reflect the roles of genes in this pathway.
Figure 10
Figure 10
(A) The number of trees used influences the mistake rate. The x-axis represents the number of decision trees, while the y-axis represents the mistake rate. (B) To obtain the random forest classifier results, use the Gini coefficient approach. (C) Unsupervised clustering heatmap displaying hierarchical clustering of 10 important genes created by random forest when the GSE16561 and GSE22255 datasets were combined. Normal samples are represented by the red bands above the heatmap, while IS samples are represented by the blue bands. Red genes have high expression levels in the samples, whereas blue genes have low or undetectable expression levels in the samples.
Figure 11
Figure 11
(A) Visualization of a neural network. (B) Training set for validating ROC curve results (merged dataset of GSE16561 and GSE22255). (C) The testing team examines the ROC curve results (combined dataset of GSE58294).
Figure 12
Figure 12
The immunological landscape of IS. (A) The CIBERSORT algorithm was used to forecast the proportions of 22 immune-cell types in the control and treatment groups. (B) Immune cell infiltrating correlation analysis. (C) Analysis of 22 immune-cell subsets in the control and treatment groups.

Similar articles

References

    1. Ma Q, Li R, Wang L, Yin P, Wang Y, Yan C, et al. . Temporal trend and attributable risk factors of stroke burden in China, 1990-2019: an analysis for the global burden of disease study 2019. Lancet Public Health. (2021) 6:e897–906. doi: 10.1016/s2468-2667(21)00228-0, PMID: - DOI - PMC - PubMed
    1. Stinear CM, Lang CE, Zeiler S, Byblow WD. Advances and challenges in stroke rehabilitation. Lancet Neurol. (2020) 19:348–60. doi: 10.1016/s1474-4422(19)30415-6 - DOI - PubMed
    1. Markus HS. New World stroke organization global stroke guidelines, and minimally invasive surgery improves outcome for lobar intracerebal haemorrhage. Int J Stroke. (2023) 18:496–8. doi: 10.1177/17474930231174937, PMID: - DOI - PubMed
    1. Lindsay MP, Norrving B, Sacco RL, Brainin M, Hacke W, Martins S, et al. . World stroke organization (WSO): global stroke fact sheet 2019. Int J Stroke. (2019) 14:806–17. doi: 10.1177/1747493019881353, PMID: - DOI - PubMed
    1. Powers WJ, Rabinstein AA, Ackerson T, Adeoye OM, Bambakidis NC, Becker K, et al. . Guidelines for the early Management of Patients with Acute Ischemic Stroke: 2019 update to the 2018 guidelines for the early Management of Acute Ischemic Stroke: a guideline for healthcare professionals from the American Heart Association/American Stroke Association. Stroke. (2019) 50:e344–418. doi: 10.1161/str.0000000000000211, PMID: - DOI - PubMed

LinkOut - more resources