. 2024 Sep 5;5(3):471-496.
doi: 10.20517/evcna.2024.38. eCollection 2024.

Assessment of NanoString technology as a tool for profiling circulating miRNA in maternal blood during pregnancy

Affiliations

Assessment of NanoString technology as a tool for profiling circulating miRNA in maternal blood during pregnancy

Petra Adamova et al. Extracell Vesicles Circ Nucl Acids. .

Abstract

Aim: Circulating maternal MicroRNA (miRNA) is a promising source of biomarkers for antenatal diagnostics. NanoString nCounter is a popular global screening tool due to its simplicity and ease of use, but there is a lack of standardisation in analysis methods. We examined the effect of user-defined variables upon reported changes in maternal blood miRNA during pregnancy.

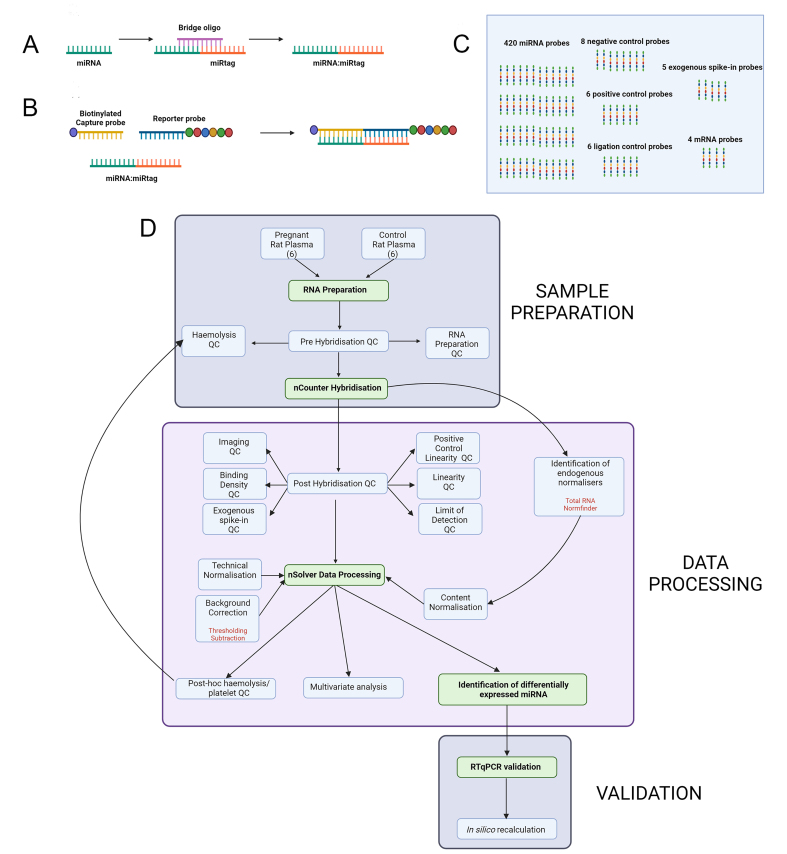
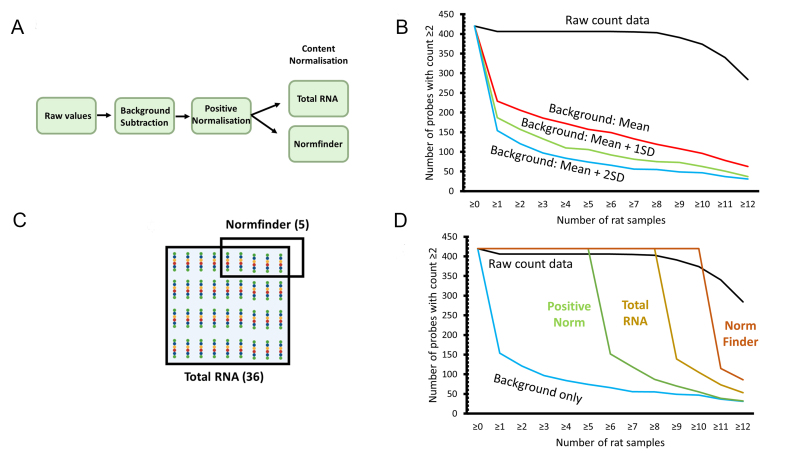
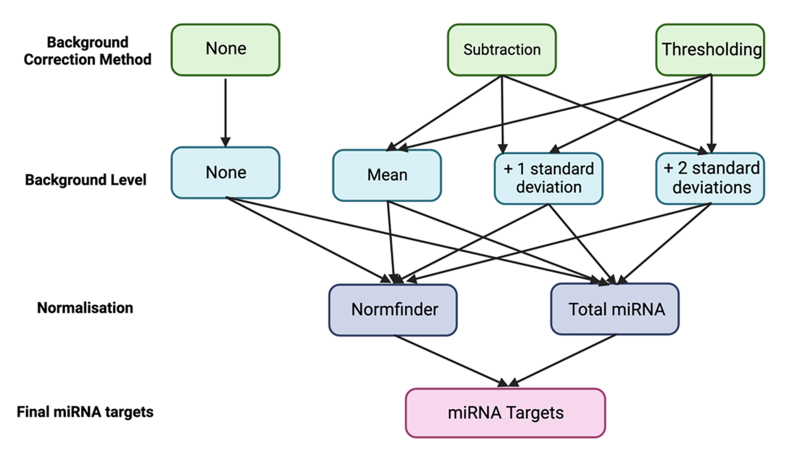
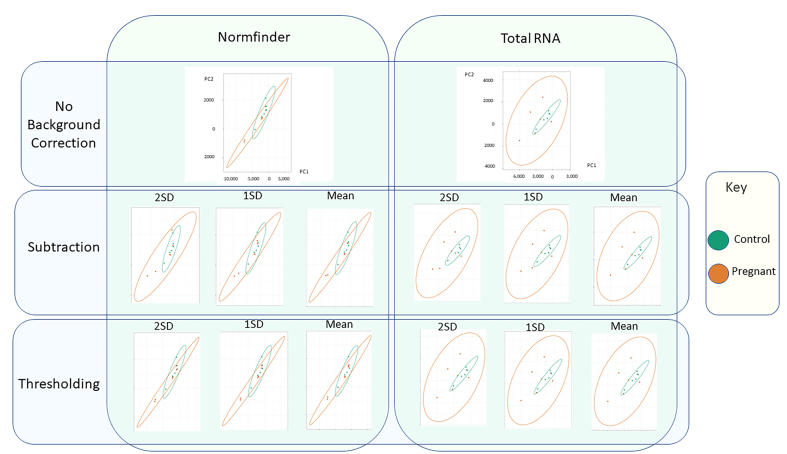
Methods: Total RNA was prepared from the maternal blood of pregnant and control rats. miRNA expression was profiled using Nanostring nCounter. Raw count data were processed using nSolver using different combinations of normalisation and background correction methods as well as various background thresholds. A panel of 14 candidates in which changes were supported by multiple analysis workflows was selected for validation by RT-qPCR. We then reverse-engineered the nSolver analysis to gain further insight.

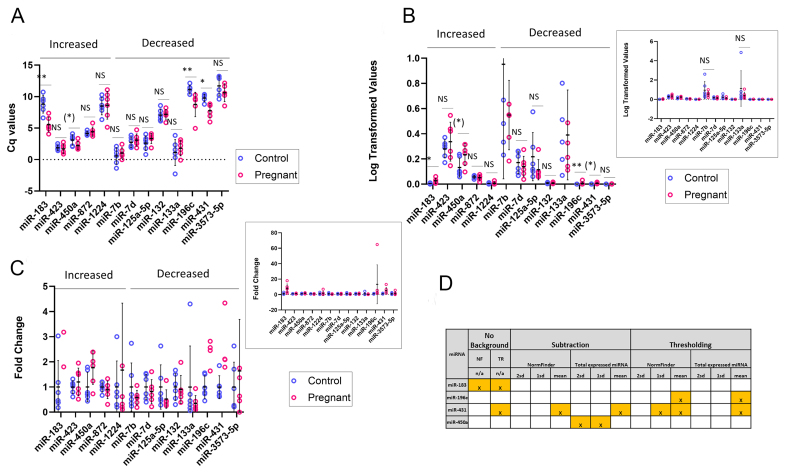
Results: Thirty-one putative differentially expressed miRNAs were identified by nSolver. However, each analysis workflow produced a different set of reported biomarkers and none of them was common to all analysis methods. Four miRNAs with known roles in pregnancy (miR-183, miR-196c, miR-431, miR-450a) were validated. No single nSolver analysis workflow could successfully identify all four validated changes. Reverse engineering revealed errors in nSolver data processing which compound the inherent problems associated with background correction and normalisation.

Conclusion: Our results suggest that user-defined variables greatly influence the output of the assay. This highlights the need for standardised nSolver data analysis methods and detailed reporting of these methods. We suggest that investigators in the future should not rely on a single analysis method to identify changes and should always validate screening results.

Keywords: Micro RNA; blood biomarker; expression profiling; pregnancy.


Conflict of interest statement

All authors declared that there are no conflicts of interest.

Figures

Figure 1
Figure 1
Overview of the experiment. miRNA: MicroRNA; A and B: principle of the Nanostring nCounter assay; A: miRNAs (green) are too short for standard probe attachment. To overcome this, a temporary bridging oligo (purple) is used to extend the length of each miRNA through the attachment of a DNA-based miRtag (orange) by splinted ligation; B: during the hybridisation step, the extended miRNA: miRtag is hybridised to a biotin-tagged capture probe (yellow) and a reporter probe (blue) carrying a unique fluorescent barcode tag (6 coloured circles). After washing, the target/probe complexes are immobilised to a solid substrate using the biotin tag and data recorded from the barcode as individual counts; C: set-up of the rat v1.5 miRNA codeset, which contains probes for 420 rat miRNAs as well as positive, negative and ligation controls, exogenous spike-in controls and housekeeping mRNA probes; D: flowchart to illustrate the workflow described in this paper. Figure made with Biorender.
Figure 2
Figure 2
Rat oestrus cycle and mating monitoring. ACE: Anucleated cornified epithelial cell; NEC: nucleated epithelial cell; L: leukocyte; A-E: images show rat vaginal smears stained with toluidine blue to label DNA; F: graphical representation of the 4-5 day long rat oestrus cycle representing the proportions of cell types present in each phase. F is adapted from[45].
Figure 3
Figure 3
RNA preparation quality control - detection of spike in controls and stably expressed plasma miRNA. Thresholds were set in the exponential phase of amplification (0.01 ΔRn) and the same threshold was used for each miRNA. miRNA: MicroRNA; A-E: graphs show the quantification cycle (Cq) of the indicated miRNA for each of the 12 rats; F: table to show the percentage coefficient of variance of Cq value for each probe within each group. Single technical replicate per rat due to limited sample availability, 6 biological replicates per group as show.
Figure 4
Figure 4
Haemolysis analysis quality control. The graph shows the ratio of miR-23-3p expression divided by miR-451a expression calculated from the difference in Cq values. Cq: Quantification cycle. The threshold indicates a ratio of 5, which is considered to indicate haemolysis. Single technical replicate per rat due to limited sample availability, 6 biological replicates per group as shown. Thus, sample preparation [Figure 1D upper box] was successful and all samples passed quality control.
Figure 5
Figure 5
Effect of background correction and normalisation on probe count. SD: Standard deviation; A: flowchart to illustrate the order of data processing in this analysis. Raw count data were first subjected to background subtraction at one of three thresholds (mean, mean + 1 SD, mean + 2SD), they were then normalised using positive control probes before undergoing content normalisation by either the total RNA or Normfinder method; B: effect of background subtraction, the graph shows the number of probes with a count above 2 that were detected in the 12 rat samples. The unprocessed raw count data are shown at the top (black line), followed by processed data using 3 background thresholds (red, blue, green); C: in our analysis, a panel of 36 probes was used as normalisers for the total RNA method, a subset of 5 of the most stable of these was used for Normfinder normalisation; D: effect of normalisation, data plotted as shown in c. The unprocessed raw count data are shown at the top (black line). All processed data use a background threshold of mean + 2 SD (blue). Green line shows the effect of applying positive control normalisation to the background subtracted data, while gold and orange lines show the effect upon these data of subsequent content normalisation by total RNA and Normfinder methods, respectively.
Figure 6
Figure 6
nSolver data processing workflows used in this analysis. Visual representation of the 14 different nSolver analysis workflows used in this study to process raw count data. These differed in the method of background correction (green), background level stringencies (light blue), and normalisation methods (purple), as indicated.
Figure 7
Figure 7
Multivariate analysis of nSolver processed data. Graphs show unsupervised PCA for each of the 14 nSolver workflows. A spot is shown for each rat and an ellipse shows the variation within each group. Green shows the control group and orange the pregnant. PCA: Principal component analysis.
Figure 8
Figure 8
Validation of miRNA expression changes. miRNA: MicroRNA; Cq: quantification cycle; A-C: target validation by miRcury RT-qPCR. Three technical replicates were performed for each of 6 biological samples per group. The mean value of each biological sample is plotted as a circle (blue: control; red: pregnant). Bars show the mean and standard deviation for each group. miRNAs are grouped as Increased or Decreased in reference to the change observed in pregnancy relative to controls in the nCounter assay. *P < 0.05 in 2-tailed test; **P < 0.005 in 2-tailed test; (*) P < 0.05 in 1-tailed test; NS: not significant; A: ΔCq values are plotted; B: 2-ΔCq values are plotted. Inset shows the same data plotted on a different y-axis scale; C: Fold change values are plotted. Mean expression in control groups was set to 1 for each probe. Inset shows the same data plotted on a different y-axis scale; D: Table showing the nSolver analysis results for the 4 validated changes. Workflows correctly identifying each miRNA are highlighted in yellow and marked with an X.
Figure 9
Figure 9
In silico recalculation of nSolver data processing. NF: Normfinder; TR: total RNA method; A: flowcharts to illustrate differences in the order of data processing steps within the three workflow subtypes; B: results of recalculations for the 4 validated miRNA changes. × indicates a nSolver automated workflow that identified a significant change in the given mRNA. Colour coding indicates the results of recalculation. green: recalculation agrees with nSolver; red: recalculation does not agree (nSolver positive, recalculation negative); blue: recalculation does not agree (nSolver negative, recalculation positive); yellow: recalculation t-test agrees but errors found in calculation.

Similar articles

References

    1. Kang L, Cao G, Jing W, Liu J, Liu M. Global, regional, and national incidence and mortality of congenital birth defects from 1990 to 2019. Eur J Pediatr. 2023;182:1781–92. doi: 10.1007/s00431-023-04865-w. - DOI - PubMed
    1. Pagel C, Brown KL, Crowe S, Utley M, Cunningham D, Tsang VT. A mortality risk model to adjust for case mix in UK paediatric cardiac surgery. Health Serv Deliv Res. 2013:1. doi: 10.3310/hsdr01010. - DOI - PubMed
    1. Ferentzi H, Pfitzer C, Rosenthal LM, Berger F, Schmitt KRL. Long-term early development research in congenital heart disease (LEADER-CHD): a study protocol for a prospective cohort observational study investigating the development of children after surgical correction for congenital heart defects during the first 3 years of life. BMJ Open. 2017;7:e018966. doi: 10.1136/bmjopen-2017-018966. - DOI - PMC - PubMed
    1. Plana MN, Zamora J, Suresh G, Fernandez-Pineda L, Thangaratinam S, Ewer AK. Pulse oximetry screening for critical congenital heart defects. Cochrane Database Syst Rev. 2018;3:CD011912. doi: 10.1002/14651858.cd011912.pub2. - DOI - PMC - PubMed
    1. Bonnet D. Impacts of prenatal diagnosis of congenital heart diseases on outcomes. Transl Pediatr. 2021;10:2241–9. doi: 10.21037/tp-20-267. - DOI - PMC - PubMed

LinkOut - more resources