. 2024 Nov 30;13(11):6136-6153.
doi: 10.21037/tcr-24-562. Epub 2024 Nov 19.

A novel immune-related gene prognostic signature combining immune cell infiltration and immune checkpoint for glioblastoma patients

Affiliations

A novel immune-related gene prognostic signature combining immune cell infiltration and immune checkpoint for glioblastoma patients

Xu Liu et al. Transl Cancer Res. .

Abstract

Background: Glioblastoma (GBM) is a highly lethal brain tumor with a complex tumor microenvironment (TME) and poor prognosis. This study aimed to develop and validate a novel immune-related prognostic model for GBM patients to enhance personalized prognosis prediction and develop effective therapeutic strategies.

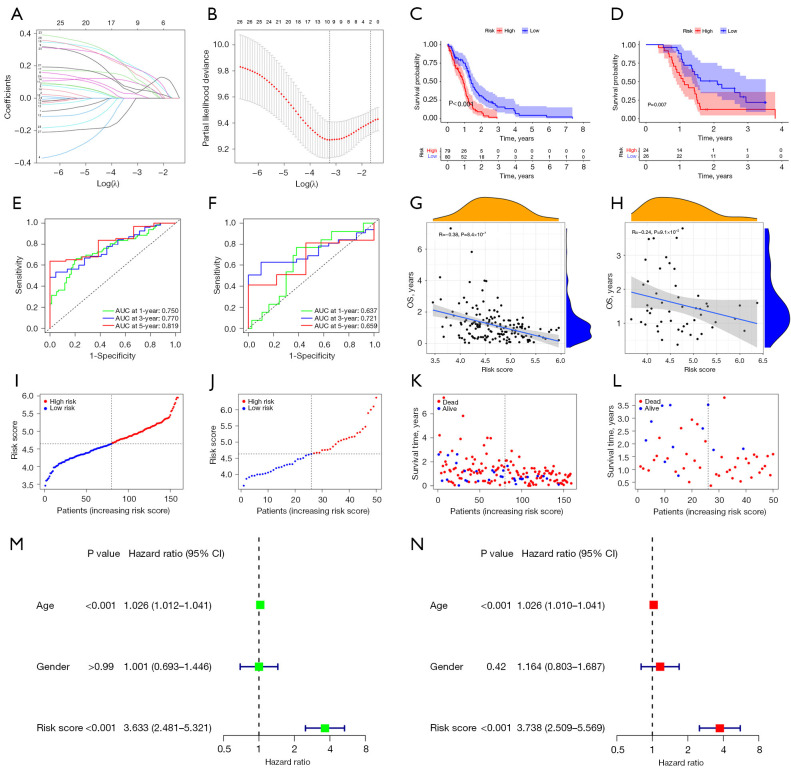
Methods: RNA sequencing and clinical data for GBM patients were obtained from The Cancer Genome Atlas (TCGA) and the Gene Expression Omnibus (GEO) (GSE83300). Single-sample gene set enrichment analysis (ssGSEA) was performed using the gene set variation analysis (GSVA) package in R to classify the samples into high and low immune infiltration clusters based on 29 immune cell subtypes. Clustering validations included differential analysis of immune scores and comparison of human leukocyte antigen (HLA) family expression and immune cell subtypes. Kyoto Encyclopedia of Genes and Genomes (KEGG) pathway analysis and Gene Ontology (GO) analysis compared molecular mechanisms and cellular functions between clusters. Differentially expressed immune-related genes between the high and low immune infiltration clusters were screened out, and the prognostic immune-related genes (PIGs) were identified using univariate Cox regression. Co-expression analysis between PIGs and transcription factors (TFs) (Cistrome) was conducted, and a protein-protein interaction (PPI) network (STRING) was constructed. Least absolute shrinkage and selection operator (LASSO) regression constructed a prognostic model. Correlation analyses between PIGs, immune infiltrates, and GBM-related genes were performed. Tumor mutation burden (TMB) analysis and a nomogram incorporating age, gender, and risk score were developed for individualized prognosis prediction.

Results: A total of 312 differentially expressed immune-related genes were identified between high and low immune infiltration clusters. Of these, 28 genes were correlated with GBM prognosis. LASSO regression identified 10 genes (CLCF1, PTX3, TNFRSF14, SDC2, VGF, AREG, PLAUR, GRN, AQP9, and IGLV6-57) for the prognostic model. Patients were divided into high-risk and low-risk groups based on risk scores. Survival analysis showed significantly better overall survival (OS) for the low-risk group (P<0.05). The prognostic signature was validated as an independent prognostic factor. Correlation analyses demonstrated significant associations between the prognostic model, immune cell infiltrates, GBM-related genes, and immune checkpoint-related genes. A nomogram incorporating age, gender, and risk score was developed for personalized prognosis prediction.

Conclusions: In summary, our study provided a novel prognostic model based on ssGSEA for GBM patients and offered potential insights for understanding the tumor immune and molecular mechanisms of the disease.

Keywords: Glioblastoma (GBM); gene; immune infiltration; prognostic model; single-sample gene set enrichment analysis (ssGSEA).


Conflict of interest statement

Conflicts of Interest: Both authors have completed the ICMJE uniform disclosure form (available at https://tcr.amegroups.com/article/view/10.21037/tcr-24-562/coif). The authors have no conflicts of interest to declare.

Figures

Figure 1
Figure 1
Construction and validation of immune clustering. (A,B) Heatmap and violin plots showing the Immune Score, Stroma Score, ESTIMATE Score, and Tumor Purity of two clusters according to the “estimate” algorithm. (C) Boxplots displaying the differentially expressed genes of the HLA family between two clusters. (D) Boxplots showing the proportions of 22 immune cell subtypes of two clusters according to the “CIBERSORT” algorithm. *, P<0.05; **, P<0.01; ***, P<0.001. MHC, major histocompatibility complex; pDCs, plasmacytoid dendritic cells; IFN, interferon; aDCs, activated dendritic cells; APC, antigen-presenting cells; TIL, tumor infiltrating lymphocytes; Treg, regulatory T cells; CCR, C-C chemokine receptor; HLA, human leukocyte antigen; iDCs, immature dendritic cells; DCs, dendritic cells; Tfh, T follicular helper cells; NK, natural killer; TME, tumor microenvironment; Immunity-L, low immune infiltration; Immunity-H, high immune infiltration.
Figure 2
Figure 2
Bubble charts showing the results of Gene Set Enrichment Analysis. (A) Top 16 results of GO analysis. (B) Top 11 results of KEGG analysis. FDR, false discovery rate; NES, normalized enrichment score; GO, Gene Ontology; KEGG, Kyoto Encyclopedia of Genes and Genomes.
Figure 3
Figure 3
Identification of differentially expressed immune-related genes. (A) Volcano plot showing 1,855 DEGs, including 859 genes with lower expression (green) and 996 genes with higher expression (red) in the Immune-H cluster. (B) Venn diagram showing the intersection of DEGs and immune-related genes (n=312). (C) Heatmap showing 31 DEGs with higher expression in the Immune-L cluster and 281 DEGs with lower expression in the Immune-H cluster. FDR, false discovery rate; FC, fold change; DEGs, differential expressed genes; Immunity-L, low immune infiltration; Immunity-H, high immune infiltration.
Figure 4
Figure 4
Correlation between PIGs and TFs. (A) Forest map demonstrating 28 genes related to prognosis. (B) Sankey diagram showing the correlation between 28 PIGs and 19 TFs. (C) A protein-protein interaction network consisting of PIGs and TFs. PIGs, prognostic immune-related genes; TFs, transcription factors.
Figure 5
Figure 5
Construction and validation of an immune-related prognostic model. (A,B) Plots showing the LASSO coefficient profiles and partial likelihood deviance for 28 PIGs, and 10 genes were selected for model construction. (C,D) Patients in the low-risk group showed better OS than those in the high-risk group in both the training cohort (P<0.001) and the test cohort (P=0.007). (E,F) ROC curves of the prognostic model at 1, 3, and 5 years in the training cohort (AUC =0.750, 0.770, 0.819) and the test cohort (AUC =0.637, 0.721, 0.659). (G,H) The OS of GBM patients was negatively correlated with the risk score in the training cohort (R=−0.38) and the test cohort (R=−0.24). (I-L) Distribution of the risk score and survival status of patients in the training cohort (I,J) and the test cohort (K,L). (M,N) Forest plots of univariate and multivariate Cox analyses showing that the risk score was an independent predictor of OS for GBM patients, independent of age and gender (P<0.001). AUC, area under the curve; OS, overall survival; LASSO, least absolute shrinkage and selection operator; PIGs, prognostic immune-related genes; ROC, receiver operating characteristic; GBM, glioblastoma.
Figure 6
Figure 6
Correlation between the genes in the prognostic model and immune infiltrates. NK, natural killer.
Figure 7
Figure 7
Correlation between the prognostic model and GBM-related immune genes. (A-D) CAVIN1 was highly expressed in the high-risk group and positively correlated with the risk score. IDH2 was poorly expressed in the high-risk group and negatively correlated with the risk score. (E-H) PDCD1 was highly expressed in the high-risk group and positively correlated with the risk score. CTLA4 was highly expressed in the high-risk group and positively correlated with the risk score. CAVIN1, caveolae associated protein 1; IDH2, isocitrate dehydrogenase [NADP (+)] 2; PDCD1, programmed cell death 1; CTLA4, cytotoxic T-lymphocyte associated protein 4; GBM, glioblastoma.
Figure 8
Figure 8
TMB analysis. (A) Boxplots showing higher TMB levels in the low-risk group (P=0.01). (B) Kaplan-Meier curves indicating that patients in the high-TMB group had better OS compared to those in the low-TMB group (P=0.06). (C) Patients in the high-TMB and low-risk groups showed better prognosis than those in the low-TMB and high-risk groups (P<0.001). H, high; L, low; TMB, tumor mutation burden; OS, overall survival.
Figure 9
Figure 9
Construction and validation of nomogram. (A) A nomogram incorporating age, gender, and risk score was established. (B) ROC curves of the nomogram for 1-, 3-, and 5-year OS prediction (AUC =0.767, 0.870, and 0.841). ***, P<0.001. AUC, area under the curve; OS, overall survival; ROC, receiver operating characteristic.

Similar articles

Cited by

References

    1. Zuo S, Wei M, Wang S, et al. Pan-Cancer Analysis of Immune Cell Infiltration Identifies a Prognostic Immune-Cell Characteristic Score (ICCS) in Lung Adenocarcinoma. Front Immunol 2020;11:1218. 10.3389/fimmu.2020.01218 - DOI - PMC - PubMed
    1. Gentles AJ, Newman AM, Liu CL, et al. The prognostic landscape of genes and infiltrating immune cells across human cancers. Nat Med 2015;21:938-45. 10.1038/nm.3909 - DOI - PMC - PubMed
    1. Lapointe S, Perry A, Butowski NA. Primary brain tumours in adults. Lancet 2018;392:432-46. 10.1016/S0140-6736(18)30990-5 - DOI - PubMed
    1. Weller M, Wick W, Aldape K, et al. Glioma. Nat Rev Dis Primers 2015;1:15017. 10.1038/nrdp.2015.17 - DOI - PubMed
    1. Campian JL, Ghosh S, Kapoor V, et al. Long-Acting Recombinant Human Interleukin-7, NT-I7, Increases Cytotoxic CD8 T Cells and Enhances Survival in Mouse Glioma Models. Clin Cancer Res 2022;28:1229-39. 10.1158/1078-0432.CCR-21-0947 - DOI - PubMed

LinkOut - more resources